Really Kings
Taher JaliliYou have to pay close attention to one thing on the chart if you trade
PCT Systems(PerfectCryptoTraders): price.
Price is king. Price will tell you all you need to know. yes Price. and PCT is Really King
The wonderful thing that all markets have is this: a history.
The market will tell you where the sweet spot is on the chart.
These sweet spots will be the foundation for everything you do as a Price Action trader.
A sweet spot on the chart is a support and resistance zone.
You may be familiar with the concept of support and resistance, however, support and resistance zones are different from what many traders characterize as support and resistance.
I will call these support and resistance zones by one word— zones.
The eight important characteristics of zones are as follows:
1. Zones are an area, not a price point.
2. Zones are like fine wine; they get better with age.
3. Zones are spots on the chart where price reverses, repeatedly.
4. Zones may be extreme highs or lows on the chart.
5. Zones are where we find trading opportunities.
6. Support and resistance zones rarely need to be modified.
7. Line charts help us find zones.
8. Zones are often seen by many traders.
You may want to take a closer look at each of these eight characteristics.
It is incredibly important that you understand how to draw zones, why you should draw zones on your charts, and understand when these zones become critical for your trading.
Many traders have misconceptions concerning zones. Traders may be familiar with the concept of support and resistance but unfortunately, many misapply this concept to technical trading.
The PCT trader understands that zones are an area on the chart. This is a very distinct concept to a support and resistance line. A support and resistance line indicates a specific price on the chart, but zones are something different. Zones are not a specific price. These zones are, instead, an area, a range.
Let me explain. I prefer to think of these
These zones are critical for the PCT trader; once price reaches a zone, the PCT trader is on alert for a possible trade set-up. Why would the PCT trader want to know once price reaches a zone? Because price has repeatedly turned around at these zones! Knowing what a market has done in the past is critical for the PCT trader, not because the PCT trader assumes the market will turn around again, but because the PCT trader is on high alert, and the market may turn around again.
HOW TO FIND ZONES
Zones are those spots on the chart where price has repeatedly reversed. However, it may be difficult at first for you to find these zones on the chart. There are several sneaky shortcuts that you can use to help develop an eye for finding zones. Some zones are extremely obvious and easy to find. Other zones are a little bit trickier and may be difficult for you to identify if you have not had experience finding zones on the chart. Please keep in mind
these three shortcuts when you are drawing your zones on the chart.
1. Start with a higher timeframe chart.
2. Use a line chart to find the zones on the chart.
3. Ignore minor zones.
The Line Chart Is Your Friend
Marking the zones on your chart is as simple as drawing a line on the chart.
However, if you have not looked at charts in terms of support and resistance zones before, it may be a bit difficult to find precisely where these zones are located. It is important that, as a PCT trader, you “see” these zones.
One brilliant method for finding zones on the chart, and this works particularly well for those traders who are new to finding zones on the chart, is to move to a line chart. Most charting packages will allow you to view the market on a line chart.
A line chart is a chart that offers a continuous line, connecting the closing prices. Rather than showing the open, the high, the low, and the close, such as a candlestick chart, or a bar chart, the line chart simply connects the closing prices.
All of the PCT-trading strategies have three parts:
The first is to identify the support and resistance zones.
The second is to wait for the market to reach one of these zones.
The third is to take a trade once a catalyst prints on one of these zones.
You now understand how to find zones on the chart, and you are ready to learn about catalysts.
Catalysts are powerful price patterns.
These simple price patterns suggest what themarket may do once the market reaches a zone. These catalysts are only useful when they print on a zone; catalysts that are not located on a zone are simply interesting price formations—they are not high-probability trade set-ups.
A very simple and extremely powerful catalyst is the last-kiss trade.
If you have been trading for some time, you have probably seen enough of the markets to know that there are two basic moods of the market, and these moods will be seen in any market in the world.
There is the calm, drifting, directionless, choppy market .
At times, the market will also exhibit strong, powerful explosions characteristic of the trending market.
The market is always in one of these two moods.
WHAT IS A BREAKOUT TRADE?
The breakout strategy involves two phases.
The first phase involves waiting for the market to consolidate.
A consolidated market becomes very choppy and directionless, the trader waits, and watches the market.
The breakout trader is a patient trader.
This strategy is largely based on patience and timing.
There are many versions of this trading set-up, so you might know the drill:
You wait and watch the market when it is calm. You are waiting when the market is trading within a tight range.
Then, eventually the market breaks out and extends beyond the restricted range and rockets off in one direction for a strong, sustained trending move. This is where the wellplaced entry will capture a quick profit at the very least, and may even afford an early entry into a strong, sustained trend.
Identifying the Transition
As a breakout trader you take advantage of the natural rhythm of the market and, in particular, the transition between the boring, restricted movement of the range-bound market and the fierce strong moves of the trending market.
When will you know that the market is changing?
How do you determine that the consolidation period is over?
Will the market offer a clue when it is about to move into a trending phase?
Is it possible to determine when the market ends the directionless phase and begins the strong trending phase?
The answer is yes, and you will use your old friend, the support and resistance zone.
The support and resistance zone will be the threshold by which you judge the movement of the market once again.
This time the support and resistance zone will mark the line in the sand for the PCT version of the breakout trade—the last-kiss trade.
The first step of the last-kiss trade is to identify the consolidation zone. One way to visualize a consolidation zone is to draw a box on the chart.
This box will contain the choppy movements of the directionless market.
This box should encompass the market movement during the choppy, drifting-market phase
The important thing to remember here is that the box, which contains the market activity, is formed by both a support zone and a resistance zone. This box of market activity should pop out on the chart—it should be obvious that the market is stuck between both of the zones. Typically, there will be several touches on either side of the zones.
The consolidation phase inside of the box may continue for some time.
However, once the market breaks out toward either the support zone or the resistance zone, the last-kiss trader takes notice.
For many breakout traders, the move outside of the consolidation box will trigger a trade. However, the last kiss trade is not triggered at this stage. A close examination of a typical, standard breakout trade may be in order.
The typical breakout strategy will follow a series of events.
First, the market consolidates, and a box is drawn around the consolidation.
Second, the market pushes beyond either the support zone or the resistance zone to trigger a trade.
This move beyond the zone is the trade signal.
In fact, standard breakout traders often place buy stop orders above the resistance zone, and sell stop orders below the support zone in anticipation of the breakout. There are, of course, varying degrees of differences among breakout strategies; however, the core principle that guides breakout strategies is this: Once the market breaks out beyond a zone, a trade is triggered.
However, the standard breakout strategies have a very common problem. Many breakout trades end up as losing trades because they are triggered by a fake-out.
What is a fake-out, you ask?
The Fake-Out
The fake-out is the breakout trader’s nemesis. This is the biggest problem with most breakout trading strategies. Many breakout signals offer excellent trading opportunities, but others are triggered by fake-outs. A fake-out is a move outside of the consolidation zone that appears to be a breakout, but instead of continuing on in one direction a strong trend, the market retraces back inside of the consolidation zone. The fake-out always ends up with the market eventually falling back inside the zone defined by both the support and the resistance levels (back inside the box).
Thus, a fake-out is a breakout trade that is triggered by a convincing candlestick that extends beyond a support or resistance zone. This action is followed by the market moving back inside the consolidation box
Once the market retreats back into the consolidation box after a fake-out, price will often languish inside the box for some time. The fake-out is actually quite common, and a quick look at the charts will show how often they do occur. These failed breakouts, the fake-outs, are the primary reason traders find it difficult to consistently apply breakout trading systems. Breakout systems are simply wrong too often. Breakout systems may occasionally grab a great trend early, but fake-outs signal many losing trades.
Why is this the case?
Why are fake-outs so common? Ask any trading guru the question “how often does the market trend?” and, depending on the guru, you will be told that the market trends about 15 to 30 percent of the time. This is precisely why conventional breakout systems often fail. Most of the time, the markets are not ready to start trending; they spend the majority of the time drifting without direction. This is why breakout trades often fail.
Would it be nice if you could tell when a breakout is going to continue onward beyond the consolidation box? What if there was a way to avoid the dreaded fake-out? Would you like a trading system for identifying the breakouts most likely to continue onward in the direction of the trend?
There is such a system, and it is called the last-kiss trade.
The last kiss is a specific type of breakout that suggests a breakout will develop into a strong trending move.
WHAT IS A LAST KISS?
The last kiss is a catalyst specifically designed to avoid the fake-out. If you have traded breakout systems in the past, you know how often these fake-outs will occur. Although the last kiss is not guaranteed to avoid all fake-outs, it will provide you with a valuable method of filtering out many of the very worst fake-outs that fizzle quickly.
The last-kiss trade is a simple method that confirms the validity of the breakout signal, and it is based on a sound naked-trading principle.
This is known as the Re touch principle.
THE RE TOUCH
The market trades beyond a zone before returning to the zone from the other side to confirm the importance of the zone.
A close examination of the last-kiss trade will illustrate how this trade incorporates the re touch principle.
The last-kiss trade is not triggered on this initial breakout candlestick but is, instead, triggered much later. The standard breakout trade is initiated when the market moves beyond one of the support and resistance zones. The last-kiss trade is not triggered until later.
Why is it important to wait?
what is the common problem with many breakout trades? These trades often quickly fizzle as the market moves back inside of the consolidation box. Not only that, but the market often moves back inside the consolidation box quickly. This tendency, the tendency for failed breakouts to quickly jump back inside the consolidation box, is the peculiar behavior that is important to the last-kiss trade.
Most of the failed breakouts will quickly jump back inside the consolidation box. However, a true breakout—those trades that extend beyond the consolidation box and then keep travelling—will often move back to the support and resistance zones for a Re touch.
The last-kiss trade is a specific subset of the breakout trade. Not every breakout trade is a last-kiss trade, but every last-kiss trade is a breakout trade.
In other words, the last-kiss trade is based on the Re touch principle. The market will often come back to a significant zone once the market has expanded beyond the zone, and the last-kiss trade is designed to take advantage of this typical market behavior (once the market retreats and moves back toward the consolidation box). The reason for waiting for the market to come back to the consolidation box is to confirm that the market will, indeed, respect the boundaries that were formed by the consolidation box. In this way, the trader will jump on the trade only when the market comes back to kiss a consolidation box
This is why the trade is known as the last kiss. The trade is initiated only when the market returns to the consolidation box to kiss one of the support and resistance zones that formed during the consolidation. This is obviously a very different entry to the standard breakout trading strategy.
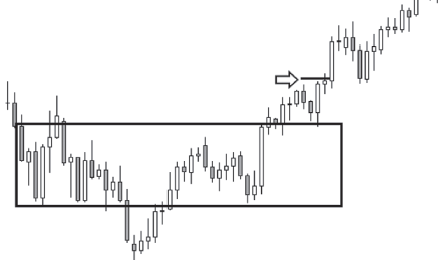
Notice how the market prints a very nice bullish candlestick at the edge of the consolidation box It is not enough for the market to simply re-touch the zone and then pause; the market must print a strong candlestick in the direction of the breakout to trigger the last kiss. Big shadows such as the last-kiss candlestick
Trading the Retouch
Once the market returns to the edge of the consolidation box, it must print a strong candle in the direction of the breakout. Therefore, if the breakout is a bullish breakout (up), then the retouch candlestick must be a strong bullish candlestick. A buy stop is placed above the high of this bullish candlestick
Likewise, for the bearish breakouts, when the market comes back to retouch the edge of the consolidation box, the market must print a bearish candlestick. The entry for the last kiss is a sell stop placed below the low (see arrow) of the bearish candlestick, just as you see in below Figure
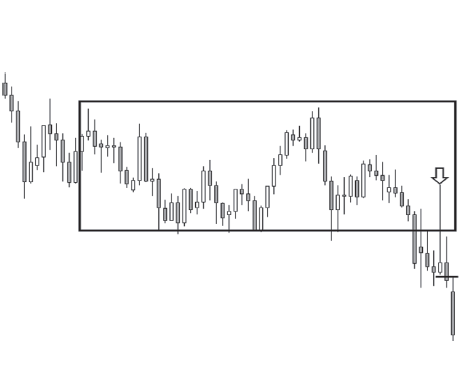
Once the market trades through the entry price, the last-kiss trade is on.
There are two stop loss signals for the last-kiss trade.
The first stop loss is the emergency stop loss, and this is placed at the midpoint of the consolidation box. Under most circumstances this stop loss will not be hit.
The calculation of this emergency stop loss is simple.
1. Subtract the resistance-level zone from the support-level zone.
2. Record the number of pips; this is the width of the consolidation box.
3. Divide the width of the consolidation box by 2.
4. Add this amount to the support-level zone.
There is another exit signal for the last-kiss trade that is more likely to be triggered than the emergency stop loss. If the market closes back inside the box after the last-kiss trade is triggered, the trade is exited. This will usually mean taking a much smaller loss than the emergency stop loss
This exit signal is usually triggered for a much smaller loss than the emergency stop loss.
a last-kiss trade that prints this exit signal. The trade is over once a candlestick closes back inside the box. Most of the failed last-kiss trades will be exited with this rule. Under most circumstances, it is unlikely that the emergency stop loss at the midpoint of the consolidation box will be hit. The second stop loss is much more likely to be hit, which means that the average losing trade for the last-kiss trade is quite small. This is an attractive feature of the last-kiss trade. Many naked traders enjoy trading the last-kiss trade because this second stop loss significantly reduces the size of the losing trades.
Finding Profit after Kisses
One very simple exit for profitable last-kiss trades is to exit the trade at the next zone.
TRADING THE LAST KISS
The last-kiss trade is a nice way to trade high-probability breakout trades.
Here are the steps for the last-kiss trade:
1- Wait for price to consolidate in a box between two zones.
2- The box should have at least two touches on both zones.
3- Wait for price to break beyond one of the zones.
4- Once price returns back to the consolidation box, wait for the market to print a last-kiss candlestick on the edge of the box.
5- For sell trades, a sell stop is placed below the low of the last-kiss candlestick, and for buy trades, a buy stop is placed above the high of the last-kiss candlestick.
6- Emergency stop loss is placed in the midpoint of the consolidation box.
7- The profit target is the nearest zone.
Test the last-kiss trade; you may be surprised at how well this trading
system filters out fake-outs.

Out of intense complexities intense simplicities emerge—Winston Churchill
در این مقالات سعی شده تا بصورت ساده و قدم به قدم شما را با #ارزدیجیتال #صرافی های داخلی و نحوه استفاده و خرید و فروش در آنها و آموزش #ترید در #بایننس #تحلیل_تکنیکال و هرچه مورد نیاز شما در این بازار می باشد. آشنا کنیم.
استفاده از این مقالات با ذکر منبع رایگان و بلامانع میباشد.

این آموزشها توصیه و یا تشویق برای معامله یا دستوالعمل معاملاتی و یا مشاورهی سرمایهگذاری نیستند. و به تنهایی برای انجام معامله کافی نیستند. همه آموزشها در کنار هم به شما کمک میکند درک بهتری از بازارهای مالی و معامله کردن پیدا کنید.
استراتژی و سیستم خودتون رو شکل بدید. و با تحقیق کامل در مورد ریسکهایی که این بازارها دارند تصمیم به معامله کردن یا نکردن بگیرید.
با ارزهای رمزنگاری شده آشنا شوید و نحوه کار آنها را یاد بگیرید.
PCT Systems(PerfectCryptoTraders)
مفاهیم بنیادی
سوخت اتریوم چیست؟ ETH Gas Station
سیستم اثبات کار (PoW) و اثبات سهام (PoS) چه تفاوتهایی با یکدیگر دارند؟
چرخه های زمانی حرکت قیمت در بازار
Compression befor the big jump
بهترین زمان برای ترید در فارکس
سیر تا پیاز
آموزش ثبت نام در پلتفرم دموی بایننس
آموزش جابه جایی ارزهای مجازی مابین صرافی های داخلی و کیف پول اکانت بایننس
نصب متاتریدر4 و ساخت حساب دمو فارکس (حساب آزمایشی)
MyfxBook.Com معرفی نحوه اتصال اکانت (سیر تا پیاز)
THE ASCENDING AND DESCENDING TRIANGLE CHART PATTERN
Psychology behind Ascending and Descending Triangles Pattern
اشخاص

@PerFectCryptoTrader کانال تلگرام
@PerFectCryptoTraders گروه تلگرام

Twitter Telegram WhatsApp Gmail Instagram Instagram