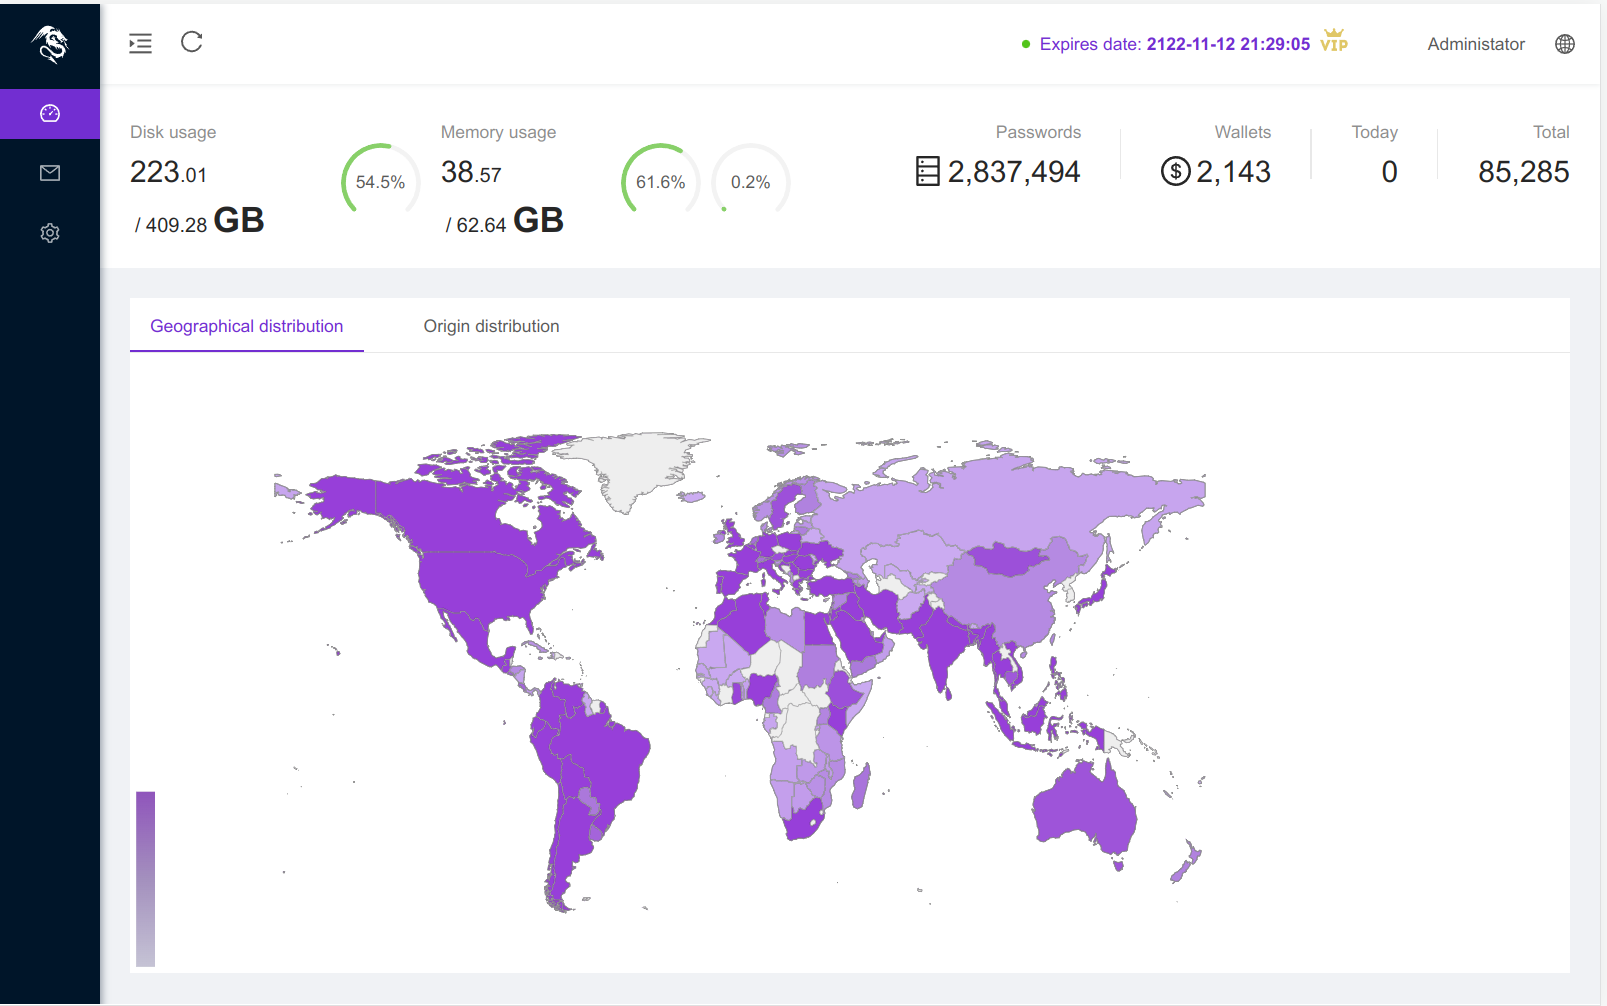
WEB-Panel-Dashboard
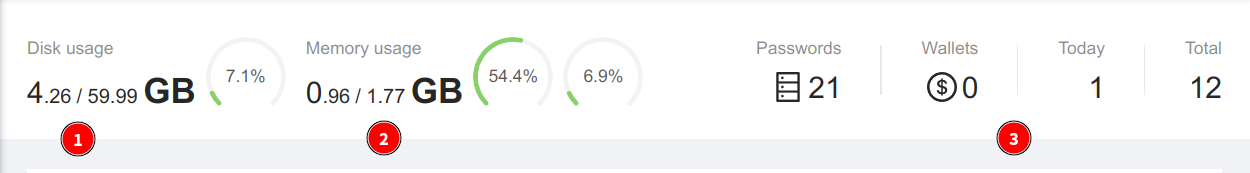
2 Server memory usage, two pie charts. The first is a percentage of total server system memory usage, which includes memory usage taken up by file-level storage. Don't worry about it showing a high percentage. Secondly, the use of memory occupied by the server program. If this is over 50%, consider upgrading the memory configuration.
WEB Panel-Journal-information
https://telegra.ph/Rhadamanthys-Stealer-12-17-2
https://telegra.ph/WEB-Panel-Dashboard-12-17
https://telegra.ph/Custom-admin-panel-entry-address-01-06
https://telegra.ph/WEB-Panel-Logs-12-19-2
https://telegra.ph/WEB-Panel-Temporary-12-17-2
https://telegra.ph/WEB-Panel-Origin-12-17-2
https://telegra.ph/WEB-Panel-grab-12-23
https://telegra.ph/WEB-Panel-Custom-Tags-12-17-2
https://telegra.ph/WEB-Panel-Extension-12-17-2
https://telegra.ph/WEB-Panel-Server-12-17-2
https://telegra.ph/WEB-Panel-Telegram-Bot-12-17-2
https://telegra.ph/WEB-Panel-Task-12-17-2
https://telegra.ph/WEB-Panel-Build-12-17
Contact to buy.
Tox: 5BCB80569AC334FDA5B7806ABC05DDFE3AF8F126E08D0EA6D21DA3C13B43F164188C3EEE89E9