COMMUNISM OF THE 21ST CENTURY IN THE NYI QUARTER - UN VASYUKI 🇺🇳
BRitNEy spEaRs HolidAy eDItIOn 😍😎

Well, what cretins, came?

We found and analyzed a number of data and it turned out that NOAA – the US National Oceanic and Atmospheric Administration, which is referred to by the carbon sectarians of the Oval Office and other homegrown climatologists, overestimated long-term forecasts of an increase in world temperature by 30-50% due to the incorrect location of climatic stations (they were located in urbanized areas with higher temperatures or showed incorrect data due to the heat sink effect through a lawsuit). hard materials like asphalt and concrete.) The study was conducted by the management itself after mass criticism of their department for non-compliance with its own rules.
https://journals.ametsoc.org/doi/10.1175/JAMC-D-19-00..
Previous criticisms and research:
Management artificially overstated temperatures due to the location of stations in urbanized areas with higher temperatures.
https://fallmeeting.agu.org/2015/press-item/new-study..
https://pielkeclimatesci.files.wordpress.com/2011/07/..
https://wattsupwiththat.files.wordpress.com/2015/12/a..
Management artificially overestimated the temperature due to the incorrect location of stations in the mountains.
https://agupubs.onlinelibrary.wiley.com/doi/full/10.1..
Illustrative examples of mass incorrect location of stations:
https://wattsupwiththat.files.wordpress.com/2009/05/s..
All claims of observed warming since 1973 are explained by NOAA adjustments to take into account the indicators of incorrectly located climatic stations. Before the post-facto warming adjustments were not observed.
http://www.drroyspencer.com/2012/04/ushcn-surface-tem..
After adjusting for population density near U.S. climate stations, the trend toward global warming evaporates completely.
http://www.drroyspencer.com/2012/04/regional-u-s-popu..
http://www.drroyspencer.com/2012/04/new-u-s-populatio..
All U.S. climate data over the past 40 years is a blatant lie.
Even before the current $2 billion, in February 2020, a noble crook, fisherman and yachtsman who sometimes meets With Russian fishermen in the Suez Canal, Bezos, announced a $10 billion contribution on his behalf to a fund to fund scientists involved in the development of technologies to combat climate change. Amazon has also built about 100,000 Rivian electric vehicles, and by 2040 wants to achieve carbon neutrality of its business.

We can guarantee you Joseph neutrality on your account, after the arrest and confiscation of your company and assets for Mega fraud and money laundering through the funds of well-known defendants in the corona 🤴 Pandemic project and the washing laundries of the mechanic of the communist UN 🇺🇳 Guterres.
DELIBERATE DISTORTION OF FACTS AND OUTRIGHT LIES ABOUT CO2

A group of Republican senators in the United States is demanding that Biden report how much carbon emissions into the atmosphere made the plane that delivered him on the way to the climate conference in Glasgow.
"One of the main goals of COP26 is to identify opportunities to reduce carbon dioxide emissions into the atmosphere. We ask that the U.S. Court of Auditors collect and submit to Congress information on the total amount of carbon emissions into the atmosphere that occurred as a result of the delivery of President Biden and his 13 political appointees," reads the open letter, which was signed by Senators Joni Ernst, Tom Cotton and Shelley Capito. In their letter, Republicans criticized the chief of staff for what they see as ineffective energy policies that have put the country "even more dependent on its rivals." Intergovernmental Panel on Climate Change [IPCC, 1]
https://en.wikipedia.org/wiki/Intergovernmental_Panel_on_Climate_Change
has a lobbying habit of distorting data on the content of CO2 in the atmosphere and its effect on the climate. This article will analyze all the distortions, subjectivity, politicality and ignoring of scientific facts by misleading international intergovernmental expert organization. There is a lot of text – be prepared. All [links] are active. Let's start with some of the most basic facts about CO2 that illustrate the discrepancy between what the IPCC claims and what science knows.
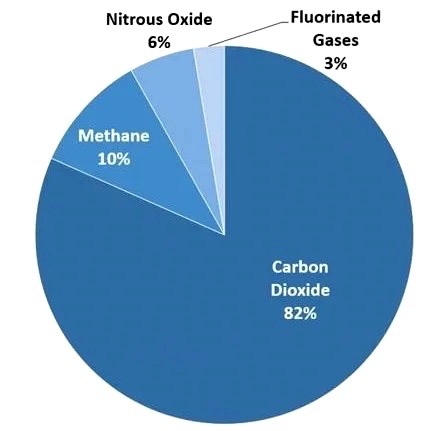
Natural carbon dioxide (CO2) levels are only 0.04% of Earth's total atmosphere. [2, 3]
https://sciencing.com/percentage-carbon-dioxide-up-earths-atmosphere-4474.html
This is not the most important and especially not the only greenhouse gas, as the majority of the population thinks about it thanks to climate propaganda.
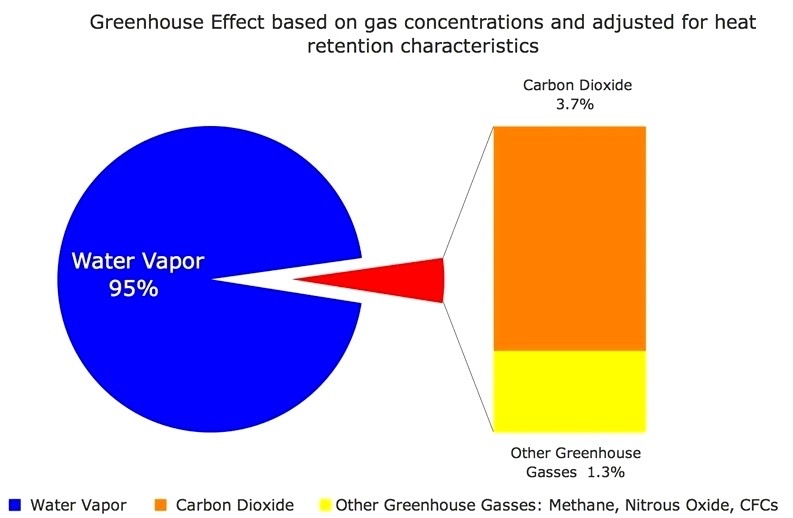
Water vapor, the volume of which accounts for up to 95% of all greenhouse gases of the planet[4],
https://en.wikipedia.org/wiki/Atmosphere_of_Earth
is the most important and common greenhouse gas.
Another relevant greenhouse gas is methane (CH4), but it accounts for only 0.000185% of all atmospheric gases, or 0.036% of all greenhouse gases, and proponents of global warming have no idea where it comes from. [5, 6]
https://phys.org/news/2019-03-methane-atmosphere-surging-scientists.html
https://eos.org/research-spotlights/rising-methane-emissions-could-derail-the-paris-agreement
Take the table [7], which evaluates the efficiency of various greenhouse gases.
https://en.wikipedia.org/wiki/Greenhouse_gas
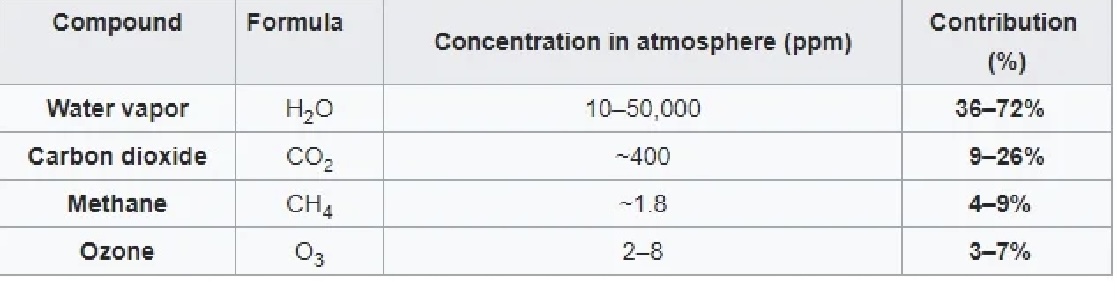
We clearly see that the main greenhouse "pest" is water vapor. However, pay attention to the range of these assessments – if someone does not have a political agenda, he makes all the measures taken completely meaningless.
With such a spread, it is impossible to claim that a certain gas causes an exact percentage of the greenhouse effect, although this does not prevent climatologists from throwing loud and frightening forecasts. Moreover, in order to somehow isolate CO2, contrary to the data on the most climate-affecting water vapor, climatologists came up with a special indicator called "climate sensitivity", according to which CO2 has become a more "efficient" greenhouse gas. For the best attempts to determine the "efficiency", a diagram of the "Global Warming Potential" was created [GWP, 8],
determining the degree of impact on global warming of various greenhouse gases. It is very similar to the diagram of ozone-depleting substances[9, 10],
https://www.epa.gov/ozone-layer-protection
created after dubious claims made without scientific supporters or climate change skeptics that CFCs destroy ozone in the upper atmosphere. [11, 12]
https://www.tandfonline.com/doi/abs/10.1080/09644010701251656
http://dip21.bundestag.de/dip21/btd/11/080/1108030.pdf
Estimates of annual CO2 emissions from human activities are also made by the IPCC, and are currently estimated at 35.9 GtCO2 [13]
https://www.globalcarbonproject.org/carbonbudget/archive/2015/GCP_budget_2015_v1.02.pdf
or 9,855 GtS for 2014[14]
https://cdiac.ess-dive.lbl.gov/ftp/ndp030/global.1751_2014.ems
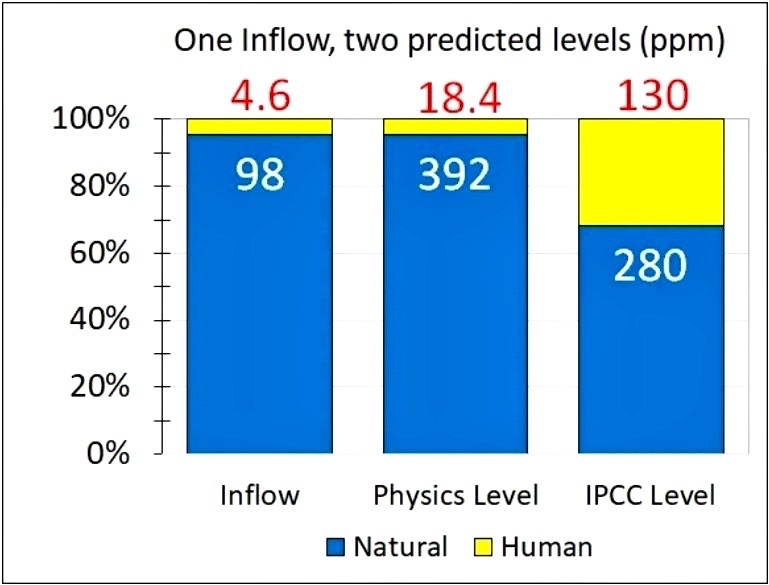
emissions from fossil fuels, which is 4.6 ppm emissions/year versus 98 pmm/year from natural phenomena, that is, less than 5% of our planet's natural emissions. [15]
The IPCC surprisingly agrees with this data, but nevertheless continues to claim that a 100% increase in carbon dioxide concentrations from the total co2 increase of 30% since the beginning of the industrial revolution is caused only by human emissions, which is completely contrary to science.
Contrary to science and put forward in their early reports the idea that the period of time during which CO2 remains in the atmosphere is at least 100 years. [16]
https://en.wikipedia.org/wiki/Greenhouse_gas#Global_warming_potential
After the emergence of reliable studies and evidence that the actual time of CO2 in the atmosphere is actually ~4 years[17, 18],
https://www.sciencedirect.com/science/article/abs/pii/0360544293900178
https://www.sciencedirect.com/science/article/pii/S0921818116304787
this figure[100 years] has simply ceased to appear in official records, but continues to be used in the organization's methodology. Take a look at how the IPCC Bern method works compared to the correct model using the proven 4 years.
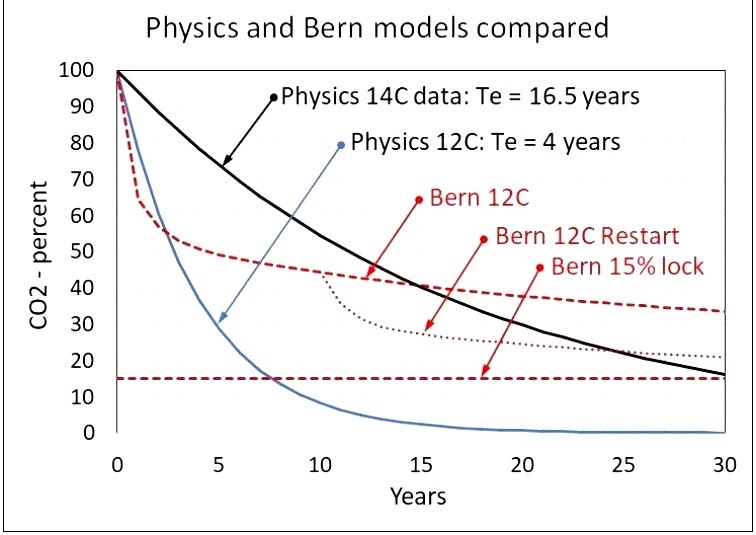
As you can see, using the correct methodology, the CO2 concentration decreases statically according to the real data, while the IPCC model using the incorrect model instantly ceases to correspond to itself after a normal reboot of the model at any given time.
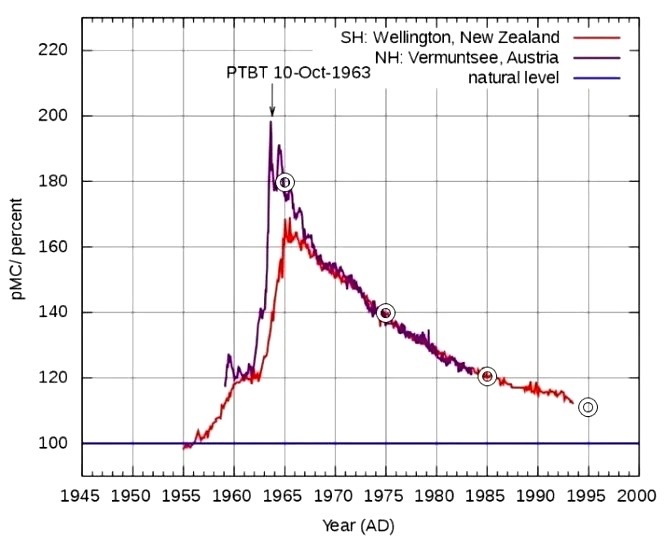
In particular, Bern's model does not take into account real data, such as the sharp increase in radiocarbon concentration in the 1960s due to the testing of atomic bombs, which led to an 80% increase in radiocarbon concentration, but exponentially decreased to its previous equilibrium level within 40 years.
The IPCC methodology, thanks to incorrect data, is focused on the most inflated and untrue future indicators of CO2 and global temperatures, and instead of changing the methodology, the organization only hushes up false data, which tells us about the politicality, not the scientificity of the organization.
Based on carbon emissions of 4.6 pmm/year from human sources * 4 years in the atmosphere, the total CO2 emissions from humans are ~18 ppm. At the current concentration of CO2 in the atmosphere at 415 ppm[19],
the immediate return of humanity to the Middle Ages would only reduce CO2 concentrations to 397 ppm. [20]
https://electroverse.net/without-human-emissions-co2-levels-would-be-392ppm/
Feel the meaninglessness of this result.
Remark: Studies have shown that the current CO2 level for plants is three times lower than optimal. Empirical data on CO2 levels in commercial greenhouses indicate optimal yields at levels between 1000 and 1200 ppm. [21]
http://www.omafra.gov.on.ca/english/crops/facts/00-077.htm
But let's not dwell on the methodology of the organization alone – let's look at its reporting.
Here is the 2001 IPCC table.
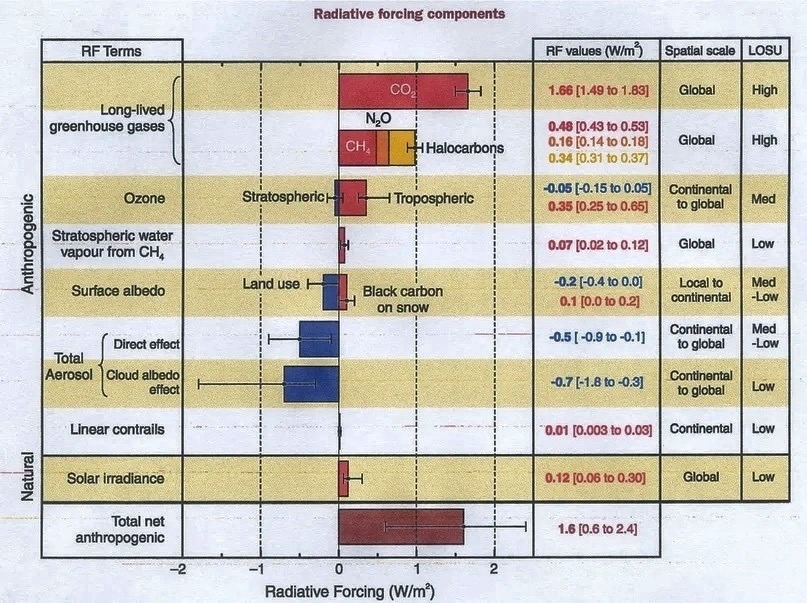
As we can see, an intergovernmental climate organization has forgotten or deliberately failed to introduce some greenhouse gas 💨 ...
But what should be noted from the fact that they did not forget:
» When mentioning the Sun, only solar radiation is indicated – this is not the only way that a star affects the Earth's climate. In addition, the IPCC lists only human causes of climate impacts, as stated in the UN Convention [22],
http://unfccc.int/resource/ccsites/zimbab/conven/text/art01.htm
therefore, it remains particularly unclear how humans affect solar radiation.
The right column [LOSU] is the level of scientific understanding, while the claims of "high" understanding in it are unscientific.
» There are 9 items in the list. Only two of them are high, one is medium, the other six are low. If the IPCC itself does not understand how much 6 factors out of 9 affect the climate, it raises questions about the competence of the applications.
» Total human-induced climate change averages 1.6 W/m^2 [Between 0.6 and 2.4] Now let's compare this report with the one published in 2007.
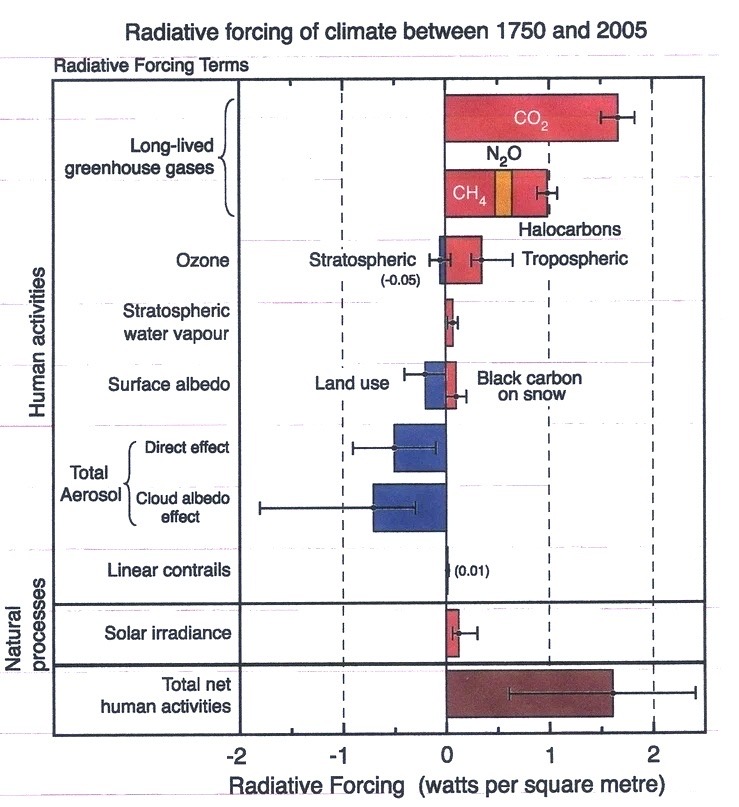
» The column of scientific understanding is gone.
» The rf ratings column is gone.
» The assessment of the range of human exposure has disappeared.
" The overall anthropogenic impact, on the eye[in the scientific spirit of the organization], appears to remain at the same level[1.6 W/m^2], indicating that the claimed increase from CO2 has not even been noted. The 2013 report returned a column with a scientific understanding of the factors.
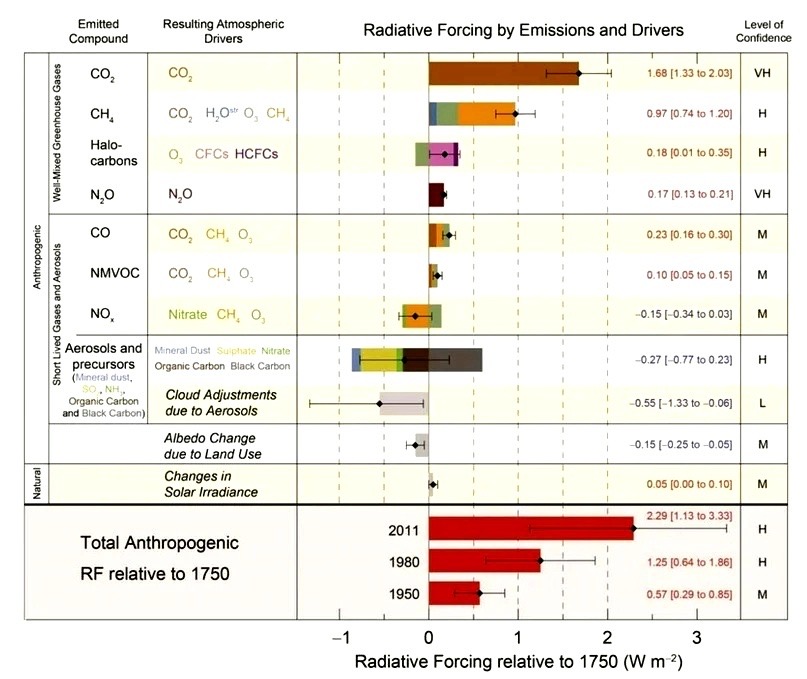
Despite the increasing discrepancy between projected temperatures due to rising CO2 and real data, the IPCC has not been ashamed to include major greenhouse gases in the "Very High Scientific Understanding" category. The misunderstanding of the IPCC reports is evident by the flying log, but something has not yet been indicated. And to search for this "something" let's go to the website of the Environmental Protection Agency of the US government[23],
https://www.epa.gov/ghgemissions/overview-greenhouse-gases
which cooperates with the IPCC[24],
https://www.epa.gov/warm/versions-waste-reduction-model-warm
and examine the list of greenhouse gases.
Carbon looks convincing, but again something is wrong... Although, we know what is missing here.
This ⬇️
95 percent fatty water pacman, which is the most important and strongest greenhouse gas on our planet Earth 🌍. Intergovernmental climatologists did not say a word about it to the population of their nation-states in the largest reports, did not highlight a single line with statistics and did not even indicate it in the list of greenhouse gases.

All references to water vapor for the sake of the frightening kind of carbon were simply removed from all intergovernmental statistics, but solar radiation was included in it.
Comments on this falsification are superfluous.
But since we're dissecting the material, not just criticizing, let's try to justify it. Let's open the IPCC's responses to criticism of their 2007 report. Unexpectedly, the organization admits:
- "Water vapor is the most common and important greenhouse gas in the atmosphere." - They answer, but then explain why they are going to ignore it - "However, human activity has only a small effect on the amount of atmospheric water vapor." [25]
https://wg1.ipcc.ch/publications/wg1-ar4/faq/wg1_faq-2.1.html
Apparently, this small influence is inferior even to the influence of people on solar radiation.
But the criticism didn't end there, and in the FAQ of the 2013 IPCC report on page 666, the organization responded in more detail. [26]
https://www.ipcc.ch/site/assets/uploads/2018/02/WG1AR5_Chapter08_FINAL.pdf
We will not cite everything and cut out a few unimportant pieces from our analysis, and you can read the full answer at the link:
The amount of water vapor in the atmosphere is controlled mainly by air temperature rather than emissions, so scientists consider water vapor to be a feedback agent rather than a climate changer. Anthropogenic emissions of water vapor have only a minor impact on the global climate. However, they have a significant impact on the concentration of water vapor in the stratosphere. But in recent decades, the concentration of water in the stratosphere has varied significantly, so the full extent of this influence is not well understood, and may not be as climate-influencing as the feedback process. Water vapor is not a significant initial factor, but, with all this, is one of the main factors of climate change. This section is so full of contradictions and distortions, as if I had bipolar disorder – if the text had a personality. Three opinions fit into one. But, in fact, their argument completely missed an important point: they don't know what contribution water vapor makes because they don't have critical information; they don't know how many people produce water vapor 💨; how much water vapor is in the atmosphere and how much it changes naturally. Instead of working and developing appropriate sources of information, the absence of which is a big problem, they only dismiss critics and do not bring benefits. For science, the impact and change of each gas matters, but the anti-scientific political IPCC turns a blind eye to criticism and uses its standard exaggeration technique known as global warming potential to increase people's exposure to CO2 and CH4 while reducing the role of water vapor.
But what is the global warming potential? The 2013 IPCC report answers this[27, p. 710]:
https://www.ipcc.ch/site/assets/uploads/2018/02/WG1AR5_all_final.pdf
"GWP is a time-integrated radiative forcing [RF] calculated by the pulsed radiation of a given component relative to pulsed radiation of equal mass CO2. The GWP was presented in the first IPCC assessment, which states: "It should be emphasized that there is no universally accepted methodology for combining all relevant factors into a single global warming potential for greenhouse gas emissions." Thus, the potential is derived by the method of "finger in the sky". The search for values for it leads to such an infinitely stunning scattering of numbers that even the director of NASA wrote about the extremely underestimated influence of long-wave absorbers [including water vapor], basing his statement on the results of data from a self-generated computer model. [28]
https://pubs.giss.nasa.gov/abs/sc05400j.html
The IPCC deliberately ignores such claims – it is only interested in stratospheric water vapor from CH4, but even knows almost nothing about it:
"Since trend estimates from the cited literature are used here, issues such as recording data of different lengths, incomparability of measurement methods, and different methods of calculation add uncertainties in trend estimation." [29, p. 170]
http://www.climatechange2013.org/images/report/WG1AR5_Chapter02_FINAL.pdf
Although if they were interested in tropospheric water vapor, they could use measurements from research company RSS, which has combined many radiometers operating since 1987. [30]
http://www.remss.com/measurements/atmospheric-water-vapor/
But the IPCC does not, despite the company's passage of the barrier of 30 years of recorded statistics. But it's actually even worse than everyone might think. Consider the number of personal values and subjective decisions associated with this supposedly scientific process from the IPCC report[25, p. 663]:
https://www.ipcc.ch/site/assets/uploads/2018/02/WG1AR5_Chapter08_FINAL.pdf
/ GWP is a metric that has been used in politics.
It integrates RF substances into the selected time interval relative to CO2. GTP is the ratio of the change in global average surface temperature at a selected point in time from a substance of interest to a CO2 value. There are significant uncertainties associated with both GWP and GTP, and relative uncertainties related more to GTP. There are also limitations and inconsistencies associated with indirect effects handling and feedback. The values are very dependent on the type of metric and the time horizon. The choice of metric and time horizon depends on the specific application and which aspects of climate change are considered relevant in that context. Metrics do not define policies or goals, but facilitate the evaluation and implementation of multidisciplinary policies to achieve specific goals. All metric choices contain implicit value judgments, such as the type of effect in question and weighing the effects over time./ [25, p. 663]
https://www.ipcc.ch/site/assets/uploads/2018/02/WG1AR5_Chapter08_FINAL.pdf
Thus, the organization's definition of climate change, based on subjective data and outdated methodologies, allows the IPCC to ignore anything that does not fit their hypothesis.
Finally, let's move on to the IPCC's biggest Mega Lie, the assessment of the effect of CO2 on Earth's temperature.
Let's first recall the ipCC's main argument about the optionality of observing water vapor – the initial increase in its concentration is due to an increase in temperature, but not vice versa.
The relevant quote from the IPCC, which is very remarkable, has already been given on page 666 of the 😎 of their report. [26]
https://www.ipcc.ch/site/assets/uploads/2018/02/WG1AR5_Chapter08_FINAL.pdf
But in order not to be limited to just one source, we will add a few more to the heap.
The U.S. government website provides an additional explanatory note from the IPCC in a green box[31]:
"Warming caused by the production of other greenhouse gases increases the amount of water vapor in the atmosphere, as higher temperatures make it easier for water to evaporate and stay in the air as steam. This creates a positive 'feedback loop' in which warming leads to even greater warming."
The same arguments are made by one of the major climate change communities. [32]
https://skepticalscience.com/water-vapor-greenhouse-gas-intermediate.htm
And one more thing. [33]
Well remember the Lady and Gentlemen this argument: water vapor does not make sense to consider, since it does not provoke the initial increase in the temperature of the planet.
It is CO2 and methane that increase the temperature and lead to an increase in the concentration of harmful water vapor.
We immediately refute these claims with a relevant study – despite the increase in world temperature and the increase in the concentration of CO2 in the atmosphere between 1945 and 2014, the concentration of water vapor over the same period steadily fell. [34]
https://www.sciencedirect.com/science/article/pii/B9780128045886000094
After such a successful performance, we move on to carbon.
In the main hypothesis of climatologists it is said: an increase in the concentration of CO2 causes an increase in temperature.
In 1999, after a survey of the Antarctic ice core, proof of this assumption was published[35, 36],
https://www.nature.com/articles/20859
http://www.daviesand.com/Choices/Precautionary_Planning/New_Data/
which was soon used in the 2001 IPCC report. [37]
https://www.ipcc.ch/ipccreports/tar/wg1/072.htm
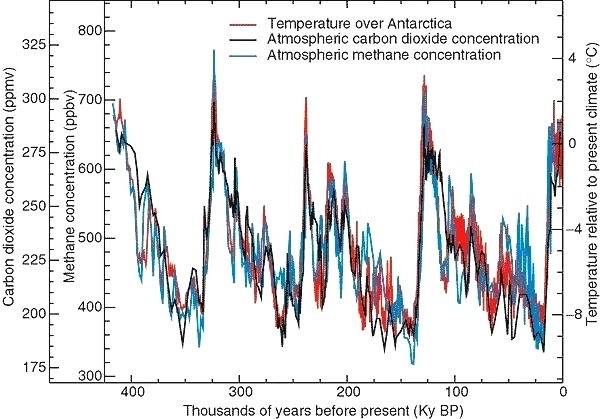
We invite everyone to enjoy in a different perspective of resolution.
And here it seems – finally, irrefutable ... 2 years later, they were refuted.
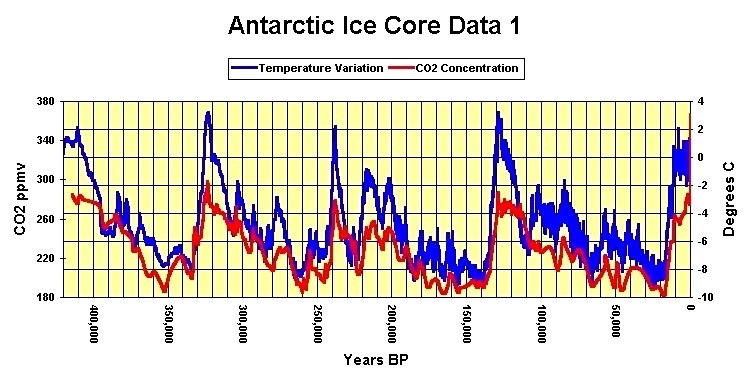
After a more detailed analysis, it turned out that the growth of CO2 began only ~ 800 years after the increase in temperature. The relevant research results were published in 2003 and completely refuted the existing IPCC hypothesis. [38, 39]
https://science.sciencemag.org/content/299/5613/1728
http://hyperphysics.phy-astr.gsu.edu/hbase/thermo/icecore.html
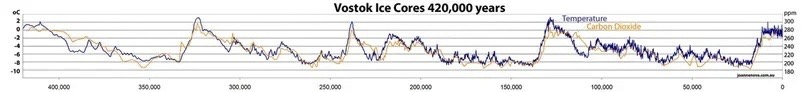
Since it is very difficult to see the lag on the total 400 thousand-year-old graph, I apply a text data format if you want to understand in more detail: once[40], two. [41]
https://cdiac.ess-dive.lbl.gov/ftp/trends/temp/vostok/vostok.1999.temp.dat
https://cdiac.ess-dive.lbl.gov/ftp/trends/co2/vostok.icecore.co2
But the IPCC would not be the IPCC, had it been sensible if it had reviewed the study and adjusted its course – the study simply was no longer talked about.
In 2011, based on NOAA data, another graph was also constructed showing short-term values and showing that CO2 growth occurs after temperature rises, not before. [42]
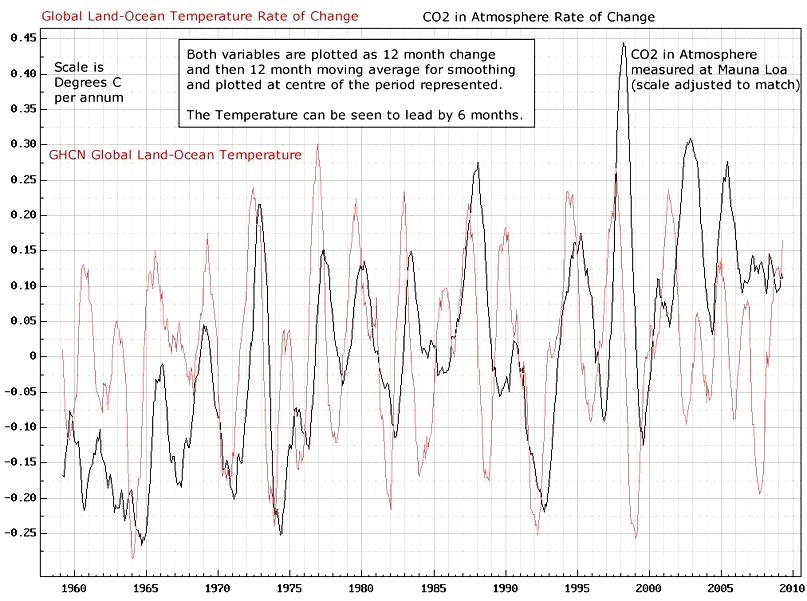
However, in 2010, a lot of data was collected, also demonstrating that the short-term increase in CO2 concentration is due to an increase in temperature, and not vice versa, which refutes the IPCC's argument with their own argument. [43]
While the long-term effect of CO2 – take a look at the colleagues of climatologists!
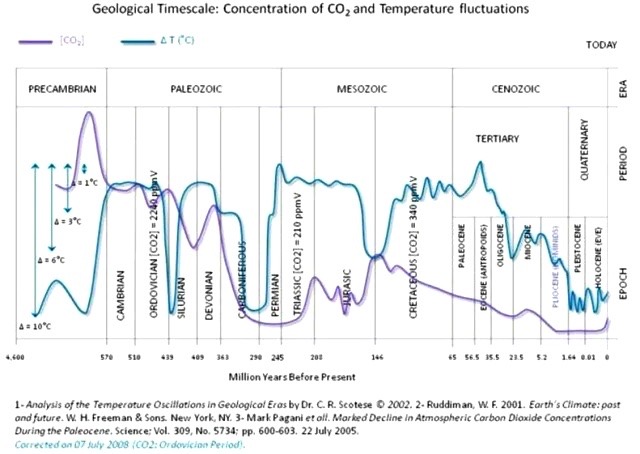
It is clearly seen here that there is no correlation between the concentration of carbon dioxide and the temperature on the surface of the earth. During the second half of the Carboniferous period, the Permian and the first half of the Triassic period, 250-320 million years ago, carbon dioxide concentrations were half as low as they are today, but the temperature was 10ºC higher. Oxygen in the atmosphere during this period ranged from 15 to 35%. From the Cretaceous to the Eocene 35-100 million years ago, high temperatures were accompanied by a decrease in carbon dioxide concentrations. Therefore, the theory that the concentration of carbon dioxide is associated with the temperature of the earth's surface is fundamentally wrong. Plant growth in the Carboniferous period caused a decrease in atmospheric oxygen and carbon dioxide, forming the basis for large deposits of dead plants and other organisms. Plant debris became the basis for peat and coal. Smaller organisms were responsible for the oil and gas that came from millions of years of heat and pressure from geological changes; mountain formation, erosion, accumulation, volcanic eruptions, sea level changes and continental movements. Marine organisms used carbon dioxide to create shells and coral polyps, becoming the basis of limestone rocks. And the very idea of 💭 and the idea proclaimed by the IPCC, that any energy received must be instantly "balanced", initially implies a completely dead world in which there is no place for the formation of a modern atmosphere or for the development or maintenance of living organisms and their ability to accumulate energy or release it. The increase in the concentration of CO2 in the atmosphere is caused by the return to the atmosphere of some of the gas that once existed, and it contributes to the growth of forests, crops, fish, shellfish and coral polyps in the ocean. Thus, increasing CO2 is absolutely beneficial to the "environment" and there is no evidence that this gas causes harm. Based on the fact that a lot of multi-vector and versatile arguments have good reasons to refute absolutely all the arguments of the organization without exceptions, it would be logical to assume that the effectiveness of CO2, as a greenhouse gas, as a result of this, should at least be questioned, but this lie has only become even more expensive for the taxpayers of nation states, and even promises under the current administration of the White House to completely ruin Americans and the country as a whole. The IPCC simply ignored all this information. Monopolistically controlling the climate data of all governments of the world, it did not even raise an eyebrow, and the main hypothesis remained so - the growth of CO2 causes an increase in temperature. Incorrect technique, apparently intentionally overstating the concentration of CO2; incompetent reports that gloss over major greenhouse gases; subjectivism and voluntarism in their assessment of their own invented indicators without any specific methodology; and exclusively commercial and political purposes. As the Ladies and Gentlemen can see, all the activities of the IPCC are blatant lies, while their only argument about CO2 has long been refuted. CO2 does not cause an increase in temperature – this increase in temperature leads to an increase in CO2, and this applies only to short-term trends, and not those that affect the environment on a global scale.

But this study explains why ice ages occur every 100,000 years! [44]
https://www.sciencedaily.com/releases/2013/08/130807134127.htm
I am so full in my knowledge that it is as if I have been living for a hundred trillion billion years on trillions and trillions of planets like this Earth, this world is absolutely for me. Understandable, and I am looking for only one thing here - peace, tranquility and this harmony, from merging with the infinitely eternal, from contemplation great fractal likeness and from this wonderful all-union of being, infinitely eternal, wherever you look, even deep - infinitely small, even upwards - infinite large, you know? And you me again with Go hustle and bustle, it's your distribution, it's this your way and your horizon of knowledge and sensation of your nature, it incommensurably chalk compared to mine, you know? It is as if I have long been a deep old man, immortal, well, or there is almost immortal, who is on this planet from its very inception, even when only the Sun just formed as a star, and here is this gas and dust cloud, behold, after the explosion, of the Sun, when it flashed like a star, the beginning to form these coacervates, planets, you know, I have been living on this Earth for almost five billion years and I know it along and across this whole world, and you are some to me... I don't care about your cars, your yachts, your apartments, there, for your good. I was on this planet an infinite multitude, and cooler than Caesar, and cooler than Hitler, and cooler than all the greats, you know, was, and somewhere was the end of stink, even worse, than here. I feel a lot of these states. Somewhere I was more like a plant, somewhere I was more like a bird, there, a worm, somewhere there was just a clot of stone, it's all a soul, you know? It has faces. Similarity is completely diverse, an infinite set. But you do not understand this, so you go to yourself, we in this world as if live different sensations and different aspirations, respectively, different our and the place, different and our distribution. I wish you all the coolest cars that you have, and all the best females, if there are few ideas, turn to me, I will offer you a hundred trillions for each of your ideas, how to do everything. Well, I am all, I go as a deep old man, who has seen the eternal, who has touched the Divine, he himself has become God-like and directed into this infinite, and who in peace, peace, harmony, grace, in this innermost bliss dwells, involved in everything and everything, you know, that's all, this is our difference. So I go to admire the universe, and you go to be filled in the FACETS of some, that's the whole difference, you know, you do not see this eternal infinite, you do not need it. Well, you, so to speak, are more active, like this woodpecker, or an ant, which is very active in its path, so come on, our paths here, of course, have the boundaries of similarity, because everything is one, but I understand you perfectly, but you are unlikely to me, because I kind of contain you in myself, all your nature, it is one small grain of sand there, from what is in me, that's all, so come on, go, go, and I went to enjoy the beautiful autumn sunset on the banks of the warm southern river. That's it, go a step and I'll go.

Triboule and his team from the Department of Peace and U.S. Security 🇺🇸 hopes the information was useful to you Lady and Gentleman. It seems time for us to get together and discuss our plans for the coming 2022 🔜 soon🎄
Sources:
https://en.wikipedia.org/wiki/Intergovernmental_Panel_on_Climate_Change
[2]https://sciencing.com/percentage-carbon-dioxide-up-earths-atmosphere-4474.html
[4]https://en.wikipedia.org/wiki/Atmosphere_of_Earth
[5]https://phys.org/news/2019-03-methane-atmosphere-surging-scientists.html
[6]https://eos.org/research-spotlights/rising-methane-emissions-could-derail-the-paris-agreement
[7]https://en.wikipedia.org/wiki/Greenhouse_gas
[9]http://www.c-f-c.com/gaslink/charts/warmingchart.htm
[10]https://www.epa.gov/ozone-layer-protection
[11]https://www.tandfonline.com/doi/abs/10.1080/09644010701251656
[12]http://dip21.bundestag.de/dip21/btd/11/080/1108030.pdf
[13]https://www.globalcarbonproject.org/carbonbudget/archive/2015/GCP_budget_2015_v1.02.pdf
[14]https://cdiac.ess-dive.lbl.gov/ftp/ndp030/global.1751_2014.ems
[16]https://en.wikipedia.org/wiki/Greenhouse_gas#Global_warming_potential
[17]https://www.sciencedirect.com/science/article/abs/pii/0360544293900178
[18]https://www.sciencedirect.com/science/article/pii/S0921818116304787
[20]https://electroverse.net/without-human-emissions-co2-levels-would-be-392ppm/
[21]http://www.omafra.gov.on.ca/english/crops/facts/00-077.htm
[22]http://unfccc.int/resource/ccsites/zimbab/conven/text/art01.htm
[23]https://www.epa.gov/ghgemissions/overview-greenhouse-gases
[24]https://www.epa.gov/warm/versions-waste-reduction-model-warm
[25]https://wg1.ipcc.ch/publications/wg1-ar4/faq/wg1_faq-2.1.html
[26]https://www.ipcc.ch/site/assets/uploads/2018/02/WG1AR5_Chapter08_FINAL.pdf
[27]https://www.ipcc.ch/site/assets/uploads/2018/02/WG1AR5_all_final.pdf
[28]https://pubs.giss.nasa.gov/abs/sc05400j.html
[29]http://www.climatechange2013.org/images/report/WG1AR5_Chapter02_FINAL.pdf
[30]http://www.remss.com/measurements/atmospheric-water-vapor/
[32] https://skepticalscience.com/water-vapor-greenhouse-gas-intermediate.htm
[34]https://www.sciencedirect.com/science/article/pii/B9780128045886000094
[35]https://www.nature.com/articles/20859
[36]http://www.daviesand.com/Choices/Precautionary_Planning/New_Data/
[37]https://www.ipcc.ch/ipccreports/tar/wg1/072.htm
[38]https://science.sciencemag.org/content/299/5613/1728
[39]http://hyperphysics.phy-astr.gsu.edu/hbase/thermo/icecore.html
[40]https://cdiac.ess-dive.lbl.gov/ftp/trends/temp/vostok/vostok.1999.temp.dat
[41]https://cdiac.ess-dive.lbl.gov/ftp/trends/co2/vostok.icecore.co2
[44]https://www.sciencedaily.com/releases/2013/08/130807134127.htm
PS
A moment of historical madry at the onset of brain menopause 🧠 and a complete lack of conscience.
Scotland in 2019 declared a "climate emergency" under pressure from schoolchildren who missed school in favor of a strike against climate change. Scots are now aiming for zero carbon emissions by 2030 to take place in the former 2050.
https://www.independent.co.uk/environment/climate-cha..
https://www.theguardian.com/environment/2019/feb/15/u..
Presidential candidate Beto O'Lulk then presented his presidential plan to combat climate change and declared, (the patient's condition was not specified) in the best traditions of brain menopause, that / we have 10 years left to reduce carbon emissions or we will all die.
https://www.foxnews.com/politics/beto-orourke-we-only..
https://www.foxnews.com/politics/betos-green-new-deal..
A new study has found that growing artificial meat is detrimental to climate change.
https://www.frontiersin.org/articles/10.3389/fsufs.20..
https://www.bbc.com/news/science-environment-47283162
Unfortunately, eating common meat is also detrimental to climate change.
http://fortune.com/2017/07/19/climate-change-vegan-ve..
But don't despair, scientists have already found a solution – all of humanity should become vegan, and meat should be taxed or banned.
https://www.thenational.ae/uae/health/world-food-day-..
https://www.independent.co.uk/life-style/health-and-f..
Although some believe that this may not be enough.
https://www.dailymail.co.uk/sciencetech/article-64305..
And a new study has shown that global warming affects even listening to music.
https://phys.org/news/2019-04-music-effects-climate.h..
Moreover, in the book of the same researcher you can learn in detail about how music has always been the exploiter of nature and man.
https://mitpress.mit.edu/books/decomposed
But contrary to our efforts, everything may be in vain, because in the atmosphere there was an unexpected acceleration in the concentration of methane, which can reduce all the "achievements" in the field of climate change to nothing, and "scientists" have no idea where it came from. Nature is a mother bitch and here inserts the greatest minds of mankind sticks in the wheels.
https://eos.org/research-spotlights/rising-methane-em..
No wonder Ocasio-Cortez said that due to climate change, it is now "unethical" to have children, and at the University of California, the human fetus began to be called a "parasite" and compare it with cancer.
https://www.newsweek.com/alexandria-ocasio-cortez-aoc..
https://www.campusreform.org/?ID=12165

https://telegra.ph/SERIAL-CRIME-MELODRAMA-CORONA--NEW-IMERIA-21-07-16-2
https://telegra.ph/GLOBAL-KOGAL-CREATE-ARTIFICIAL-HUNGER-Agro-terrorism-08-10

I'll go drink milk and eat meat.
In this case, the area is 136,120,354 km2.

The population of the Earth is the total number of people living on our planet. Today, 7.83 billion people live on Earth. It took humanity more than 200,000 years to reach a population of 1 billion (around 1800) and only about 200 years for that number to grow to 7 billion.
https://telegra.ph/We-expose-another-myth-about-the-overpopulation-of-the-Earth-08-19
According to the estimates of the United Nations Population Fund, the main milestones of the world's population were passed in the following years: