Which crypto index is better?
VizhnitskyWe're testing a number of cryptomarket indices to identify the most suitable for portfolio optimization models, i.e. the one which contains most information on market state, separating market risk from coins' own risks. Based on residuals correlation and estimated regression coefficient stability - precisely, beta stability - CCI30 still remains the best. It is clear now as well that historical data for model estimation have to cover at least one year of daily observations.
This is the second note on modern portfolio theory applicability to cryptomarket. The first part (https://telegra.ph/Crypto-alphas-and-betas-04-30) was dedicated to the concept of systematic and own cryptoasset risks. Stock indices serve exactly to identify systematic "market" risk; we have chosen CCI30 for research earlier, and mostly arbitrarily. This is not the only index, but the best of what I know of (as stems from this note). We have earlier compared it to the total market capitalization inidicator and concluded that capitalization isn't suitable for portfolio model, as the residual yields, not forecast by the index model, still correlate for many coins, i.e. not all information on the market state is contained within its capitalization value. We shall now test a few more indices, chosen by the daily data availability for a lengthy period, as well as by methodological differences. We managed to find four methodologically different indicators:
1) CMC capitalization - the candidate is off already, but supposedly all possible indices based on the highest possible capitalization share coverage are off with it. Particularly, we will not consider CMC200.
2) Weighted-average capitalization of top coins without weight cap (CRIX). Capitalization weight of each coin in these indices corresponds to its share in the total capitalization (i.e. dominance); e.g. bitcoin's weight is app. 50%. To save time and space, we'll say outright that the CRIX results do not effectively differ from those for total capitalization.
3) Weighted-average capitalization with capped weights (BIT20). Each coin's weight can not exceed a threshold (10% in this case), so that 50% share is occupied by 5 coins today, while the other 50% by 15 more coins, weighted according to dominance.
4) Weights proportionate to transformed capitalization (root of capitalization for CCI30). The method combines merits of the previous two, as the weights fluctuations reflect dominance fluctuations, but more information is preserved due to market not being equated to a few given coins.
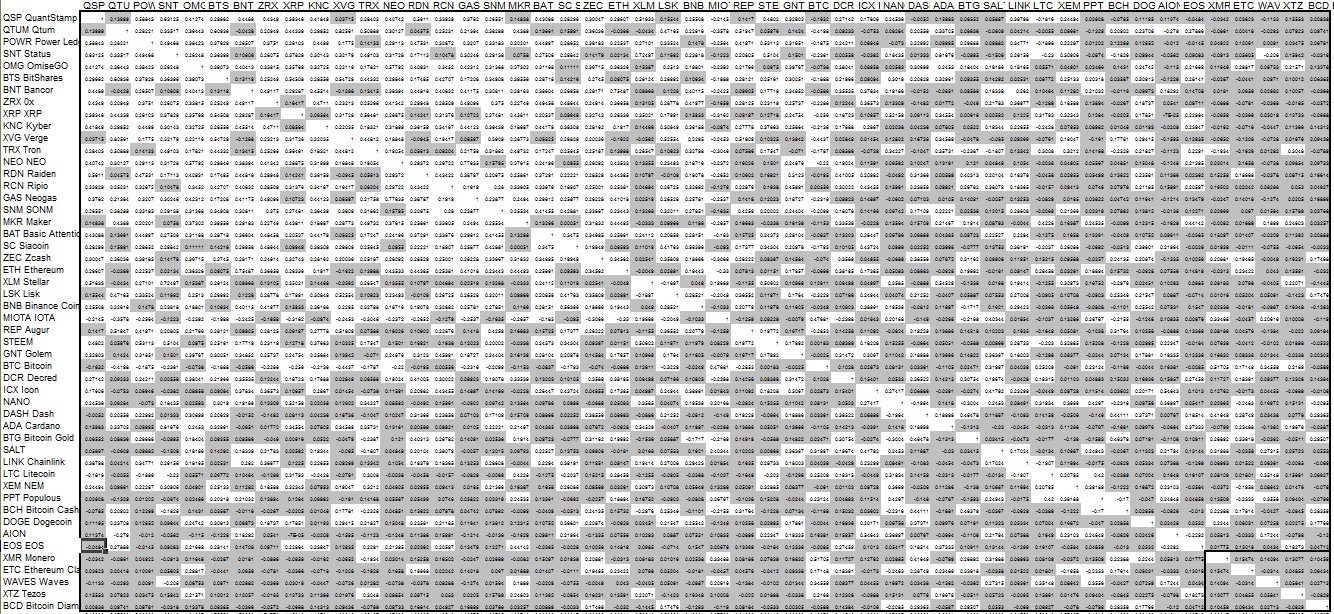
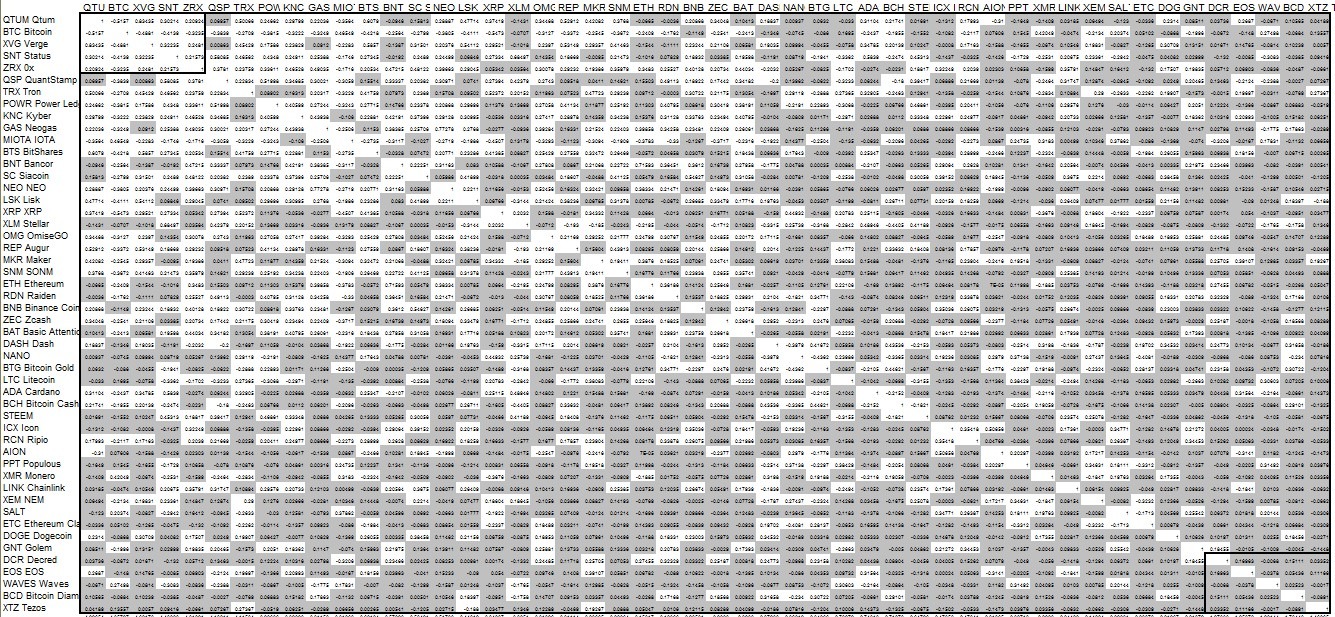
Therefore, BIT20 and CCI30 enter the final round. The linear regression residuals correlation matrices (built for the same 50-coin list, including the top-30) look very similar generally; the same coins are identified as good diversifiers - EOS, XTZ, WAVES, ETC; and so forth. Tables 1 and 2 show the correlation matrices for BIT20 and CCI30 (grey shading, as earlier, denotes correlations insignificant for a=0.01%, i.e. lower than 0.17), but there are no reasons to choose one matrix over another.
Thus in the final round we assess stability of regression coefficients - precisely, beta, - for a few coins. Stability means that with addition of new observations the coefficient values do not change. To make life easier, we only consider values of beta without its standard deviation which has to diminish. We take four coins: BTC; Status Network SNT, which shows strong residual correlation with other coins for both indices; EOS and Tezos, which look "good diversifiers" for both indices. For each coin, we regress its weekly yield on the index weekly yield, for the period starting from the first CMC listing day, then we add one more day to the observation period and re-estimate the regression. Graphs 3 and 4 show the beta values estimated for each of the successive regression on BIT20 and CCI30 respectively; the values are obviously unstable for short periods, for longer ones the addition of new observations effectively does not impact beta. This means that for periods long enough we may consider beta values stable even if they are estimated a few months ago.

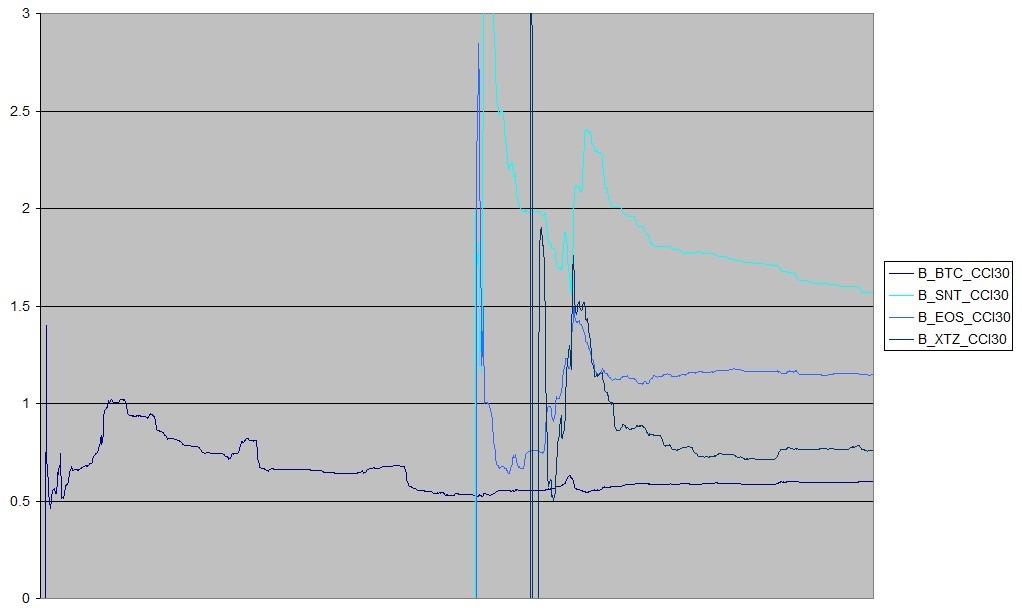
The indices differ much by coefficients stability. For BIT20, BTC and SNT betas still have not stabilized (the BTC beta grows gradually with new data, while SNT falls). The Tezos beta have stabilized in the app. 400-day observation period; the same can be said of the EOS beta. For CCI30, the bitcoin beta has not changed over almost two years; the 2017-18 surge and crisis has not influenced it. Other betas behave almost the same as for BIT20 (SNT beta is not stable either), but Tezos and EOS are stabilized faster, in the app. 300-day period). Therefore, CCI30 produces more stable coefficients evidently, and so preserves more systematic risk information.
Another stability test consisted of several additional coin-on-index yield regression series starting from the later dates. If the stabilized beta values in the series are close to a "true" time-invariant value, they should coincide (so we take bitcoin only to get a number of 400-day observation periods). Graphs 5 and 6 show the results of this test for BIT20 and CCI30. It is seen that while deviations in estimated beta values are in place, they are much lower for CCI30.

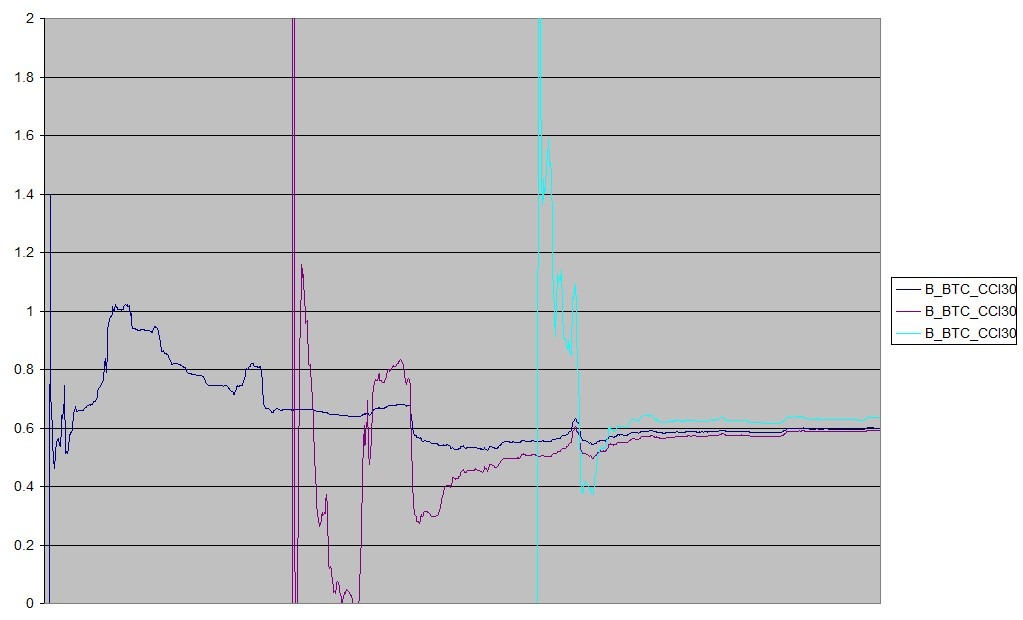
Based on all of this, I still argue that CCI30 index fits to portfolio optimization applications better than anything else I know of. Admittedly, structural changes in the industry, slumps and short spikes of beta are seen on the BTC graph (after the 300-day or 400-day stabilization period); they would be interesting to trace in the history of the market (as well as of bitcoin itself, and then of other coins), but two main conclusions are to be made. First, each coin is indeed described by its own sensitivity to market trends (i.e. systematic risk metric), barely changing over time, that can be assessed as the coefficient of coin yield regression on CCI30 index yield (as the only option so far). Second, historical data period for the assessment has to span over at least 300 days (roughly speaking, over a year), estimations over a shorter period definitely make no sense.
This analysis would be impossible without help from @kidsarentalrightbleat with data acquisition. Thanks to @van_chun for information on indices.