## Why Website Performance Debugging Has Become a Core IT Discipline
When a customer abandons a checkout page after waiting three seconds, the problem is no longer just “slow loading.” It is a revenue issue, a search ranking issue, and often a systems issue that spans DNS, CDN routing, JavaScript execution, and backend latency. That is why modern **Website Analysis** is no longer a marketing-only activity. In practice, it overlaps with **Network Diagnostics**, observability, and application performance engineering.
The shift accelerated as expectations tightened. Google’s Core Web Vitals initiative, introduced in 2020, made performance metrics visible to product teams outside engineering. Around the same time, large-scale studies kept showing how sensitive users are to delay: even a 100-millisecond pause can affect perceived responsiveness, while longer waits sharply increase bounce rates. Amazon has long been associated with the business impact of speed, and its engineering culture helped popularize the idea that milliseconds matter at internet scale.
## What Website Analysis Actually Measures
Good **Website Analysis** starts with separating symptoms from causes. A page may “feel slow,” but the bottleneck can sit in different layers:
### 1. Front-end rendering
Heavy JavaScript bundles, render-blocking CSS, large images, and third-party tags can delay first paint and interactivity. A page may download quickly yet remain unusable because the browser is busy parsing scripts.
### 2. Backend service latency
APIs, databases, authentication services, and payment gateways all affect how fast content becomes available. A checkout page that waits on five downstream calls is far more fragile than one that caches static data.
### 3. Delivery infrastructure
CDNs, TLS negotiation, DNS resolution, and geographic routing can change the actual experience from one region to another. A site that performs well in New York may be noticeably slower in Singapore if edge caching is weak.
### 4. Network conditions
Packet loss, jitter, DNS failures, and ISP routing issues can create intermittent problems that basic uptime checks miss. This is where **Network Diagnostics** becomes essential.
## Why Network Diagnostics Matters More Than Ever
A page load is rarely a single request. By the time a browser renders a modern site, it may have resolved multiple domains, negotiated HTTPS, pulled assets from a CDN, and called third-party APIs. If one hop is unstable, the whole experience degrades.
**Network Diagnostics** helps teams identify whether slowdowns come from the client side, the last-mile connection, the public internet, or internal infrastructure. Network Monitoring Traceroute, packet capture, DNS lookup timing, and synthetic monitoring are still useful, but they are far more valuable when paired with real-user measurements.
Domain Status A practical example: a media company may see a sharp drop in **Website Response Time** only for users in South America. Synthetic tests from a single datacenter might miss the issue, but distributed probes can reveal that a CDN edge node is healthy while upstream peering to one ISP is congested. In that case, the fix may involve rerouting, adjusting cache policies, or moving critical assets closer to the affected region.
## Website Response Time as a Business Metric
**Website Response Time** is often discussed as a technical measure, but it is better treated as a business metric with technical roots. The difference between 200 ms and 1 second can decide whether users proceed, especially in ecommerce, banking, and SaaS onboarding.
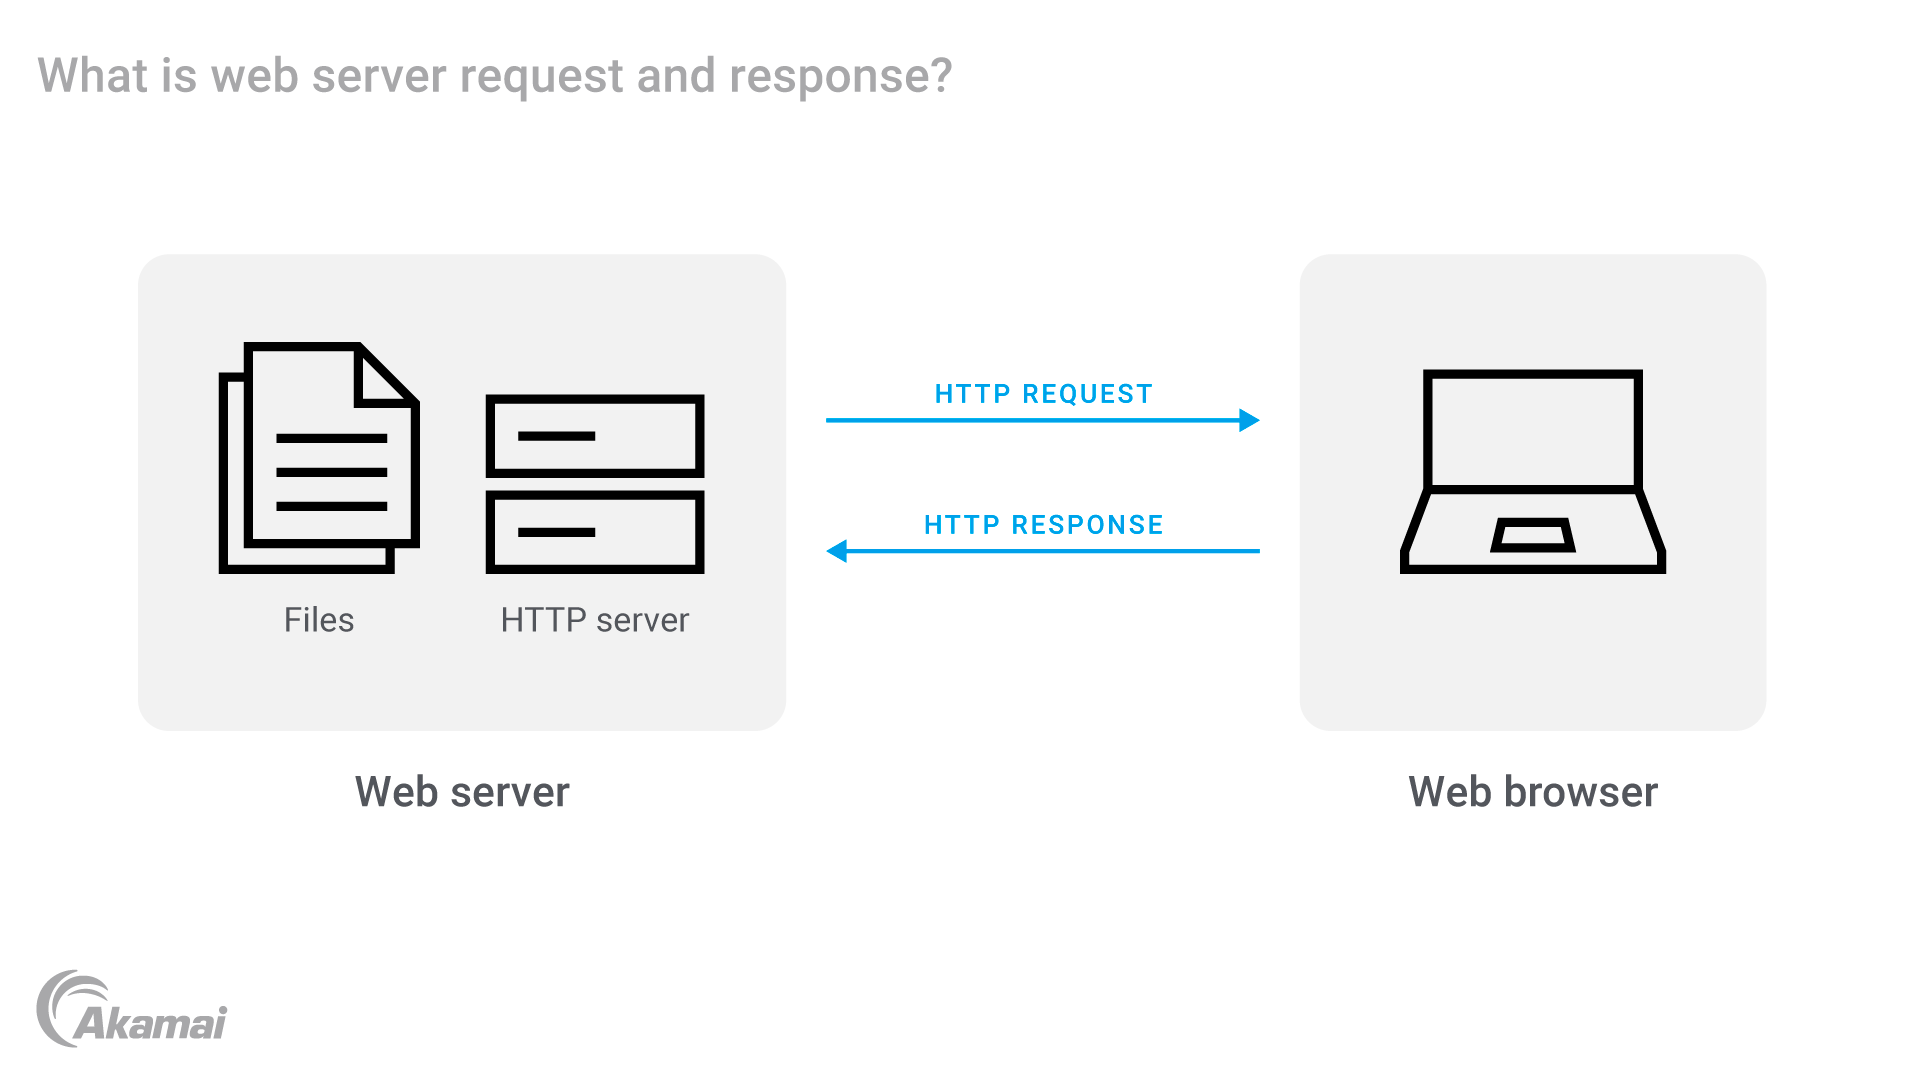
Research from Google’s own performance work has repeatedly shown that users perceive waits above a few hundred milliseconds. Public case studies from major retailers and travel platforms have also shown that faster response correlates with higher conversion and lower abandonment. Even if exact gains vary by product, the direction is consistent: lower latency usually improves engagement.
This is why engineering teams increasingly set Service Level Objectives around:
- p75 and p95 latency, not just averages
- time to first byte
- first contentful paint
- interaction readiness
- API round-trip times
Averages can hide pain. A site with a 300 ms average **Website Response Time** may still be frustrating if the p95 jumps to 1.8 seconds during peak traffic.
## A Real-World Troubleshooting Workflow
Teams that solve performance problems efficiently usually follow a layered approach:
1. Start with user-reported geography and device type.
2. Compare synthetic monitoring against real-user monitoring.
3. Break down request timing into DNS, connect, TLS, server, and rendering phases.
4. Inspect third-party scripts and API dependencies.
5. Correlate latency spikes with deploys, traffic surges, or ISP incidents.
6. Validate fixes with before-and-after measurements across regions.
This workflow prevents the common mistake of optimizing the wrong layer. For example, compressing images will not help if the real issue is a 700-millisecond authentication API call. Likewise, upgrading a database will not solve a browser main-thread blockage caused by a tag manager.
## Where the Industry Is Heading
The next stage of performance engineering is more automated and more distributed. AI-assisted anomaly detection is already being built into observability platforms, and edge computing is reducing distance to users. HTTP/3, based on QUIC, is also reshaping how connection setup and packet loss affect page delivery. As adoption grows, **Network Diagnostics** will need to account for newer transport behavior instead of relying only on older TCP assumptions.
There is also a stronger push toward cost-aware optimization. Cloud teams are discovering that better **Website Analysis** can reduce infrastructure spend, not just improve user satisfaction. Fewer retries, smaller payloads, and smarter caching lower bandwidth usage and origin load. In high-traffic systems, those savings can be substantial over a year.
The practical opportunity for engineering teams is clear: treat **Website Response Time** as a product feature, not a vanity metric; make **Network Diagnostics** part of incident response; and use **Website Analysis** to connect technical traces to customer behavior. Teams that do this well tend to ship faster, debug faster, and lose fewer users to invisible delays.