What side you choose?
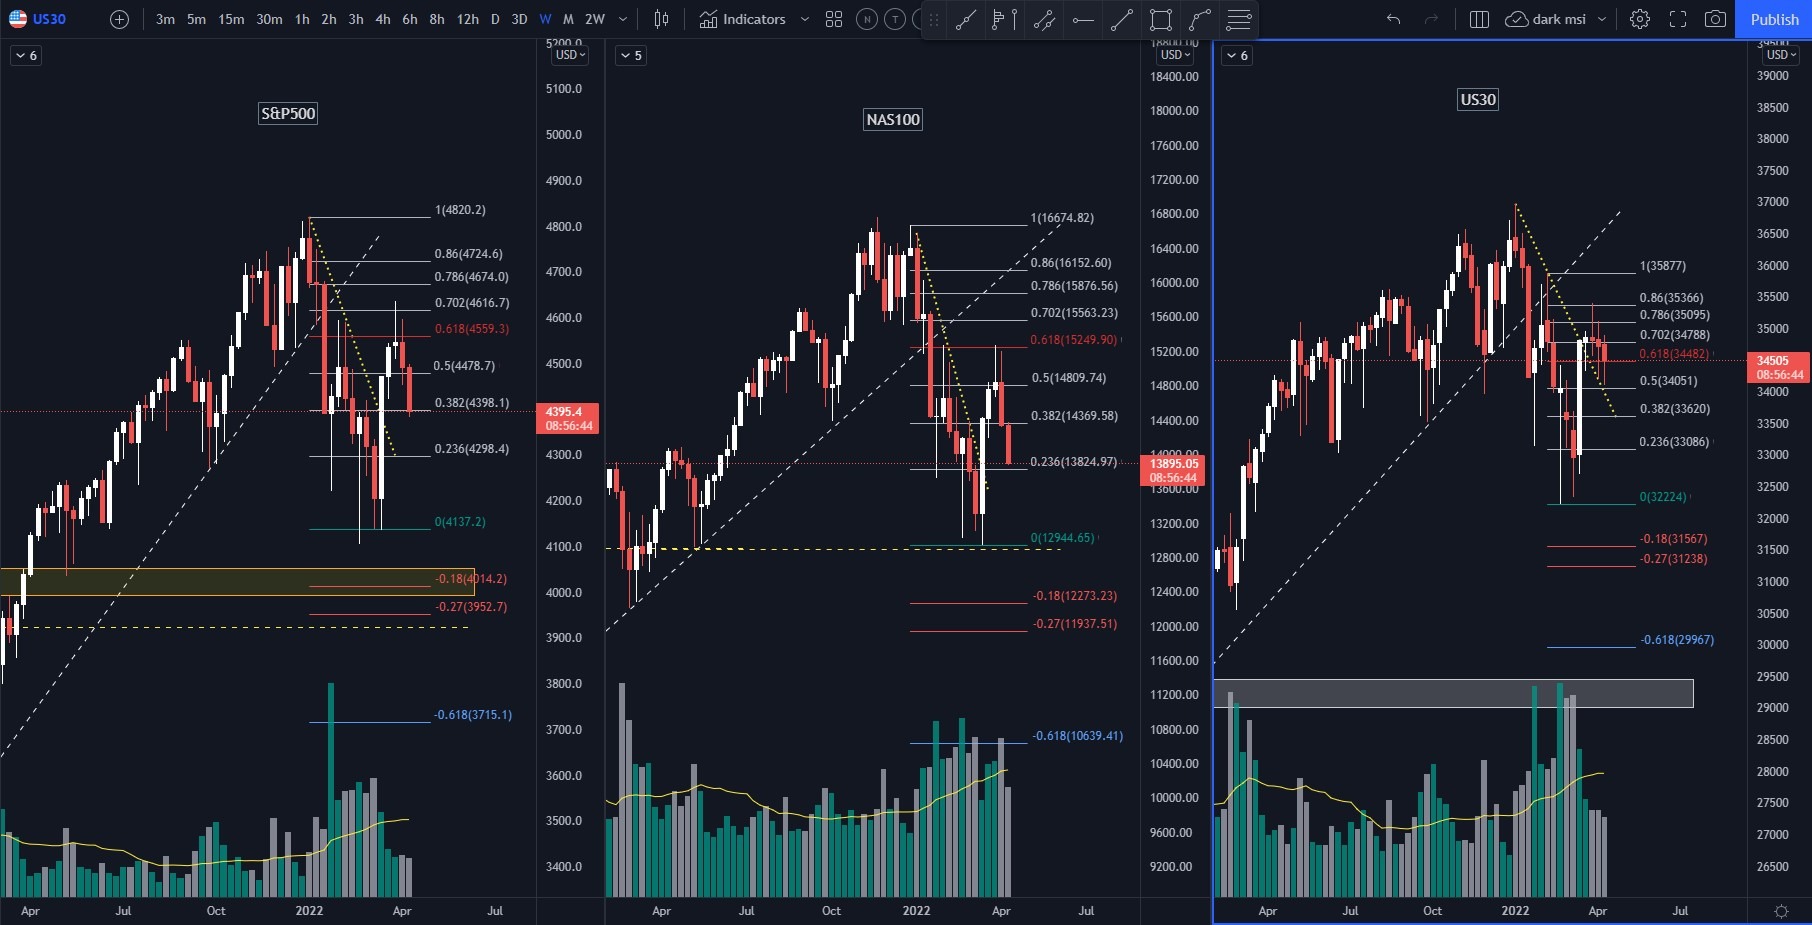
them8S&P500, NAS100 and US30 are showing weakness on weekly charts, they bounced down from 0.618-0.86 fibo levels and today weekly candles gonna be closed. it might cause continuation of descending trend next week.
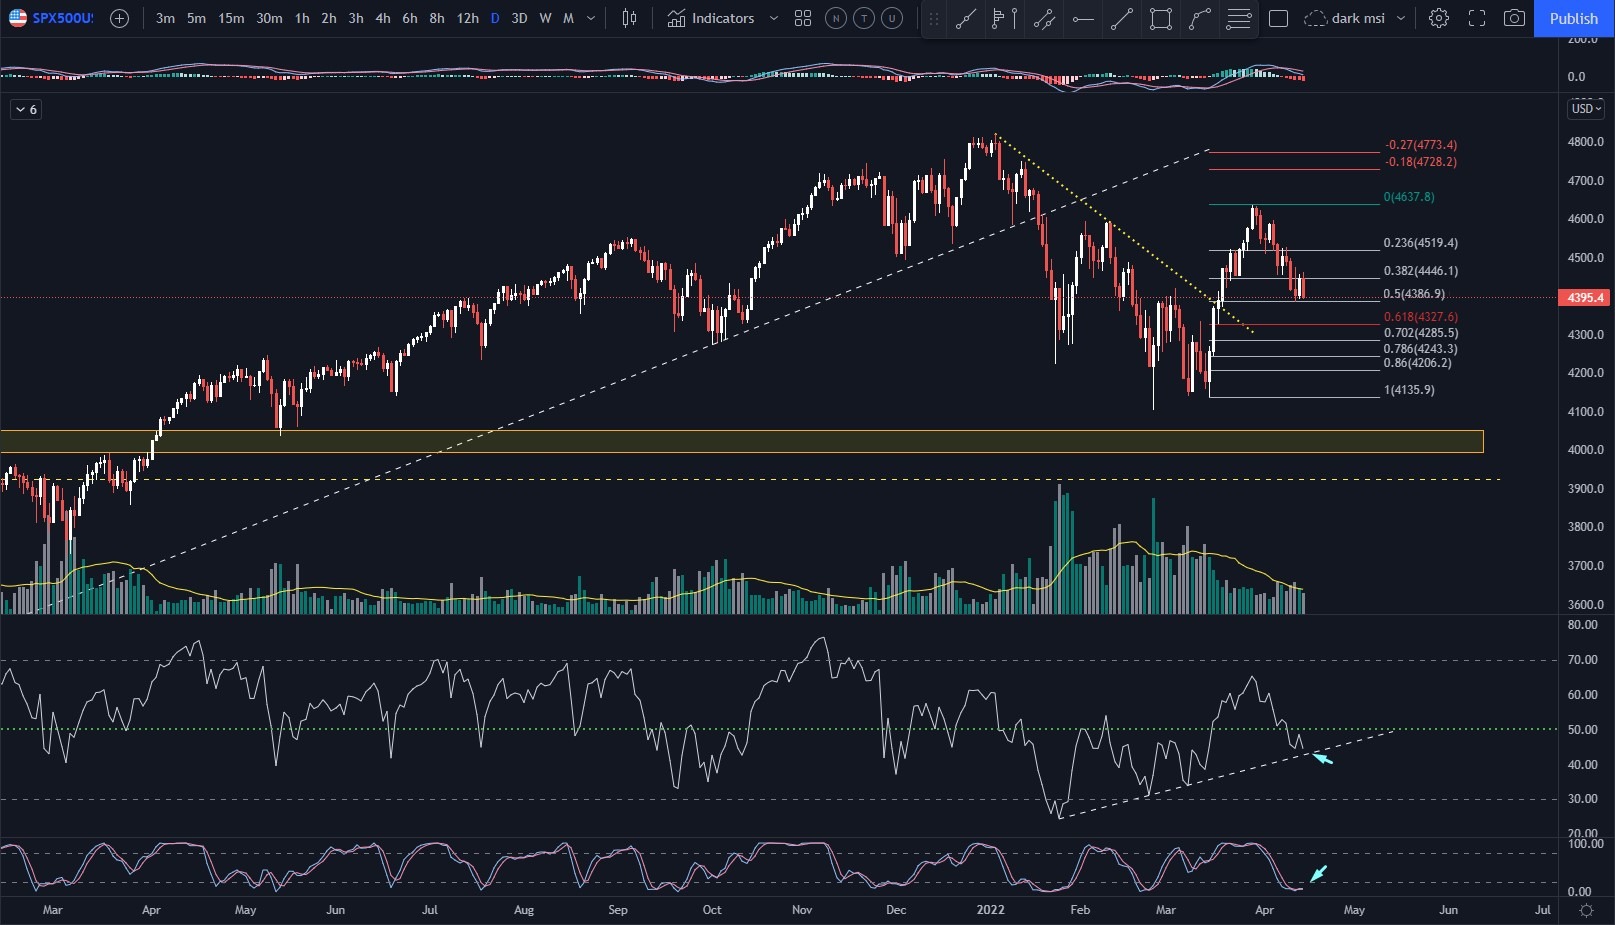
on a daily chart of S&P500 there is still come possibility to bounce up. The major condition - RSI should stay above the trend line. It might happen as Stoch is oversold now.
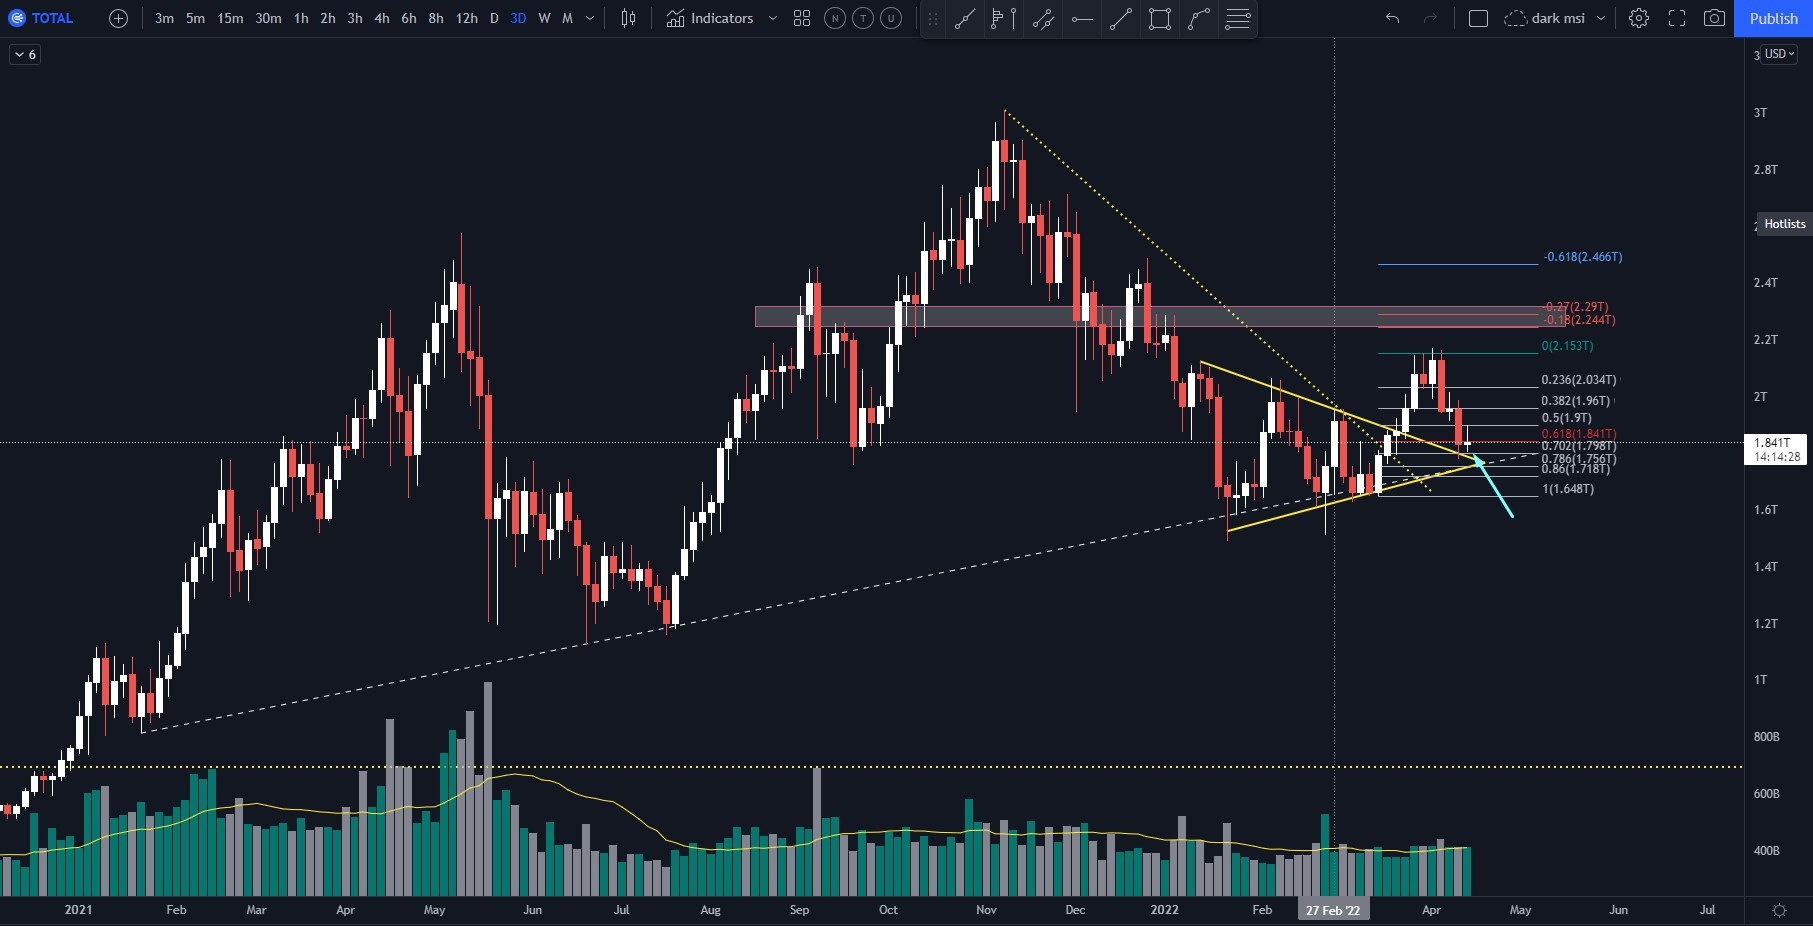
Total Market cup is still looking Bullish, as its above major trendline from Jan 2021 and above upper line of triangle(yellow lines) and also at 0.618 fibo level.
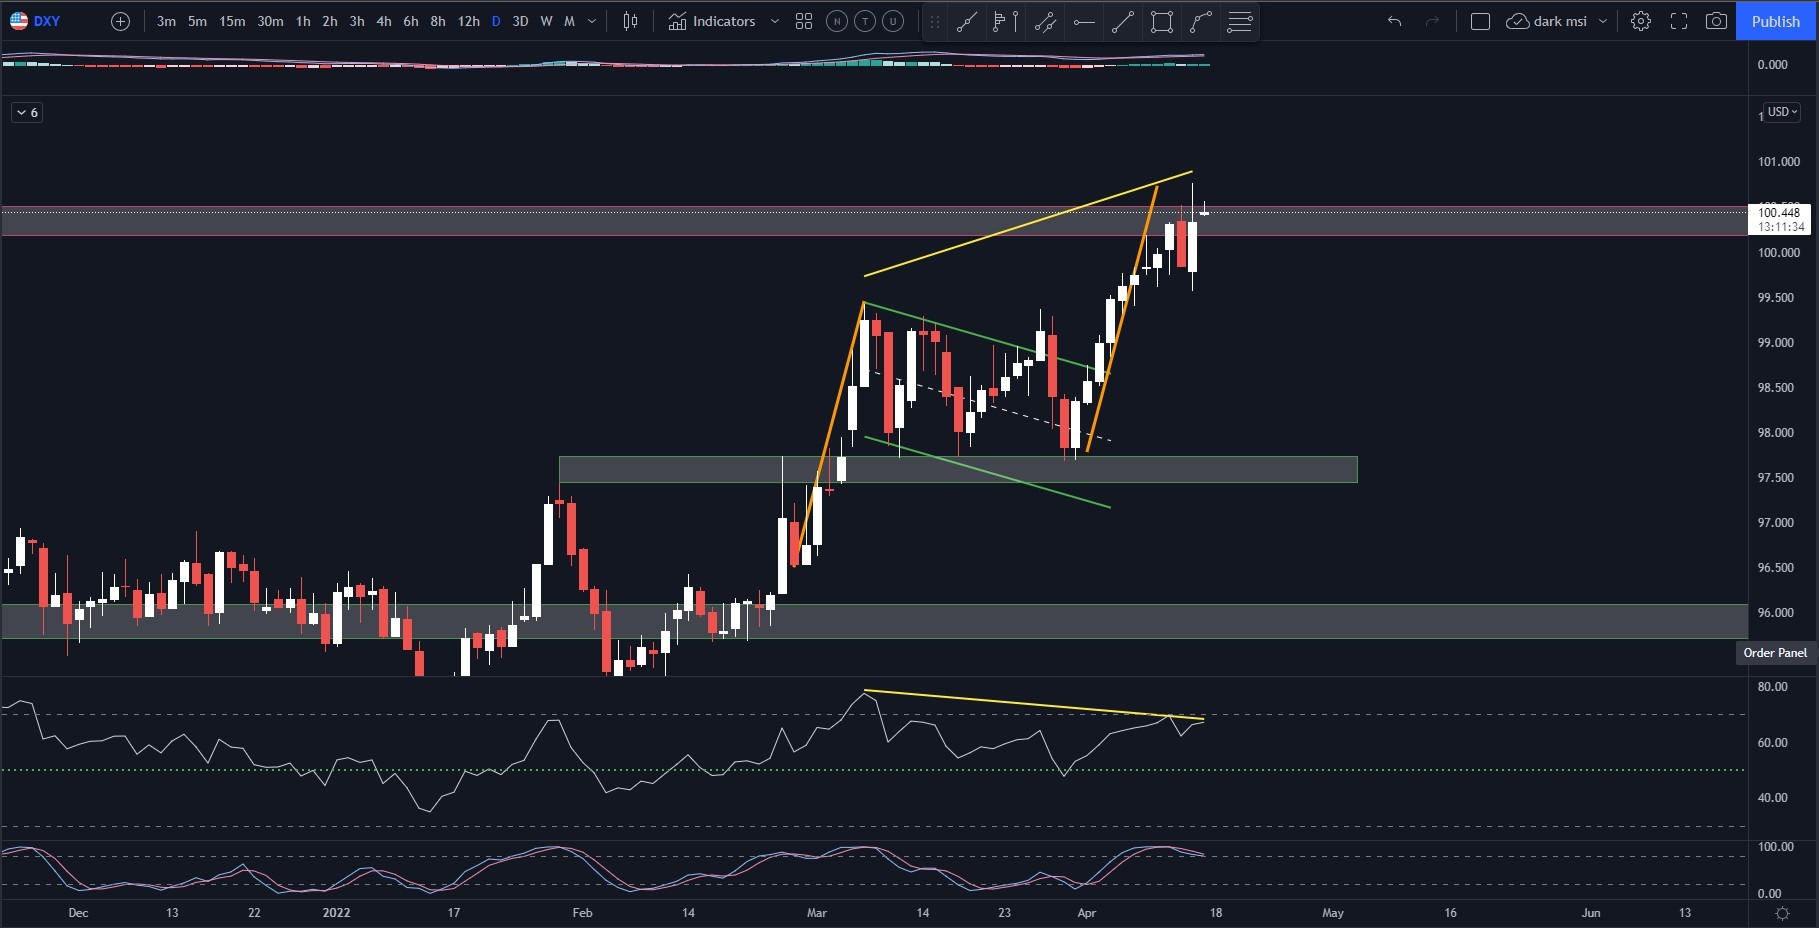
The movement up will be possible if DXY (US dollar currency index) will go down. On a weekly chart can see that its at resistance area now and 2% lower than max by trend line.
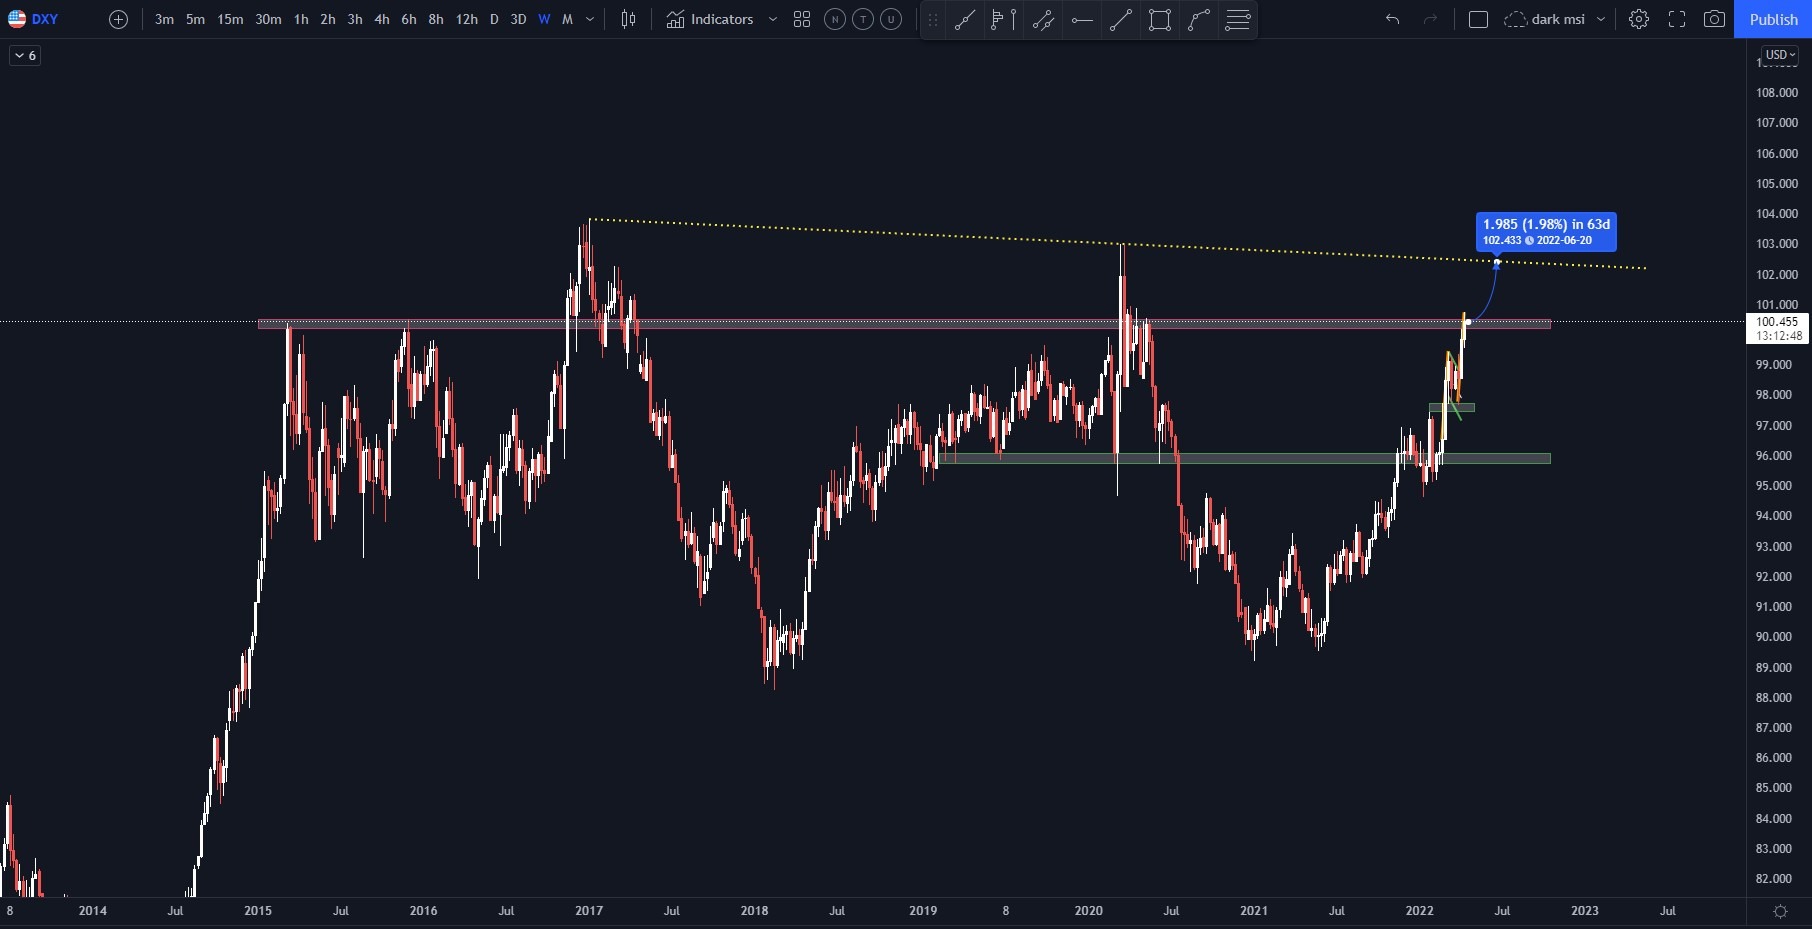
Daily chart of DXY is at resistance area now and shows divergence, also last movement up completed pattern flag.
With all written above BTCUSDT weekly chart still got a chance to bounce up. RSI is above trendline and Stoch is overbought(on a history we see that it can stay there few months)
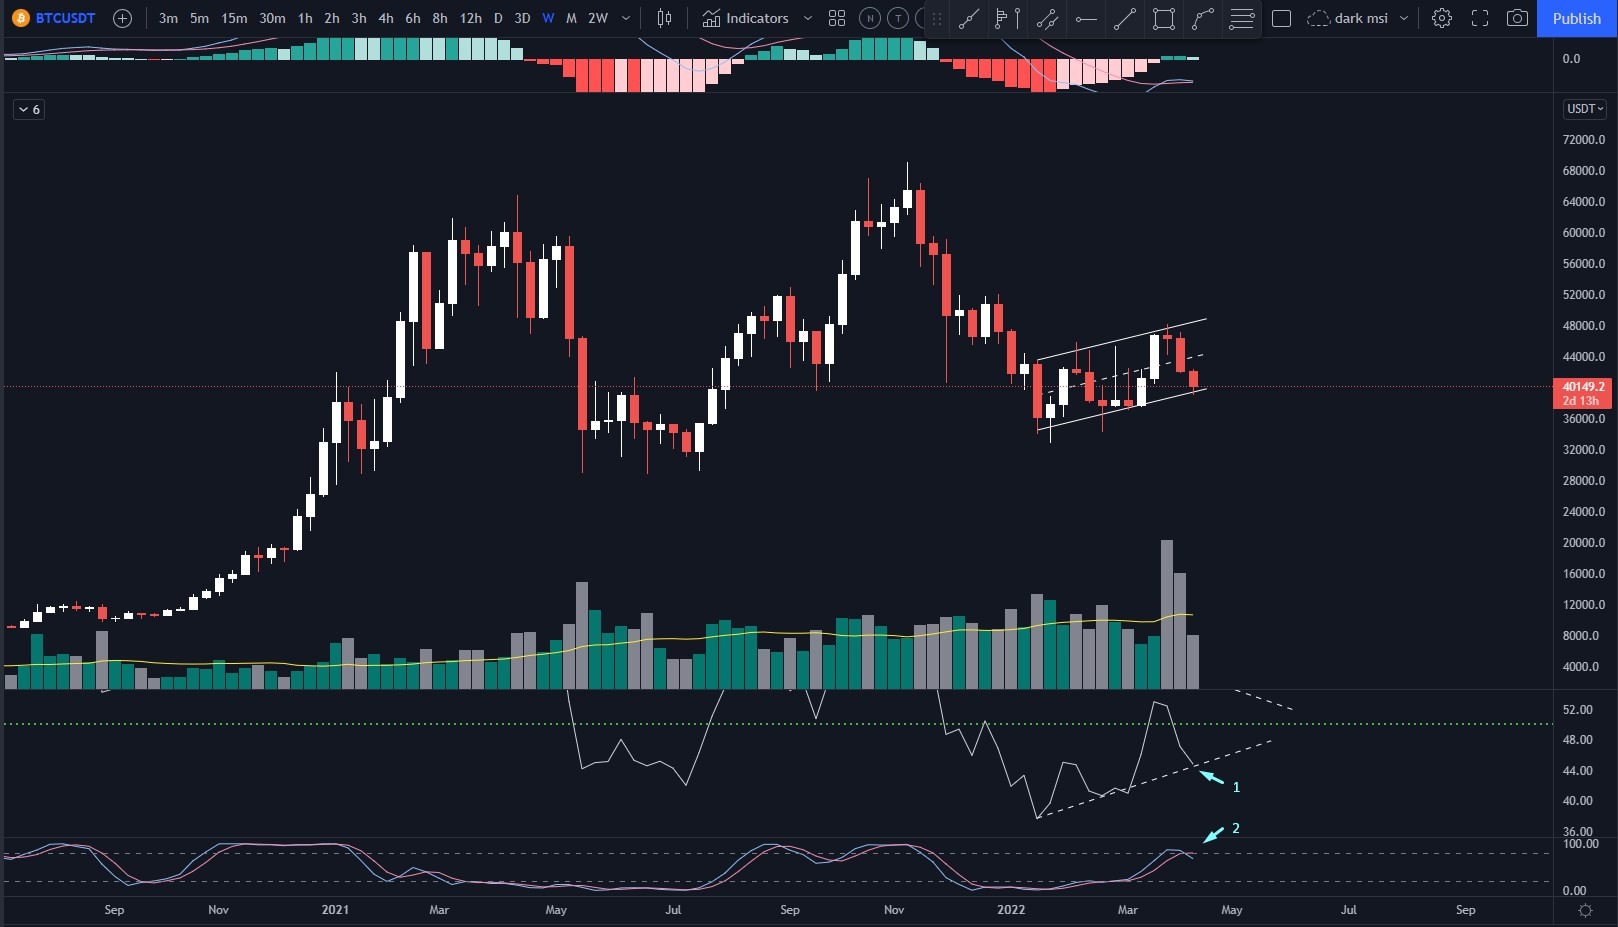
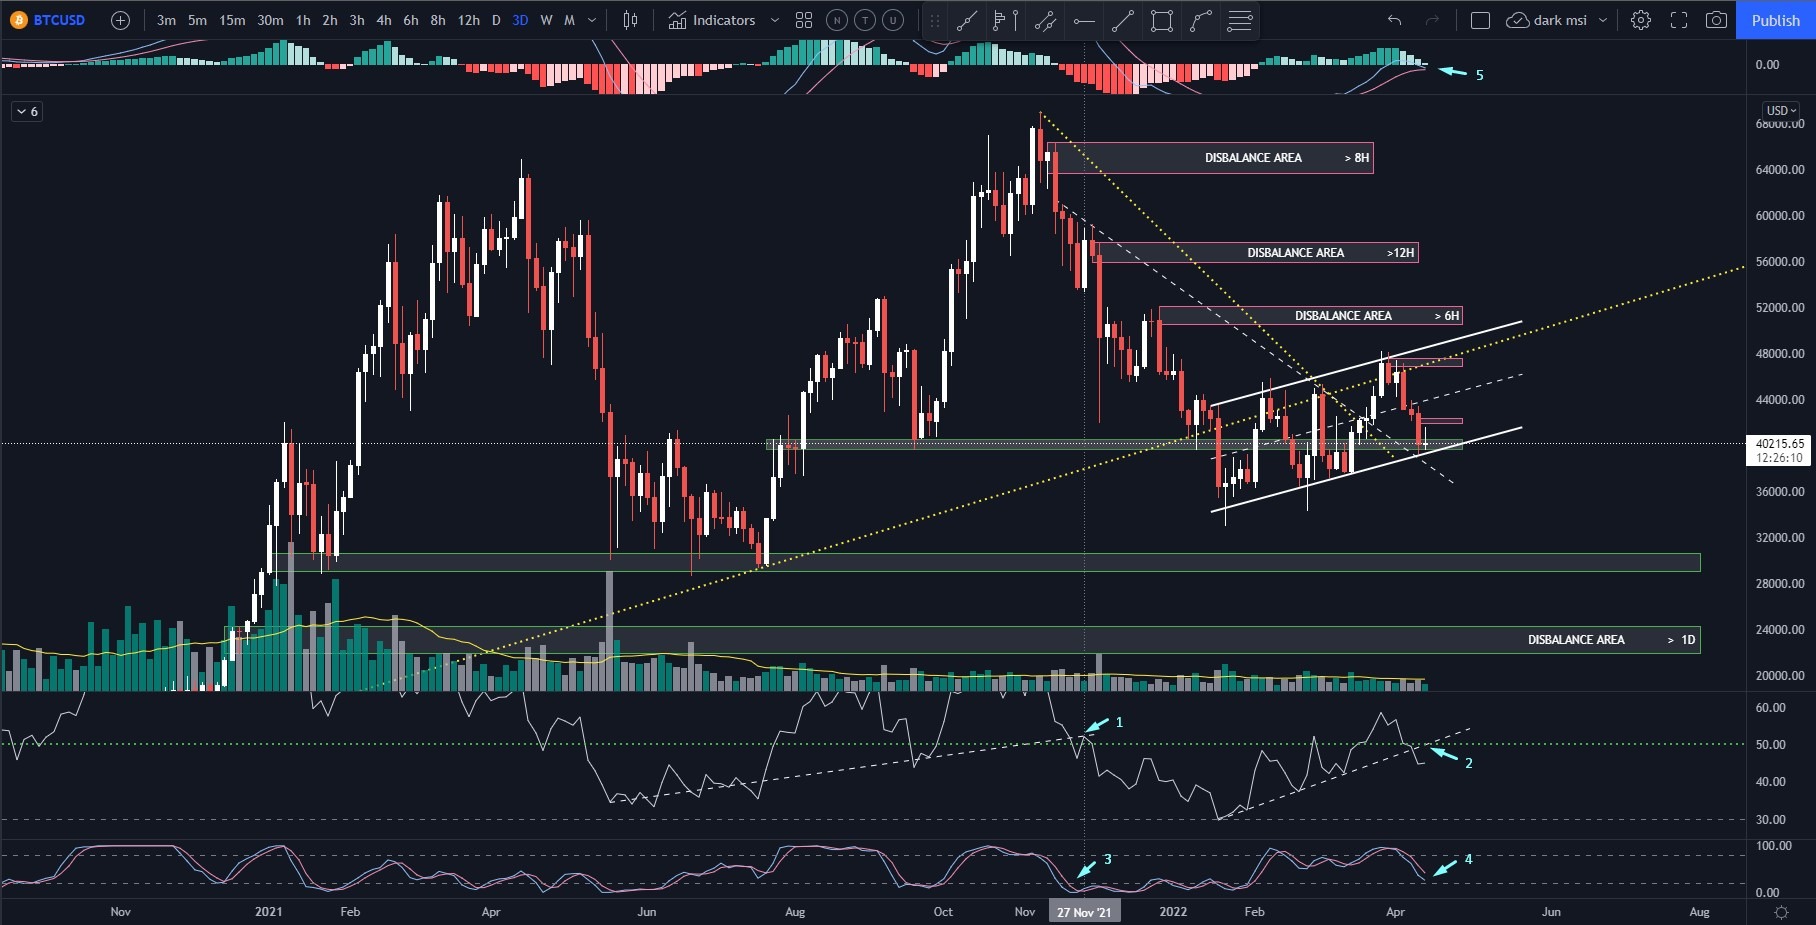
Daily chart doesn't look that optimistic. on a 3 days chart the price is in ascending parallel channel, which can be the part of Bearish pattern flag. Also is we check on a history, when previously RSI bumped from a trend line(1) and Stoch(3) was in oversold area, there was ~40% movement down.
Pretty similar situation is about to happen now. RSI is below trend line(2) andStoch is in oversold area already(4). It's just didn't bounce down yet.
That was a close look at current market situation.
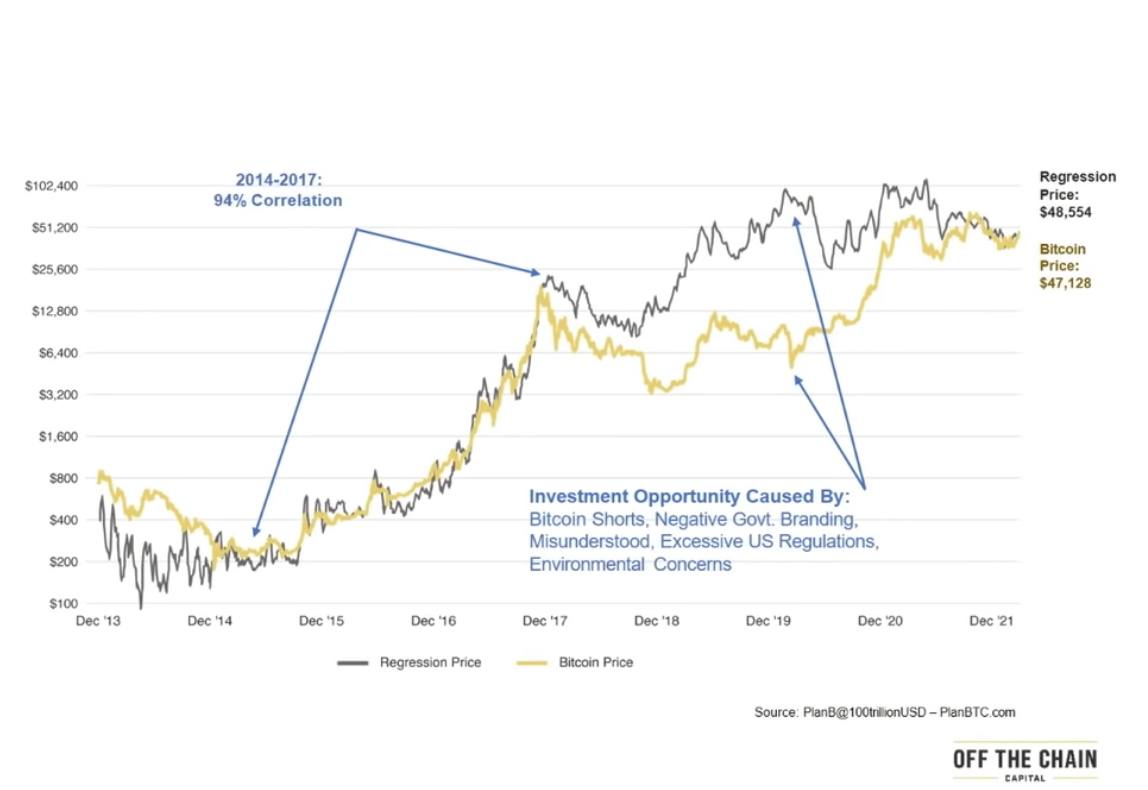
Also some charts are showing that BTC now near it's fair price area.
Also 2 different points of view.
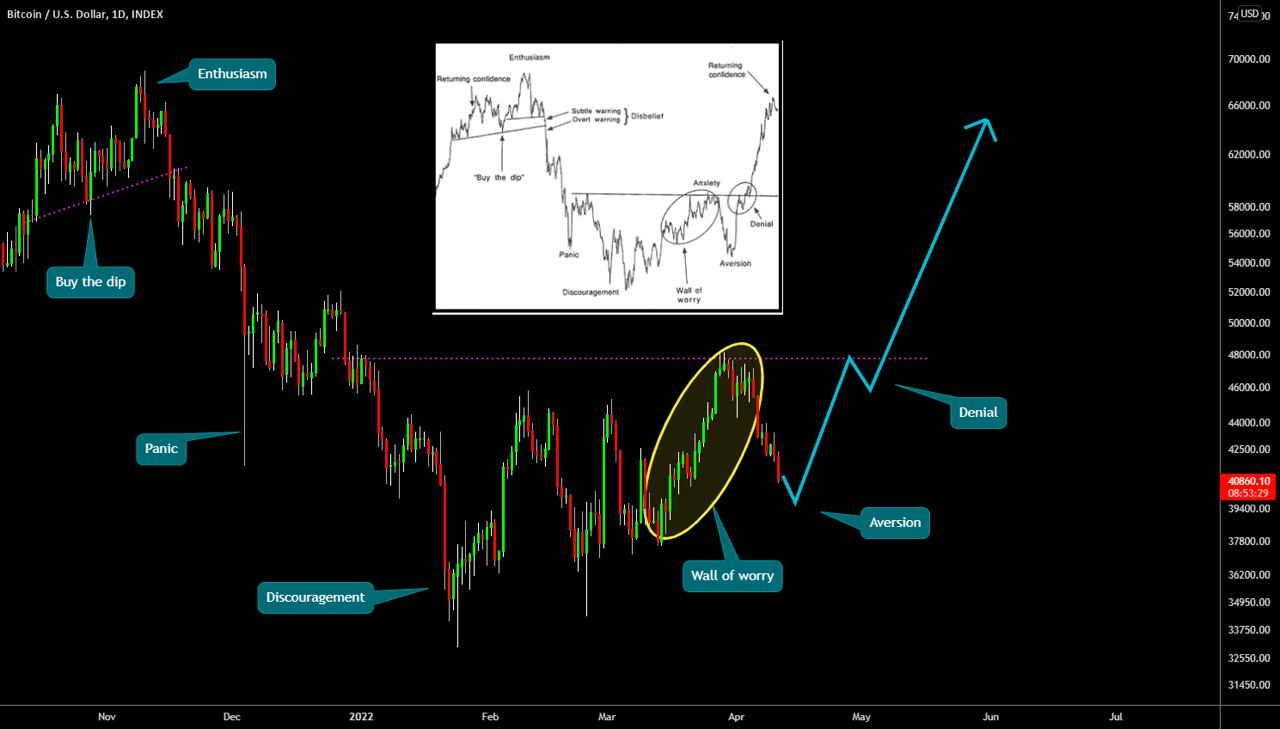
First one is based on classical sentiment cycle model by analyst Justin Mamis.
According to this model, we are approaching the end of the Aversion wave (disgust, dislike) and after the current slight correction, we can expect the continuation of the upward cycle.
According to this BTC fractal, we can still go down to the $37-40k zone, and then start an upward movement.
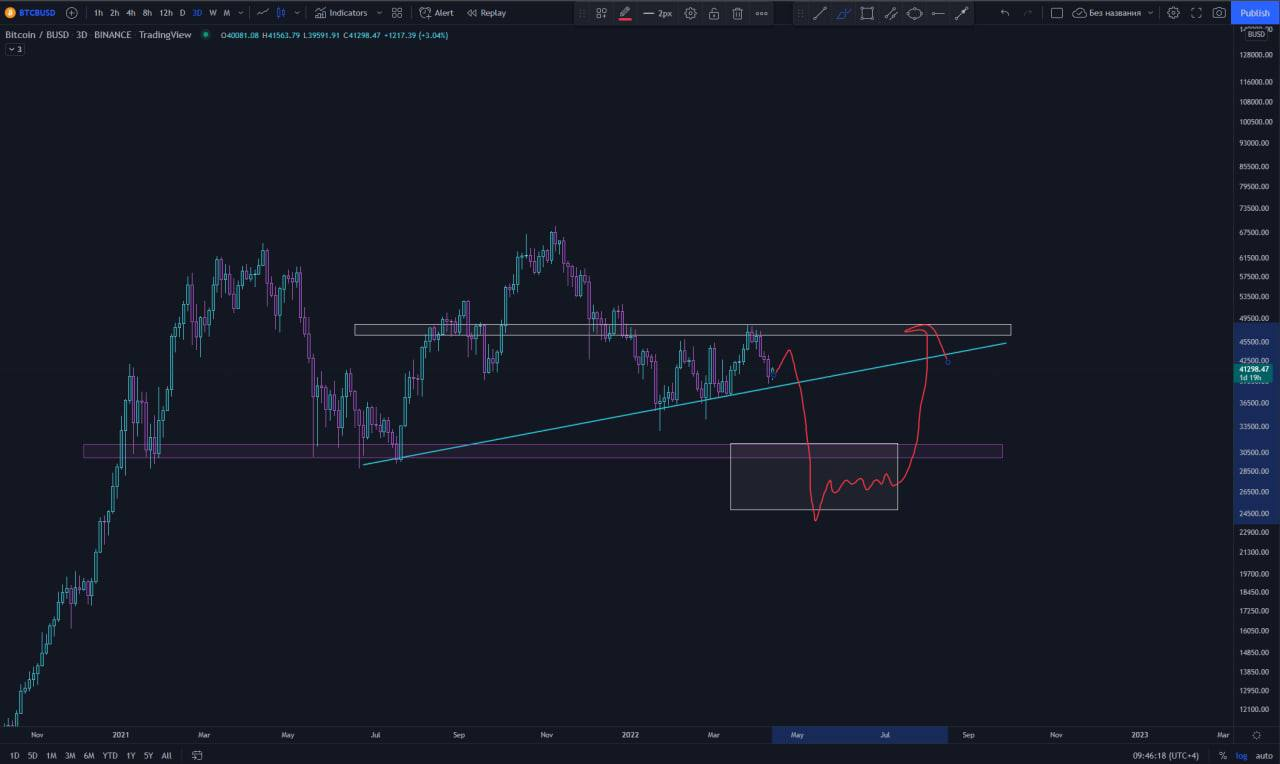
Second one is based on takin liquidity first before the upward movement. There in a grey rectangle a lot of SL and Liquidations of Buyers.
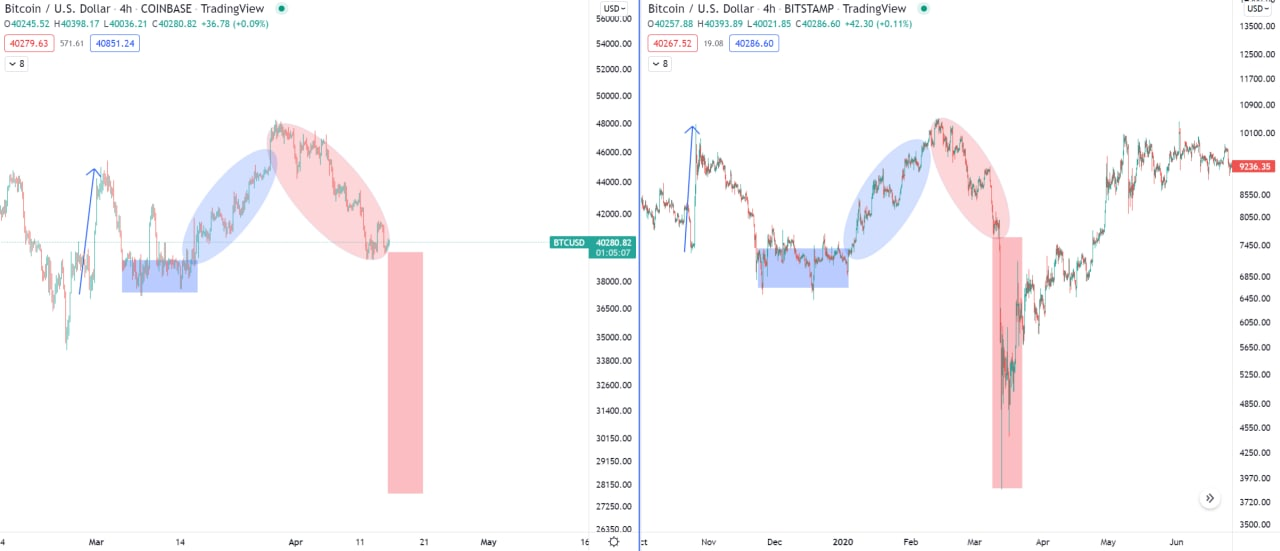
Same movement to the area ~28k usd can happen as a fractal of previous movement from Spring 2020.
The only question is what side Institutional investors took, COT report will be tomorrow.