What is landing date for TSLA rocket
TS Forecasts. Sergey IvanovTSLA stocks price is rapidly growing for the last few days. I have two questions to solve by this article: how far is price going to and is this growth normal (expected and projected by data history) or abnormal (unexpected).
First of all, let's have a look at daily chart:
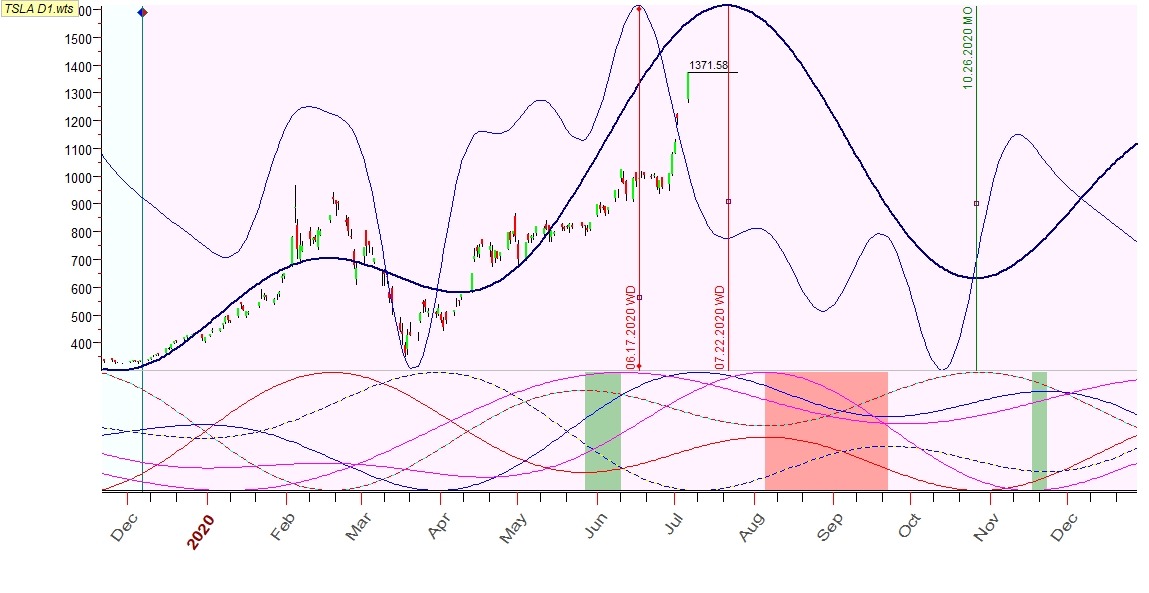
Here we can see Q-Spectrum projection line calculated with index Volatility and annual curve. Also, it is obvious that there is divergence from a middle of June between these two lines . Indeed, prior this happens my Q-Sp projection went in line with seasonal curve in terms of key turning points:

So, we've come to the first question answer: TSLA growth is going to be accomplished by the 22nd of July as is shown at the first chart. How it was obtained? I didn't change Q-Sp index, but just cycles.

As you can see to adjust projection line to current growth it has to be calculated on cycles with longer periods. So, the second question arises: do these long-run periods cycles come from data history must be accounted further or we may cutback setup to previous settings? The answer is provided by Chaos Theory module. You may get aware of how it works in TS manuals, but here all we need to see is V Stat parameter high (373 days) for segment where red line are located above grey Null line (approx from 40 to 420 days).
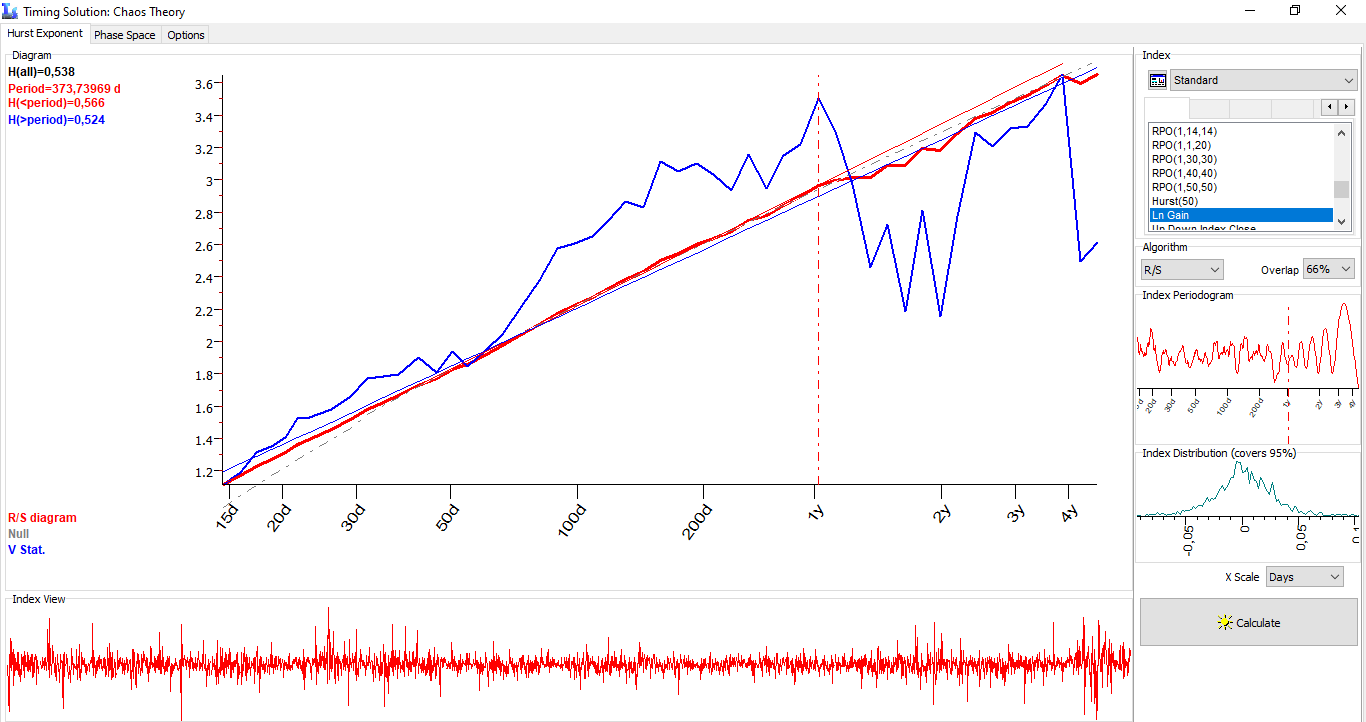
Practically, this means that looking for Sp and Q-Sp setting we need to accept cycles less or equal to 1 year as "normal" affecting further price moves. While cycles higher than a year provide projection line for abnormal move. Thus, current growth is a part of market chaos rather than order (statistically generated by price history).
So, what is next? Next, we need to combine projection lines from both setups (based on two different types of cycles) and have a look, when they start having high similarity.

As you can see it will start from a middle of Sept 2020. Until that period we may see abnormal fluctuations, which are currently have a strong bearish turning point on 22nd of July.