Wells MACD
Theory
Hello friends, I'm Lara and today I'm going to share with you a very simple and effective trading strategy that will help you achieve success in the market. This is your guide to the world of trading!
Wells MACD is the name of the strategy we are going to look at today. Let's talk about its basic principles. It uses two indicators: Parabolic SAR and MACD.

Parabolic SAR is an indicator that helps us to identify trend reversal points. It works quite simply: when the points of the parabolic are below the price, it is a signal that the trend is likely to turn upwards.
And when the points are above the price, it indicates that the trend is likely to reverse downwards. It is important to note that Parabolic SAR displays points visually, which helps to simply determine the moment of market entry.
MACD is a powerful indicator that combines an oscillator and a trend indicator. It represents two charts: a histogram and a signal line, but for our strategy we will use only the histogram.
- The MACD histogram represents the difference between the two moving averages, the fast and slow moving averages. When the histogram is above the zero line, it indicates rising prices and when it is below it indicates falling prices.
Now let's combine these indicators to understand the conditions for entering a trade using the Wells MACD strategy
UP option buying conditions:
- When the trend changes from downtrend to uptrend and Parabolic SAR shows the first green dots (no more than 2 dots on the upside);
- MACD histogram crosses the zero line from bottom to top.

Conditions for buying a DOWN option:
- When the trend changes from upward to downward and Parabolic SAR shows the first red dots (no more than 2 dots on a dip);
- MACD histogram crosses the zero line from top to bottom.

Timeframe is also an important aspect of the strategy. We set the expiry time of the trade equal to the timeframe. I.e. if we use a 5-minute chart, then the trade should be opened with an expiry time of 5 minutes, if the timeframe is 3 minutes, then the trade is set for 3 minutes, etc.
It is important to stick to this time frame for the effectiveness of the strategy. Remember that the Wells MACD strategy provides us with signals, but effective risk management and a disciplined approach is the key to successful trading
Trade Entry Example

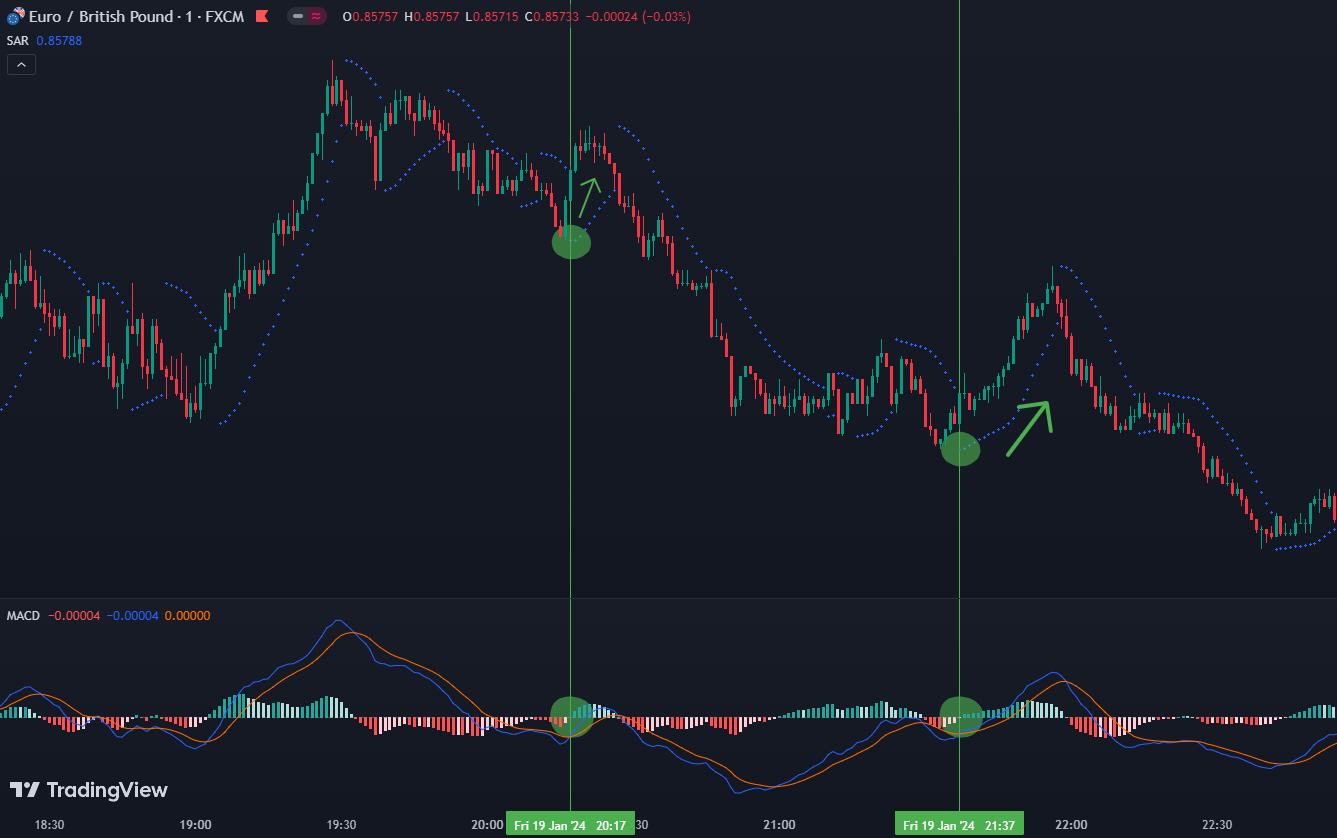
In this screenshot we can observe a ready signal to buy a binary option with a price increase condition.
1. Parabolic SAR shows the first 2 green dots;
2. MACD histogram crosses the zero line from bottom to top.
Preparing a trade begins immediately after one of the indicators has given the green light. The option is purchased immediately after receiving "confirmation" from the second indicator. If no signal from the second indicator follows soon after the initial signal, the deal is not opened.
Here we have met both conditions, so the purchase took place at Quotex broker.

And the result in 3 minutes made a profit, as the quote moved upwards.


The advantage of the "Wells MACD" strategy lies in its simplicity and accuracy of signals. The use of Parabolic SAR and MACD indicators provides the trader with reliable tools to identify market entry points. Using 5-minute options as an example, we see how quickly you can react to changes and profit from price movements.
Closure
Now that you have familiarized yourself with the "Wells MACD" strategy and mastered its key principles, we invite you to open trades for 5-10% of your deposit. A live account will give you a unique opportunity to feel all the nuances of the market that a demo account is unable to convey.
Strictly adhere to the strategy, control the risks and analyze the results. Only in practice you will be able to better understand the market dynamics and make informed trading decisions. Good luck in your trading adventures, and remember that each transaction is a step towards your financial success!