Visualizing the World’s Population by Age Group
@VisualCapitalistOfficial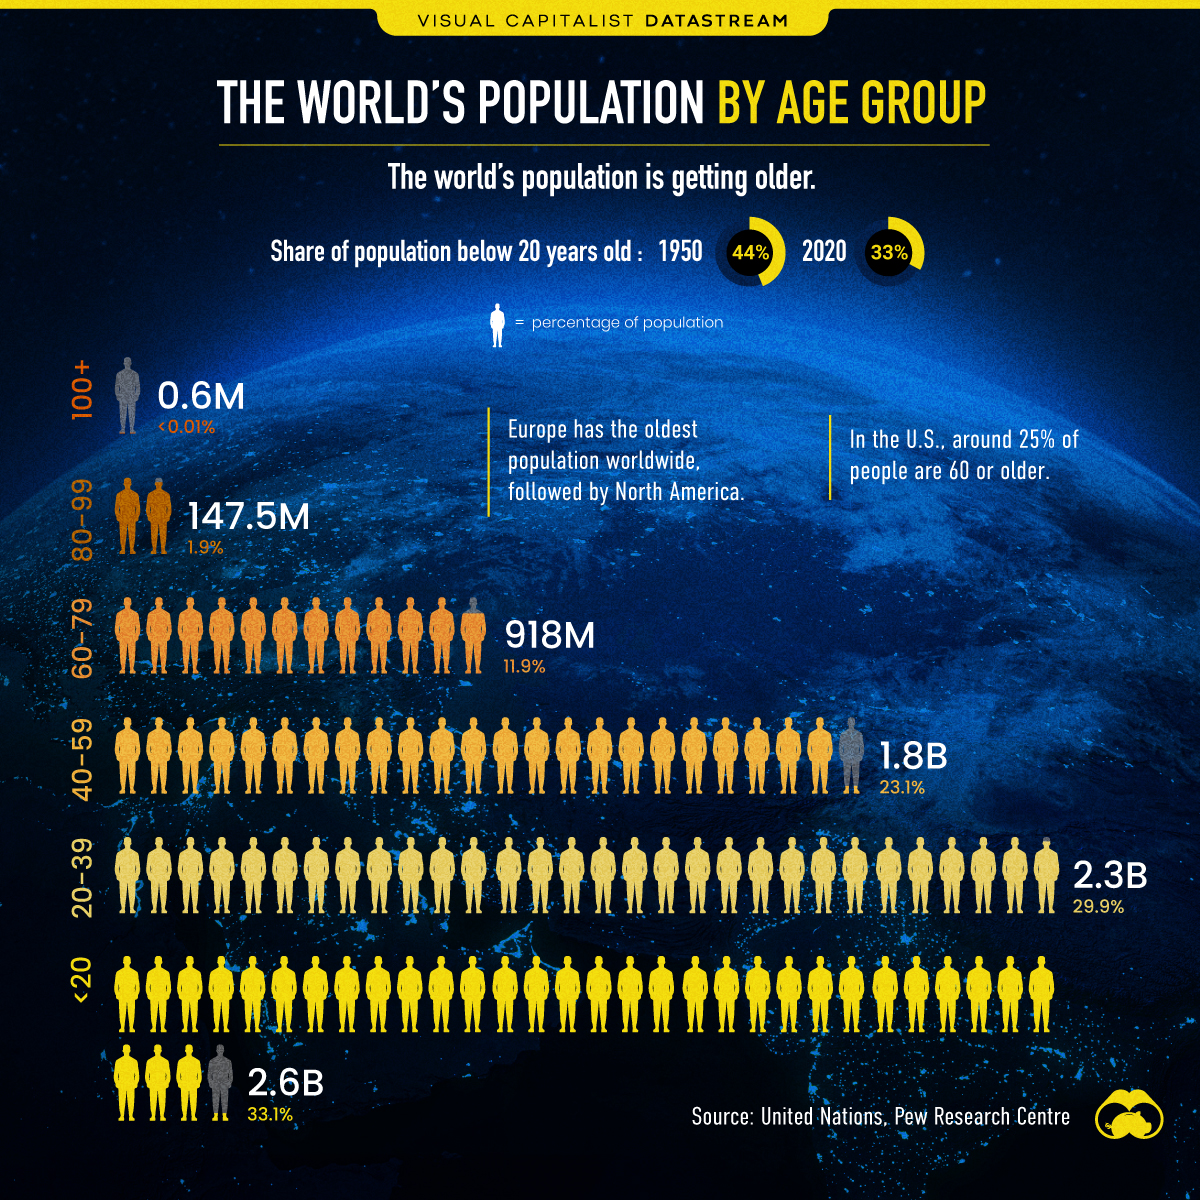
Visualizing the World’s Population, By Age Group
An aging population can have far-reaching consequences on a country’s economy.
With this in mind, today’s graphic looks at the age composition of the global population in 2020, based on the latest figures from the United Nations.
The Global Age Composition
Our global population is getting older, largely because of increasing life expectancies and declining birth rates.
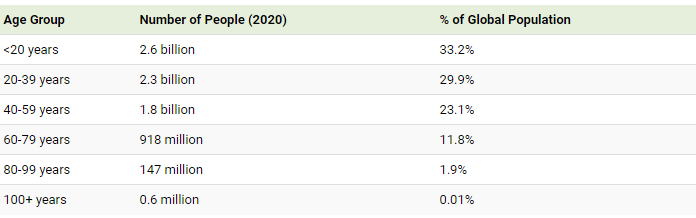
In 2020, more than 147 million people around the world were between the ages of 80-99, accounting for 1.9% of the global population.
While that percentage may seem small, that particular demographic accounted for merely 0.05% of the population in 1950, meaning our world has a notably higher percentage of older people than it did 70 years ago.
Why is this significant? An aging population typically means a declining workforce and an increase of people looking to cash in their pensions. This can put pressure on the working class if taxes are raised.
Of course, an aging population can have positive impacts on society as well. For instance, elderly citizens tend to volunteer more than other age groups. And research has shown that older communities have lower crime rates. By 2050, the crime rate in Australia expected to drop by 16% as the country’s population gets older.
To mitigate some of the risks associated with a rapidly aging population, certain countries are working towards more sustainable pension systems, to support aging citizens while taking the stress off the working population.