Visualize Streamr streams on Grafana
Sergej MüllerA step-by-step guide shows you how to use the Streamr data source plugin in Grafana to visualize streams in real time and bring them to life.
Installation & Settings
- Log in to your Grafana (Cloud) Account
- Install the Streamr data source plugin
- In Grafana switch to Configuration, Data Sources
- Click Add data source, select Streamr as source for incoming data
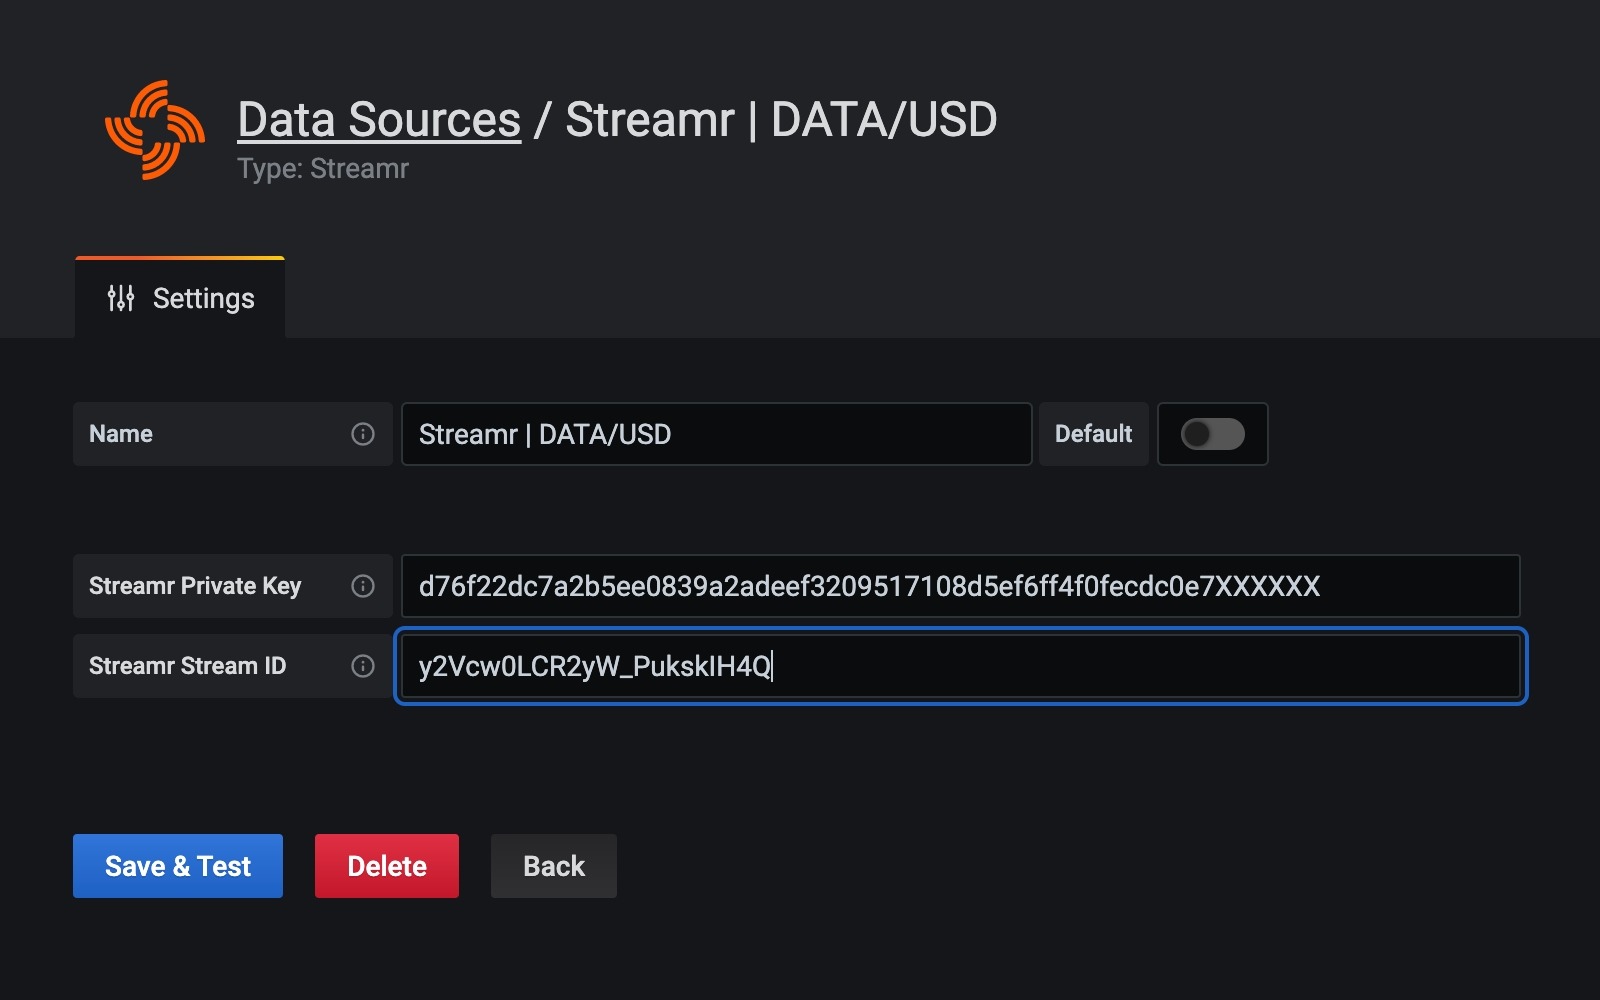
- Edit the Data Source's Name, enter your Private Key and the Streamr ID
- Save (under the hood the plugin will verify the entered data)
Usage
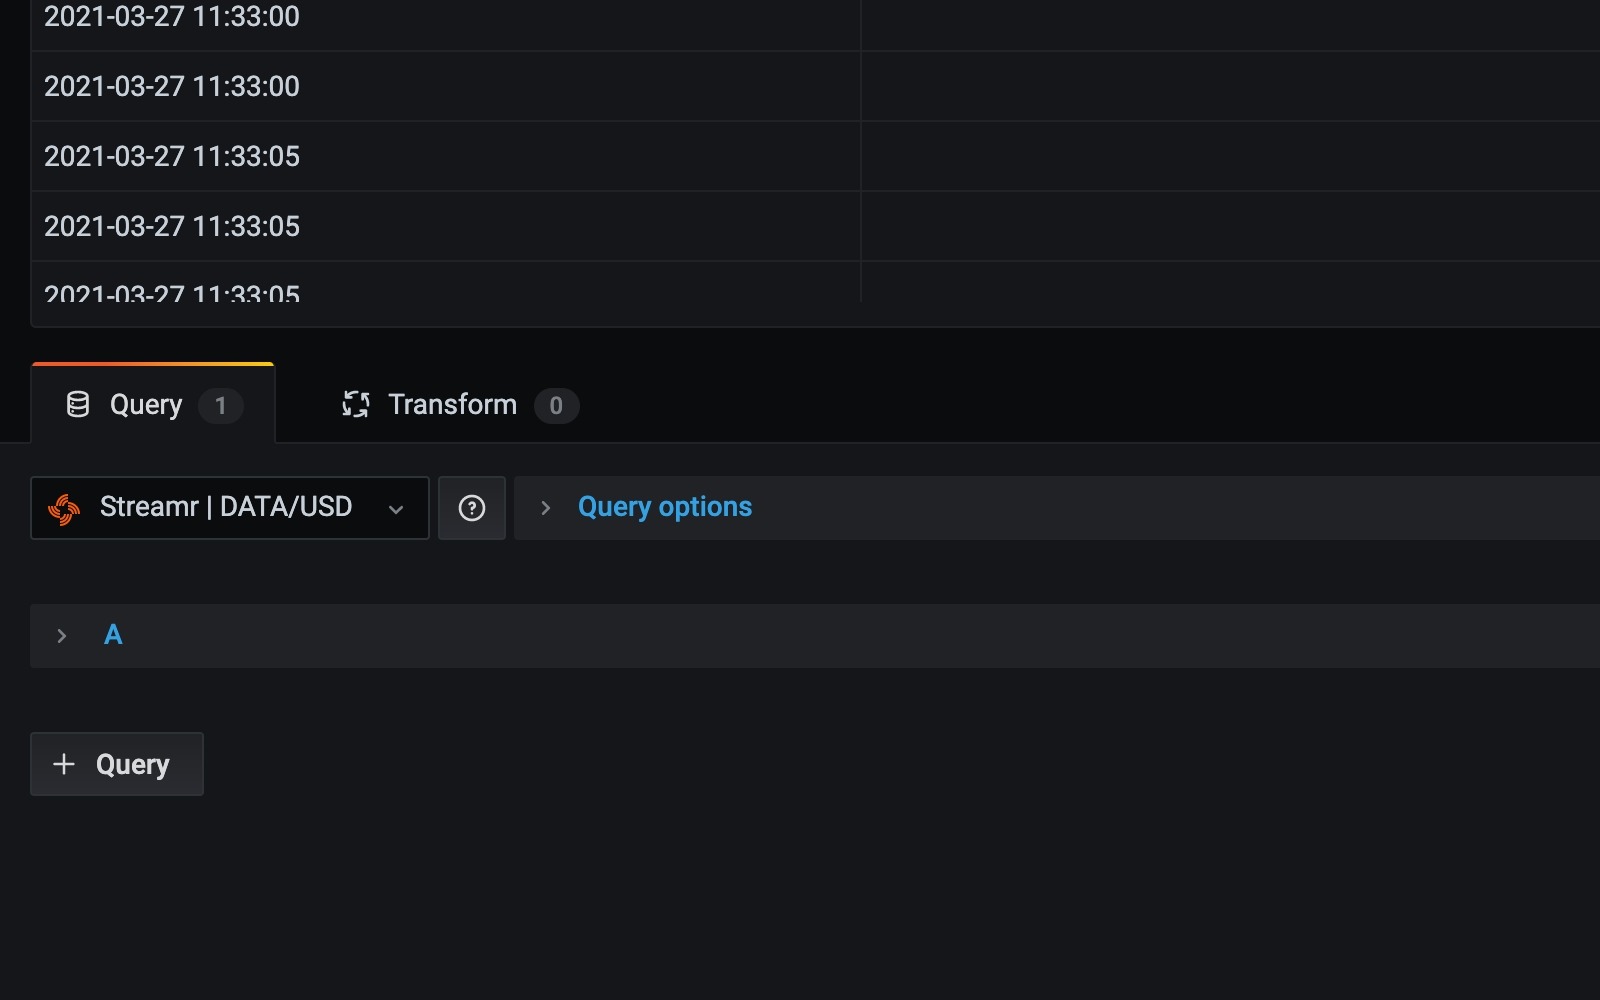
- Go to a Grafana Dashboard, add an empty panel
- Look for the Query tab and select the data source you just created
- Add panel title on the (right) sidebar
- Choose Table as Visualization type (can be changed later)
- Apply your changes
- Save the dashboard
- In some cases it is necessary to reload the dashboard/webpage
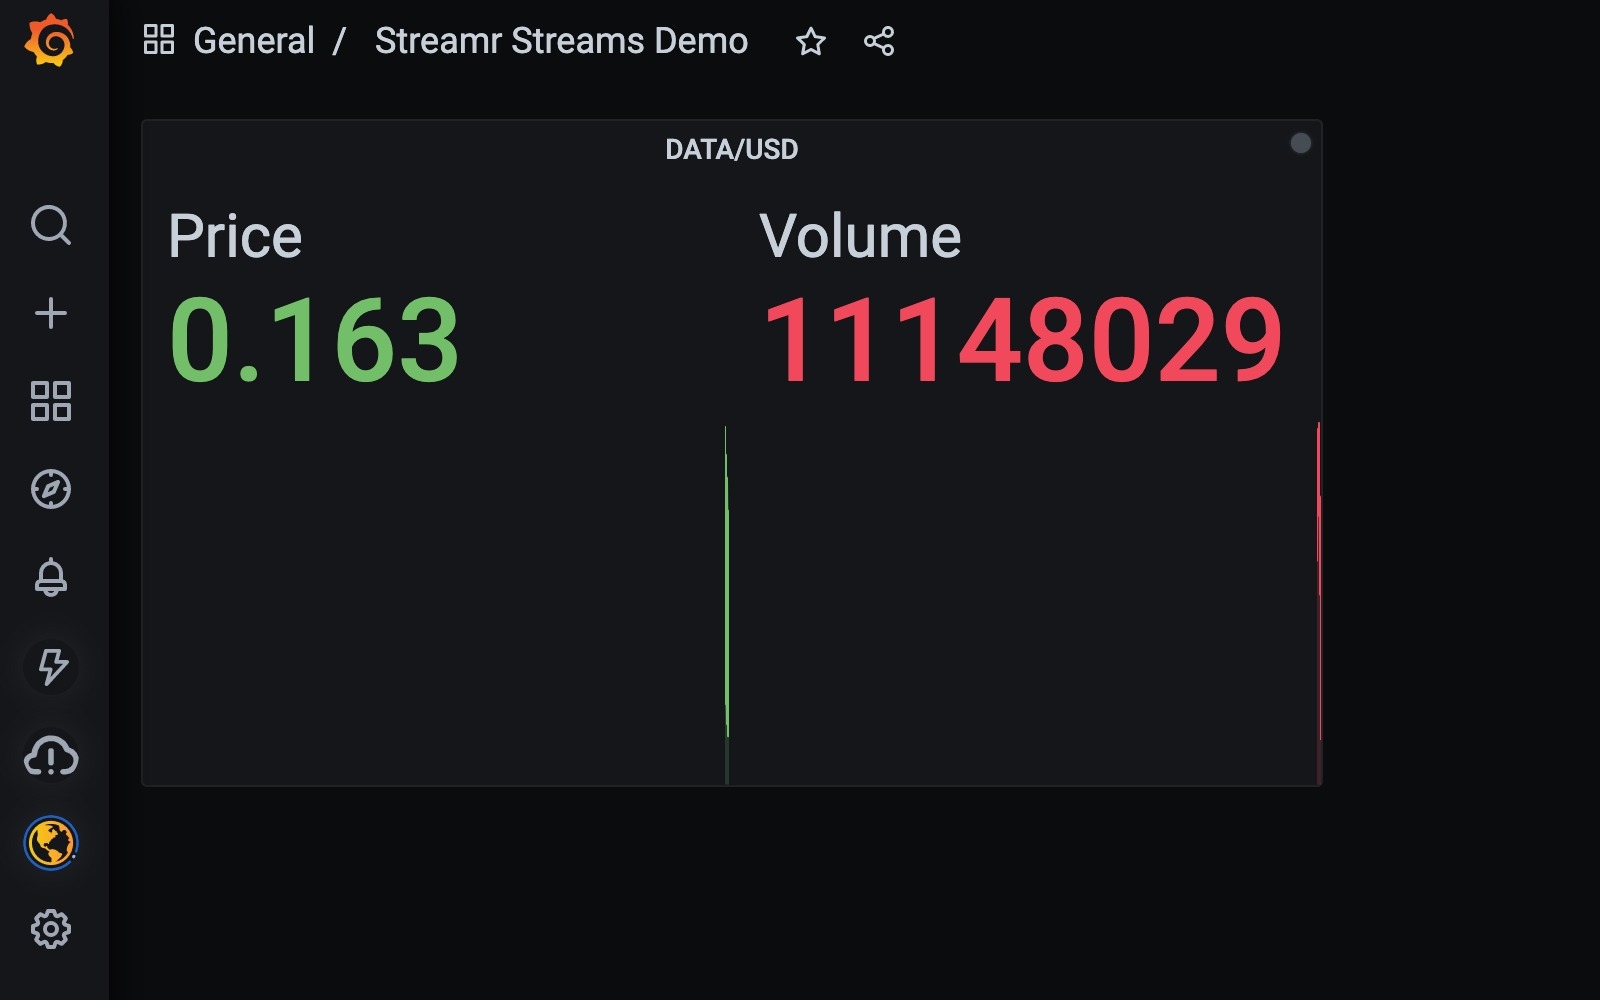
Data Visualization
From now on the data stream can be visualized and transformed by editing the panel (click the panel title), see Grafana help for more infos
Try it
- Private Key: d76f22dc7a2b5ee0839a2adeef3209517108d5ef6ff4f0fecdc0e707304f8cff
- Stream ID: y2Vcw0LCR2yW_PukskIH4Q