Understanding the code structure of plugins in Apache Superset
@apache_superset_biAn initial source of the article: https://medium.com/@alishasaxena2016/understanding-the-code-structure-of-plugins-in-apache-superset-4e57e550e939
I recently started contributing to Apache Superset. To get more clarity on the code structure, I took references from the Echarts plugin for better understanding. I wanted to share what I understood in the process.

Let’s go through the files present in each plugin.
BuildQuery
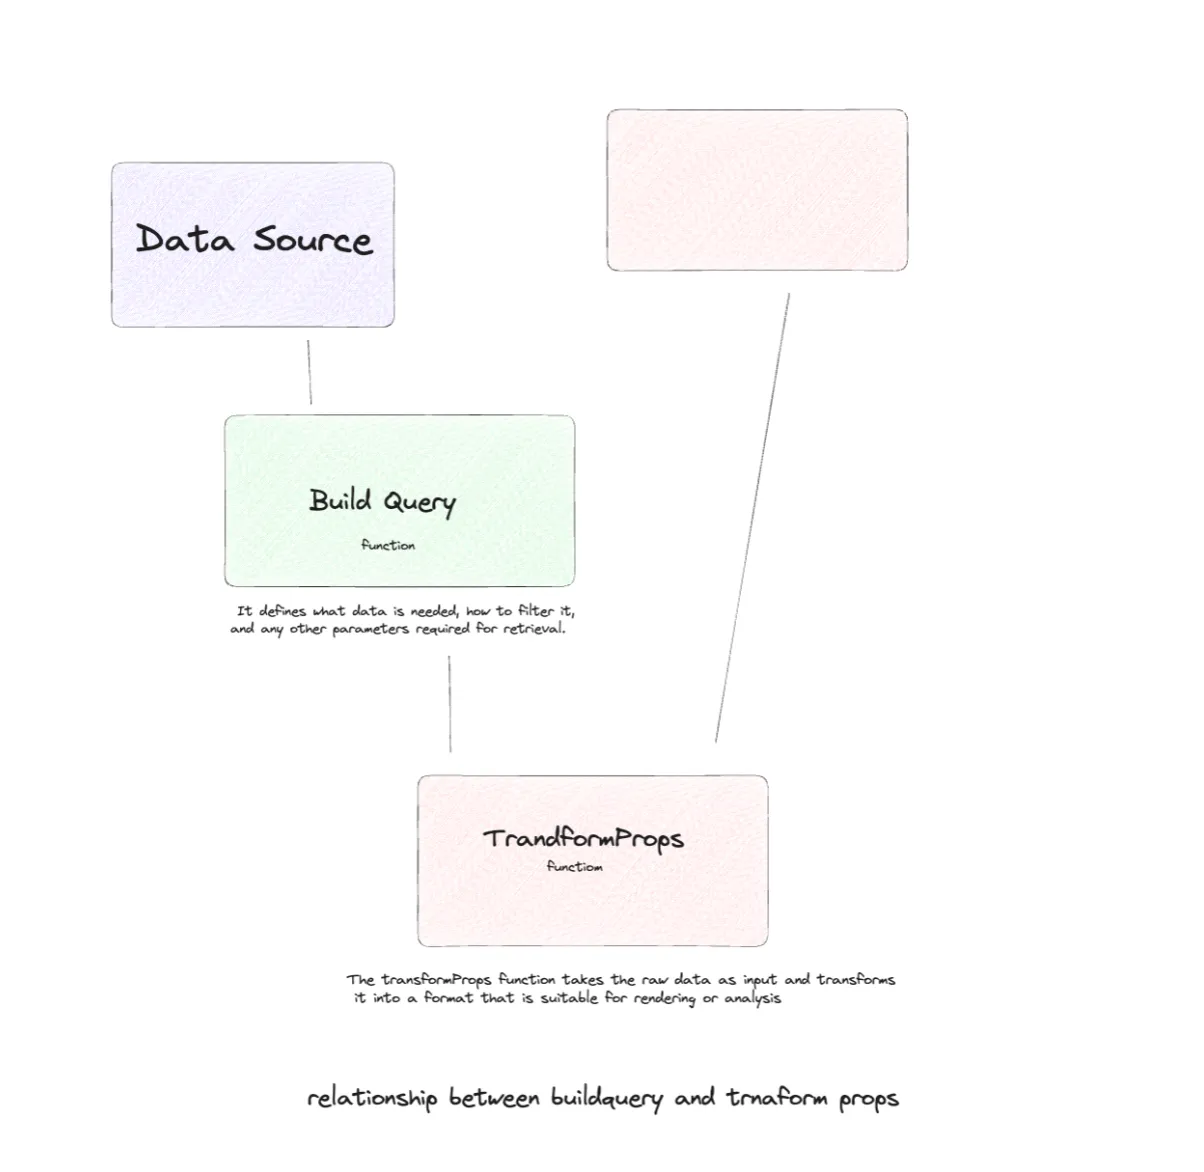
BuildQuery is a JavaScript/TypeScript function for building a query in a Superset plugin. It uses the @superset-ui/core library, which is a part of the Superset environment and provides utility functions for building and managing queries for Superset charts.
BuildQuery Function takes a formData object as a parameter. formData likely contains user-defined parameters and settings for the chart. We can extract properties from the formData object. (Gone through some properties related to limiting the series in the chart.)
There’s a function buildQueryContext function that takes two arguments: formData and a callback function. The purpose of this function is to build the query context based on the provided data. In the callback function passed to buildQueryContext, the code manipulates the baseQueryObject to define the query structure.
This function returns an array containing an object. This object extends the baseQueryObject by overriding the object property that’s defined earlier. The way we are using this function and integrating it into a Superset plugin would depend on the larger context and the requirements of the plugin.
Transform Props
Transform Props file typically plays a role in transforming or processing the props that are passed to a React component responsible for rendering a chart or visualization. Its primary purpose is to manipulate the data and settings before rendering the chart.
Its work is to transform the data received from the backend query into a format that can be readily consumed by the charting library or component used for rendering the visualization. (reshaping data, aggregating data, or converting it into a format that matches the expectations of the library)
This also has a series of import statements that bring in various modules and functions necessary for data transformation and chart rendering. There are several TypeScript type definitions imported from external libraries and the plugin’s own types module.
Transform Props defines several utility functions used for data processing and formatting. (in the code I’m referring to, verifyEdgeSymbol ensures that edge symbols are valid, parseEdgeSymbol parses edge symbols, and getEmphasizedEdgeWidth calculates the emphasized edge width.) There’s also a style function for normalizing and customizing the data, it adjusts node size, edge width, and label visibility. (in my code, it’s normalizeStyles)
Inside the transformProps function, data from the chartProps param is transformed and prepared for chart rendering. This includes processing data, extracting properties, and creating data structures suitable for E-Charts. The transform Props function processes the data to create nodes and edges for the graph chart. There’s an EchartOptions object populated with various ECharts-specific configuration options for the graph chart.
The function returns an object containing properties and data needed to render the graph chart. Finally, the transformProps function is exported as the default export of this module, which makes it accessible for use in other parts of the plugin. Through transform props, we can add the logic required to transform raw data into a format that the charting library can understand and render as a meaningful visualization.
Control Panel:
Control Panel file is responsible for rendering the user interface. It manages and renders the user interface elements related to configuring and customizing a chart or visualization. It allows users to input parameters and settings for the chart. Users can specify various parameters and configurations through the control panel, such as selecting data sources, defining chart dimensions, specifying filters, and setting chart-specific options. If there are errors in user input, the control panel should provide feedback to the user, such as error messages or highlighting the problematic fields. (example, data error, chart not updated, etc). It can update the available options or visualizations based on user selections when users interact with the controls. Control Panel imports various modules and functions that are necessary for building the control panel, including React, translation functions (t) from @superset-ui/core, and control-related utilities from @superset-ui/chart-controls.
The controlPanel variable is defined as a configuration object for the control panel. This object specifies how the control panel should be structured, which sections and controls it should include, and their properties. In the controlPanelSections Array, some sections represent a logical grouping of controls. (In my code, there are sections for Query and Chart options.) Each section includes a label (section title) and an array of controlSetRows that define the rows of controls within the section.
Controls have many properties such as name, config, and description. (The config property specifies the configuration of the control (e.g., its type, label, and default value). The description provides additional information about the control.) Controls are categorized based on their purpose, such as defining source and target nodes, selecting metrics, etc. Default values for controls are provided using the default property within the control’s configuration. These values are there when a user opens the chart. Some controls have visibility rules specified using the visibility property.
The formDataOverrides function allows for modifications to the form data before it is used. (In my case, it overrides the metric control with metrics selected using the getStandardizedControls().popAllMetrics() function.) The controlPanel object is exported as the default export of this module, making it accessible for use in other parts of the Superset plugin.
Type:
The type.ts file typically contains type definitions, interfaces, or type-related code. This has type definitions, constants, Type Aliases, type annotations, etc. The specific contents of the type.ts file depend on the requirements of your plugin. The chart component is where the actual ECharts chart is rendered. It uses the ECharts library to create the chart based on the transformed props. This component typically receives the ECharts options object and renders the chart within the user interface.
For creating a common plugin for every chart, there are several common files and components that we might create. These files are essential for building, configuring, and customizing the chart:
Utility and helper functions may be included to perform common tasks such as data manipulation, formatting, and interactions with the chart library. These functions can be used across multiple files in the plugin.
Constants files may define reusable constants, such as color schemes, default chart configurations, or other values that remain consistent across the plugin.
Stylesheets or CSS files are used to apply custom styling to the chart and the control panel components, ensuring that the chart matches the overall look and feel of the platform.

Common files:
- Constant file define default configuration options for a chart series (in my code, graph series) in ECharts. The default settings provided in this file are used for creating and configuring graph charts within the ECharts ecosystem.
- There can be default key values like — zoom, circular, force, label, emphasis, animation, lifestyle,etc
- There can be controls.tsx file, which defines a set of control panel items and sections used for configuring chart display options.
- This specifies how users can configure various aspects of the chart’s appearance and behavior, such as legends, tooltips, and series sorting options. We can use this as a template and customize it to create control panels for specific types of charts within the Superset ecosystem.
- A default file can also be a common file, that defines a set of constants related to chart configurations. This code provides default configurations for certain aspects of a chart, (in my code, the grid, Y-axis scaling behavior, and legend padding.) These defaults can be used as a starting point when creating or configuring a chart, and they can help ensure that the chart’s appearance and behavior align with common expectations.
- A treeBuilder function is used for constructing a hierarchical tree structure from a flat list of data records.
- (in echarts plugin code)It imports the necessary types and libraries:
- DataRecord and DataRecordValue from @superset-ui/core: These types likely represent data records and their values.
- lodash: A popular JavaScript utility library, used for various data manipulation tasks.
- It defines a type called TreeNode that has name, value, secondary value, groupBy, children, etc, which represents a node in the hierarchical tree structure.
- getMetricValue function is a utility function that takes a datum (data record) and a metric (a string representing a metric) as arguments.
- treeBuilder function is the main utility function for constructing the hierarchical tree structure. It takes data (an array of DataRecord objects), groupBy(an array of strings representing the grouping attributes used for creating the hierarchy), metric(a primary metric used in the tree nodes), secondaryMetric(optional). For each group, it constructs a TreeNode and returns an array of top-level TreeNode objects representing the root nodes of the hierarchical tree.