These Powerful Maps Show the Extremes of U.S. Population Density
@VisualCapitalistOfficialAmerica’s 328 million people are spread across a huge amount of territory, but the population density of various regions is far from equal.
It’s no secret that cities like New York have a vastly different population density than, say, a rural county in North Dakota. Even so, this interactive map by Ben Blatt of Slate helps visualize the stark contrast between urban and rural densities in a way that might intrigue you.
How many counties does it take to equal the population of these large urban areas? Let’s find out.
New York City’s Rural Equivalent
New York City (proper) Population: 8.42 million
New York City Population density: 27,547 persons / mi²
New York City became the largest city in the U.S. back in 1781 and has long been the country’s most densely packed urban center. Today, 1 in every 38 people living in the United States resides in The Big Apple.
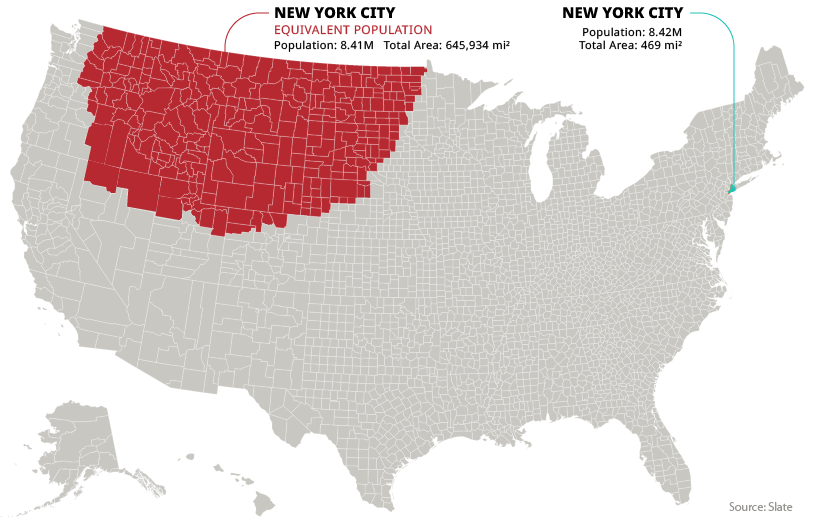
For the northwestern counties above to match the population of New York City, it takes a land area around the size of Mongolia. The region shown above is 645,934 mi², and runs through portions of 12 different states.
In order to match the population of the entire New York metropolitan area, which holds 18 million people and includes adjacent cities and towns in New York state, New Jersey, and Connecticut, the above equivalent area would have to be even more massive.
Los Angeles County’s Rural Equivalent
LA County Population: 10.04 million
LA County Population density: 2,100 persons / mi²
Los Angeles County is home to the 88 incorporated cities that make up the urban area of Los Angeles.
Even excluding nearby population centers such as Anaheim, San Bernadino, and Riverside (which are located in adjacent counties) it is still the most populous county in the United States, with over 10 million inhabitants.
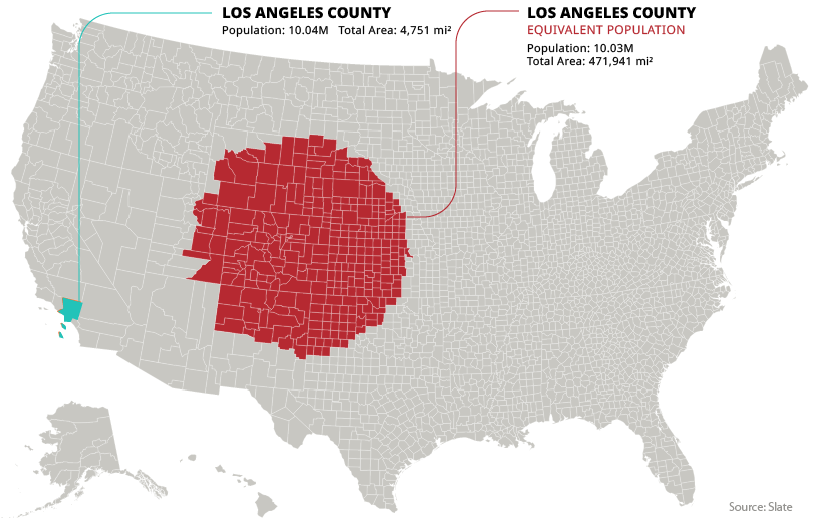
To match this enormous scale in Middle America, it would take 298 counties covering an area of 471,941 mi².
Chicago’s Rural Equivalent
Chicago Metropolitan Area Population: 9.53 million
Chicago Metropolitan Area Population density: 1,318 persons / mi²
Next up is America’s third largest city, Chicago. For this visualization, we’re using the Chicago metropolitan area, which covers the full extent of the city’s population.
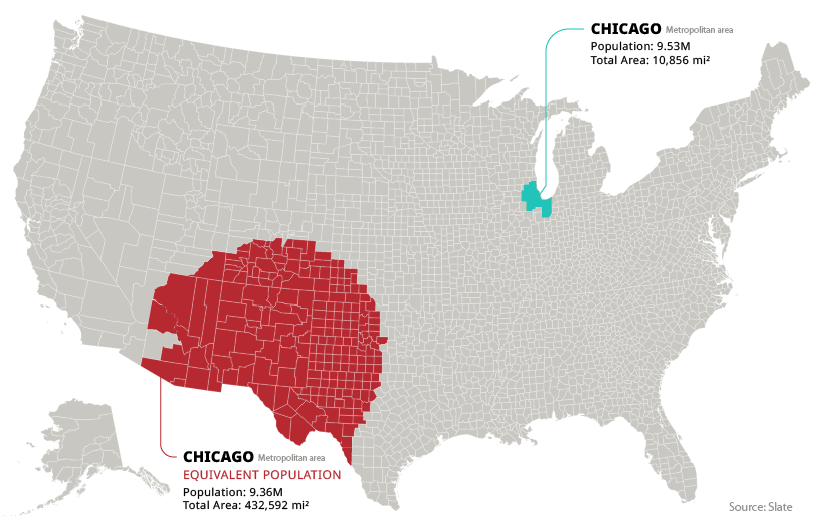
To match the scale of the population of the Windy City, we would need to add up every county in New Mexico, along with large portions of Colorado, Arizona, and Texas.
Turning the Tables?
Conversely, what if we transported the people in the country’s least densely populated counties into the middle of an urban center?

As it turns out, the total population of the five least populated counties is just 1,394—roughly the same amount of people that live on the average Manhattan block.