The market outlook
them8To understand the possibility of big moves of crypto market lets look at Stock one.
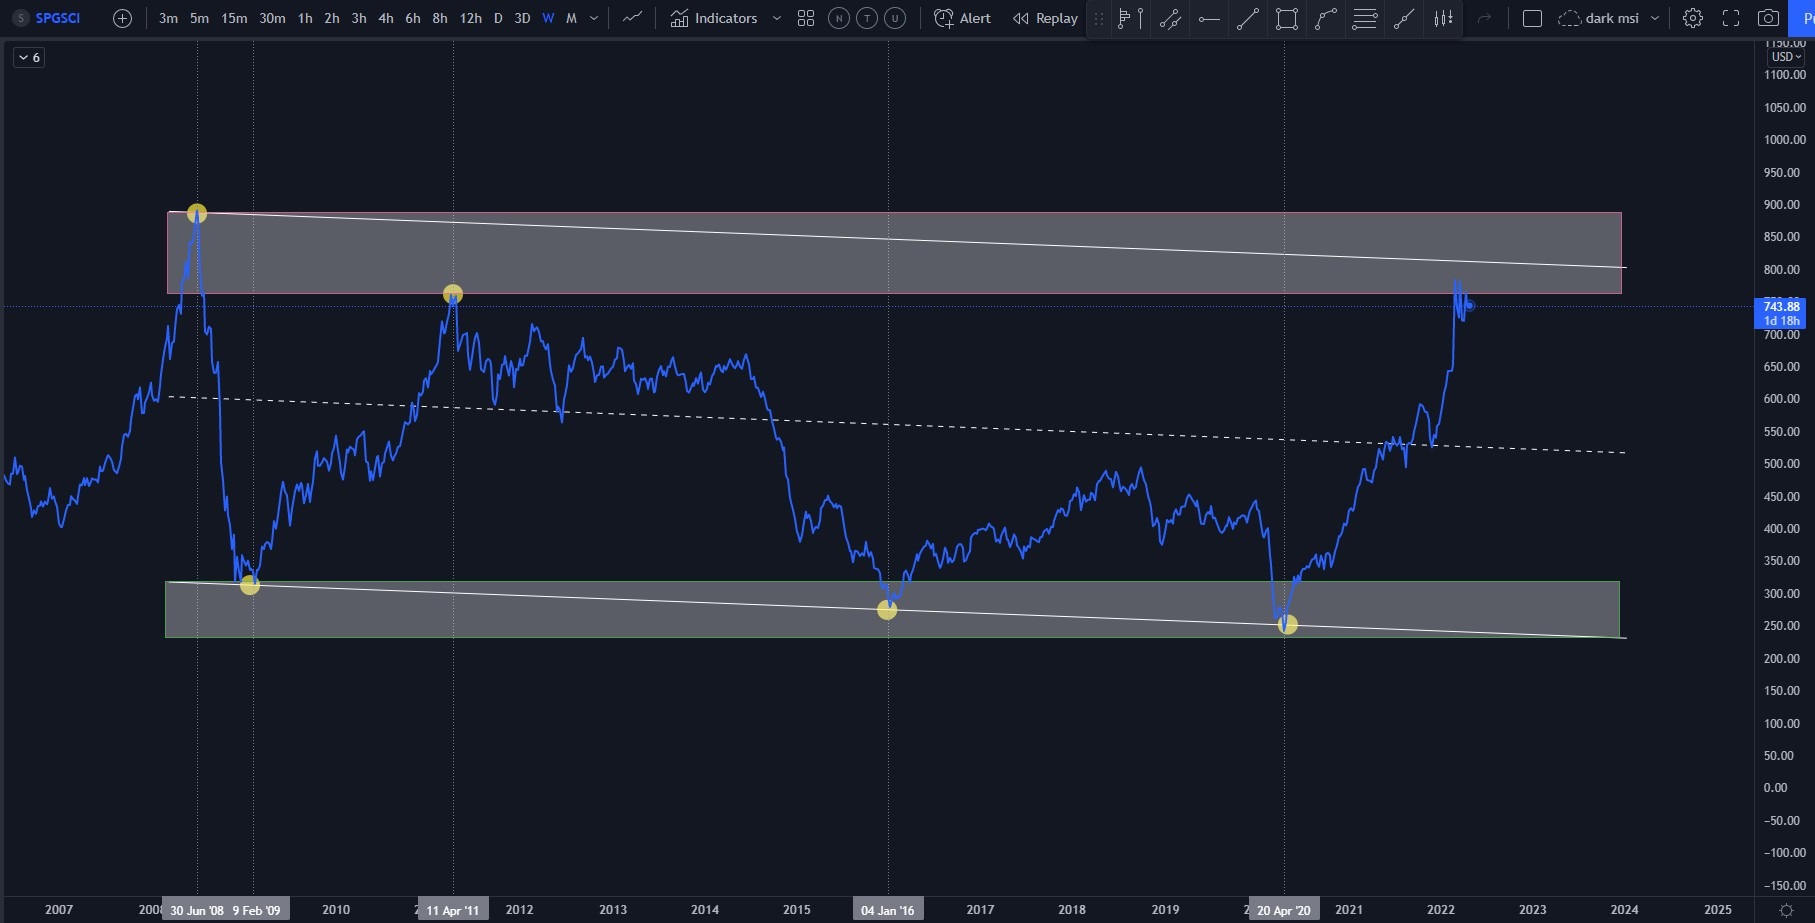
S&P500 is the main "indicator" of market sentiment. Here is a weekly chart of S&P500 to GSCI(Goldman Sachs Commodity Index). The S&P GSCI is a world-production weighted index that is based on the average quantity of production of each commodity in the index, over the last five years of available data. This allows the S&P GSCI to be a measure of investment performance as well as serve as an economic indicator.
Every time the index touches the "demand area" - green rectangle - stock market crashes. Its a weekly chart, the index is around "supply area" nowadays, also its near the upper line of parallel channel, with the possibility to go down till the middle or lower line.
What it means for markets - big sell offs may occur.
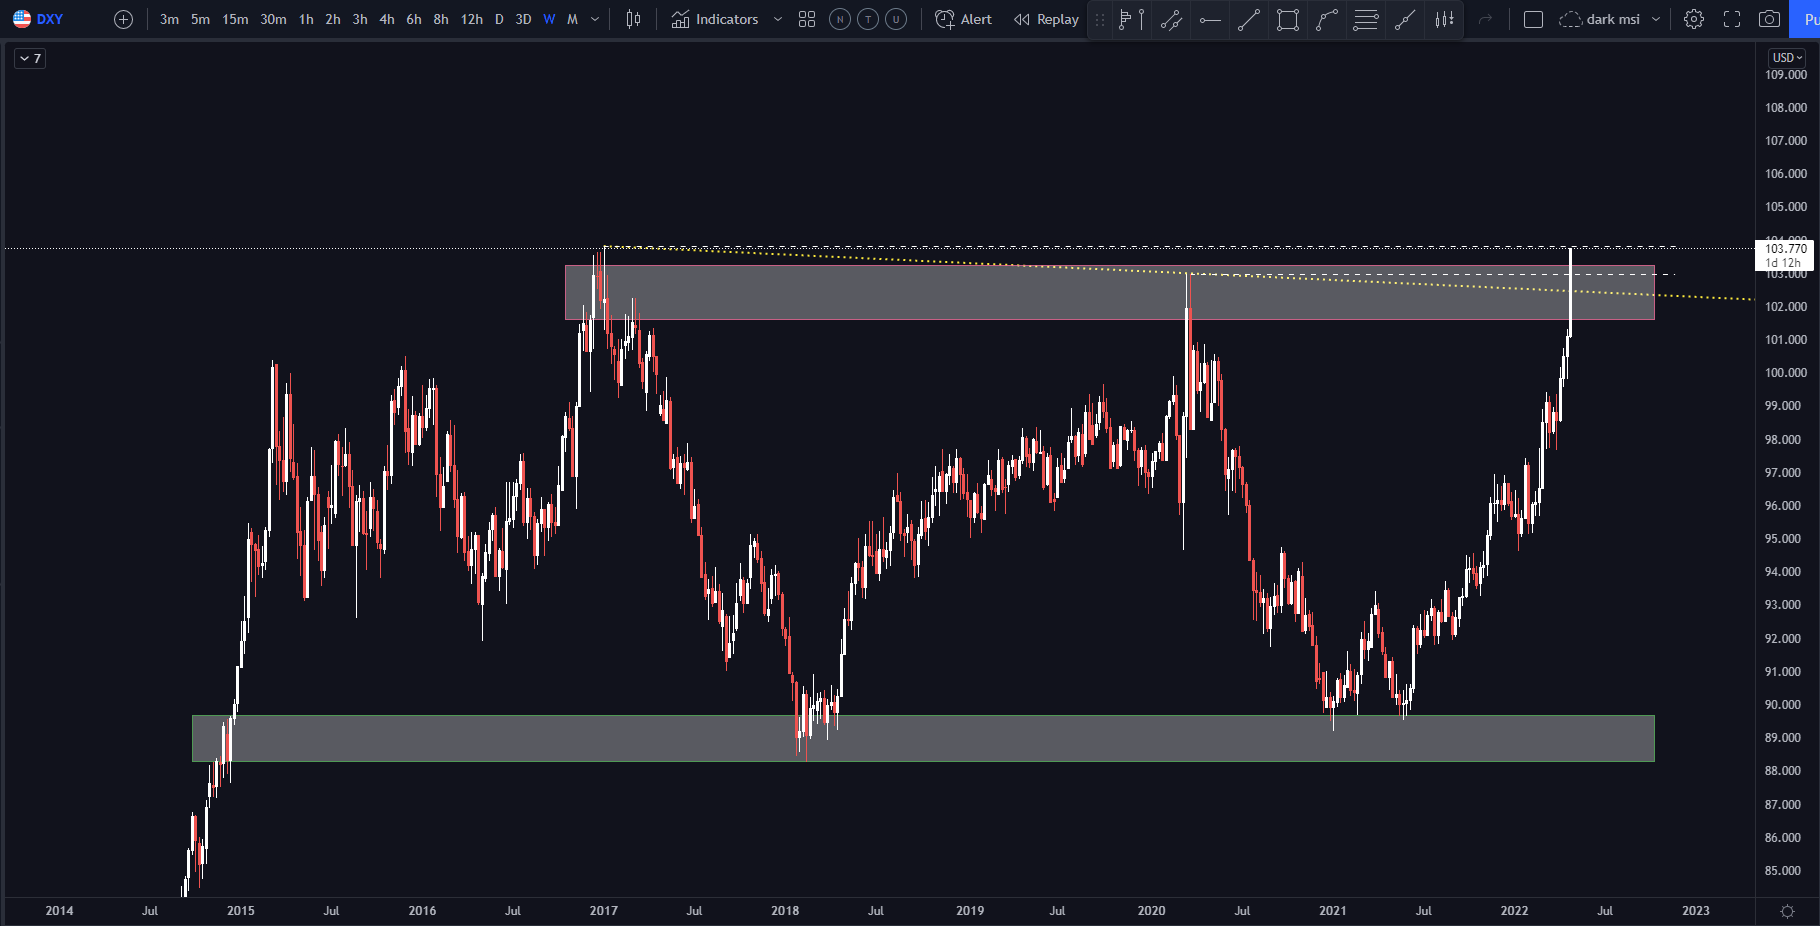
Also DXY on a weekly chart is right near ATH from January 2017. If it goes higher the stock market may keep falling down.
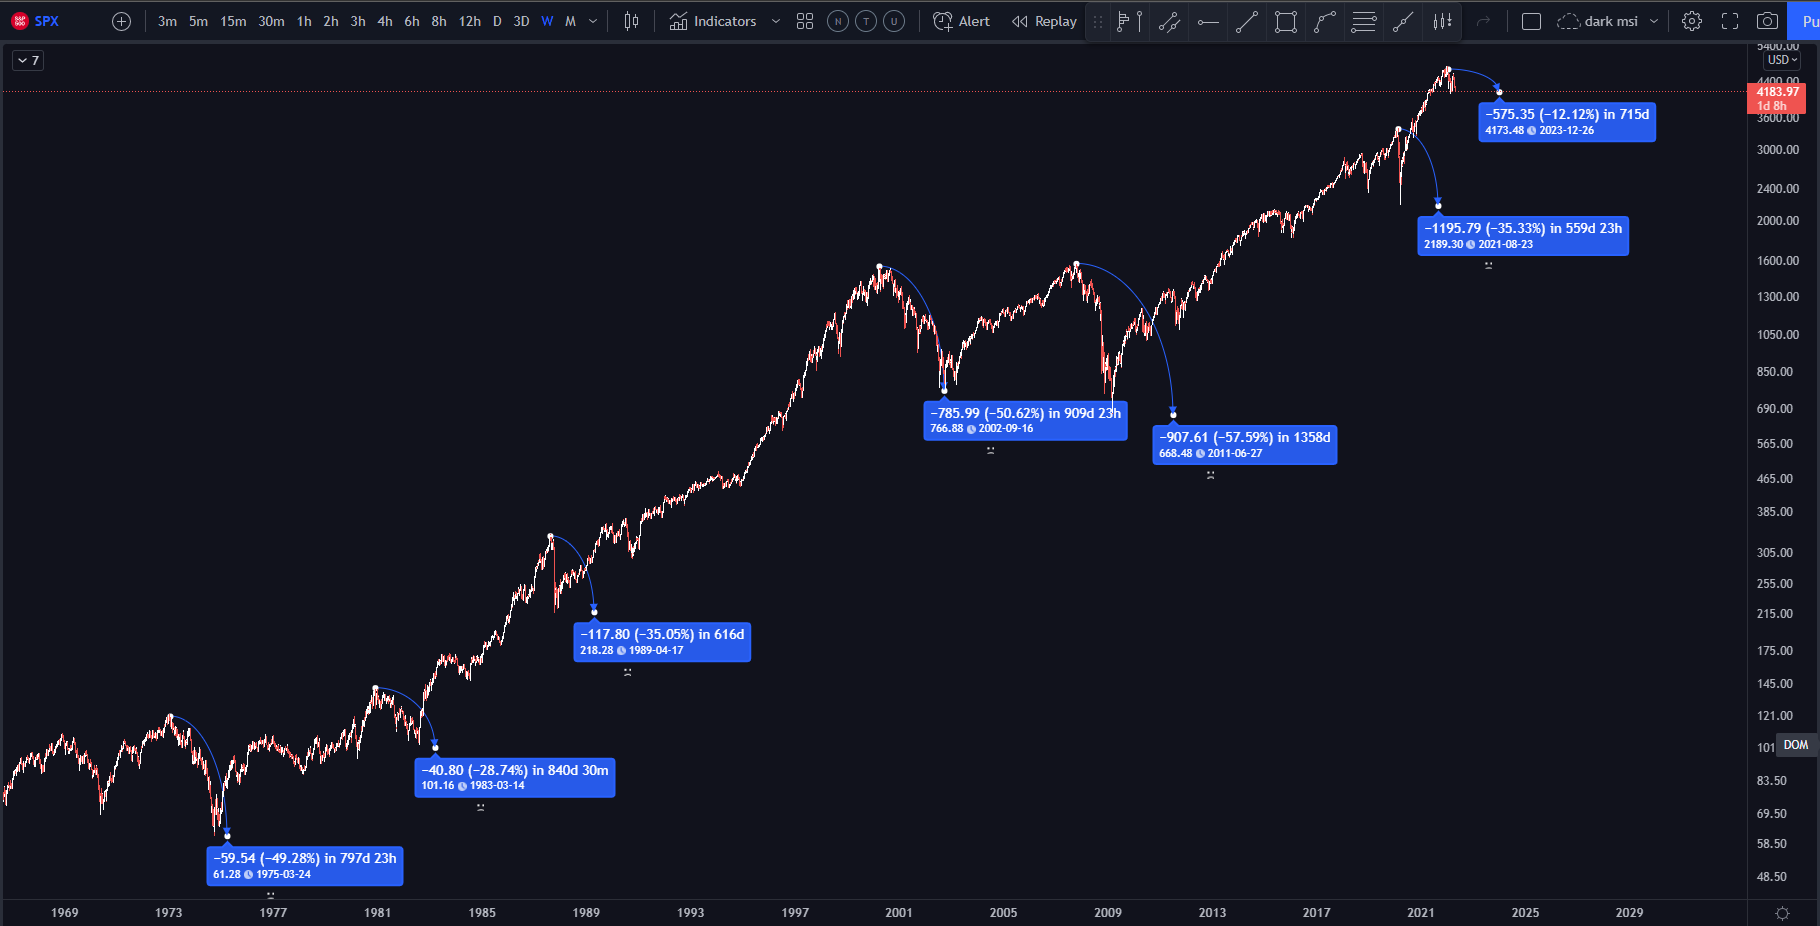
The average correction from 1972 on S&P500 is ~42%, now its only 12% from ATH.
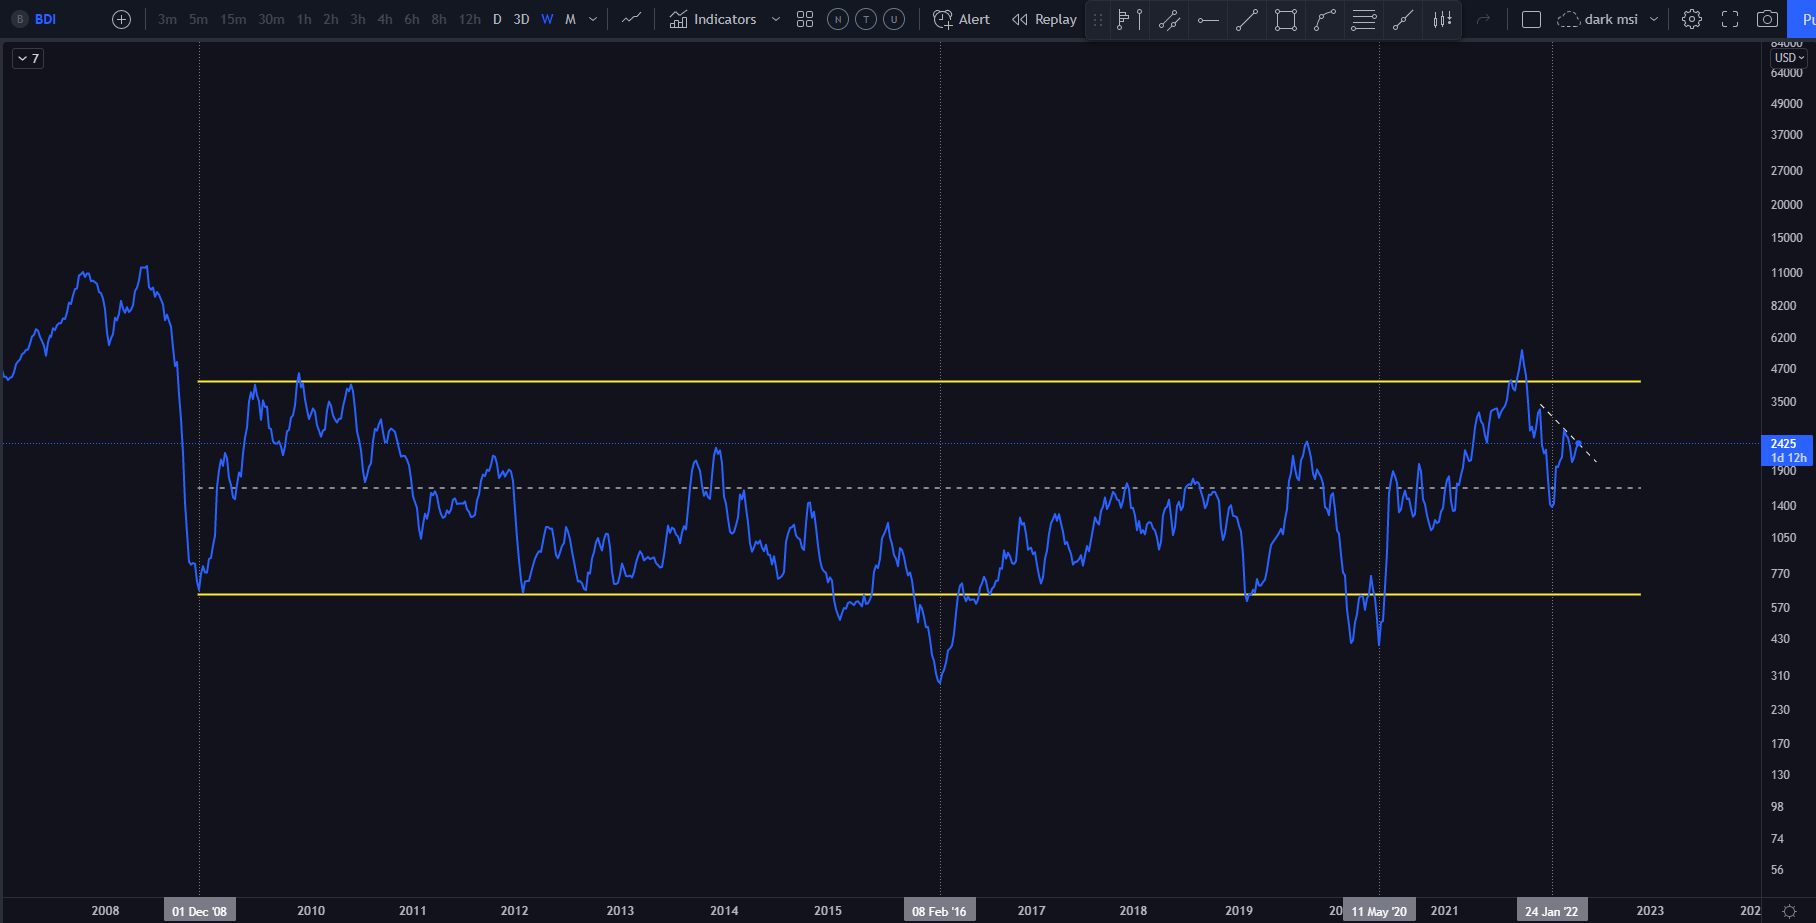
Another indicator of future economic activity can be the BDI (Baltic Dry Index).
Most directly, the index measures the demand for shipping capacity versus the supply of dry bulk carriers. The demand for shipping varies with the amount of cargo that is being traded or moved in various markets (supply and demand).
The index indirectly measures global supply and demand for the commodities shipped aboard dry bulk carriers, such as building materials, coal, metallic ores, and grains.
Because dry bulk primarily consists of materials that function as raw material inputs to the production of intermediate or finished goods, such as concrete, electricity, steel, and food, the index is also seen as an efficient economic indicator of future economic growth and production.
Now the index is moving sideways in a parallel channel from December 2008.
Total Marketcap on a daily chart is right near trend line(orange one), the spikes of horizontal volume, where it can bounce up, if it goes down are ~ 1.7T, 1.5T, 1T usd. on the way up is only ~ 2T usd.
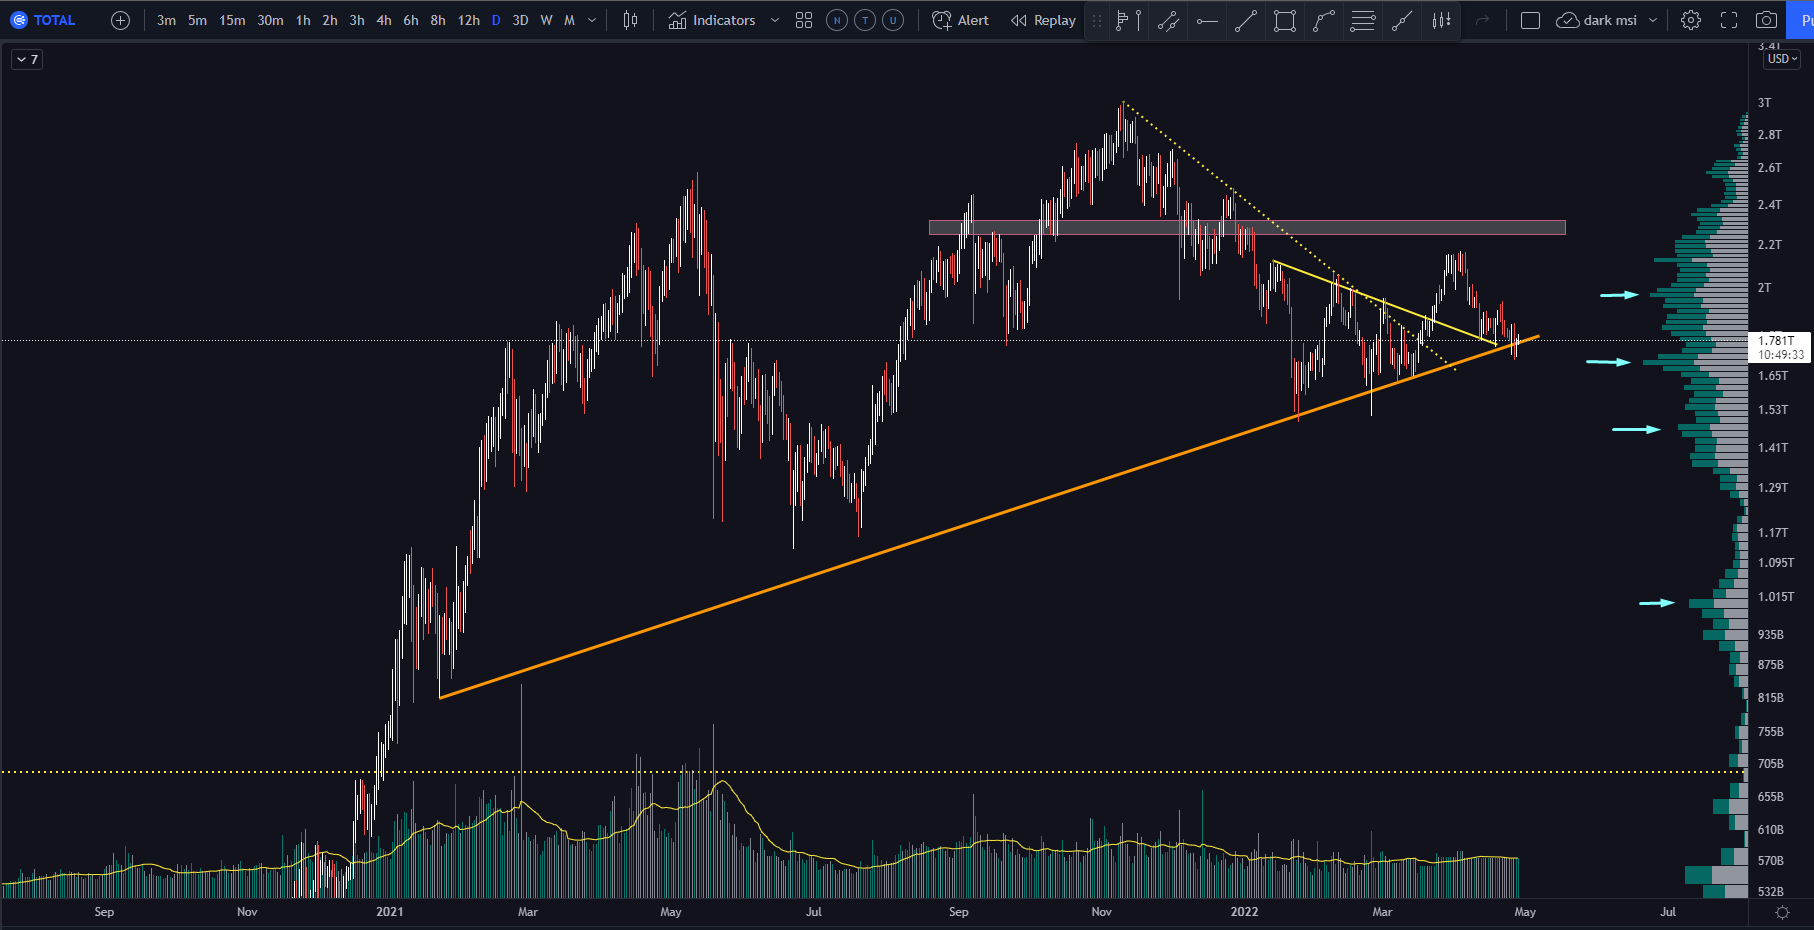
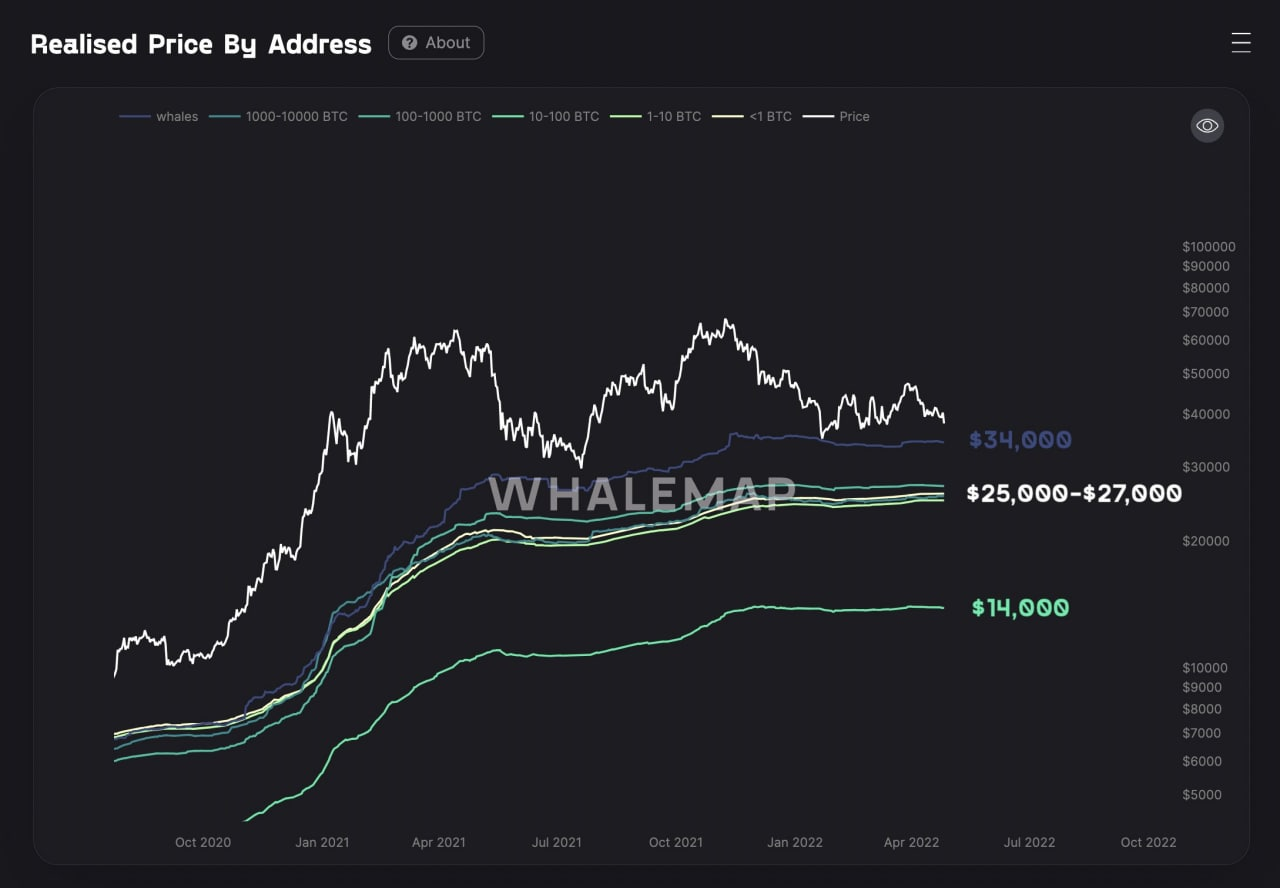
Here is another reason for shakeout - take the coins from weak arms. Around 25-27k usd big positions was accumulated.