The Science of Candlestick Analysis: Fusing Formations and Market Dynamics
Within the dynamic world of trading, understanding market signals is crucial for making informed decisions. Amidst the various tools at the disposal to traders, candlestick analysis is prominent for its visual depiction of price movements and its ability to signal potential market reversals or continuations. Through interpreting candlestick patterns, traders can gain insights into market psychology, allowing them to identify potential entry and exit points. Nevertheless, the real power of candlestick signals is enhanced when they are used with broader market structures and momentum indicators.
As we explore the art of candlestick analysis, we will examine how these signals work in conjunction with market trends. Recognizing shapes in candlestick formations can provide valuable trade confirmations, especially when supported by the underlying momentum of the market. This approach not only enhances the reliability of trading signals but also arms traders with a deeper understanding of price action, enabling traders to navigate the intricacies of the trading landscape with increased confidence.
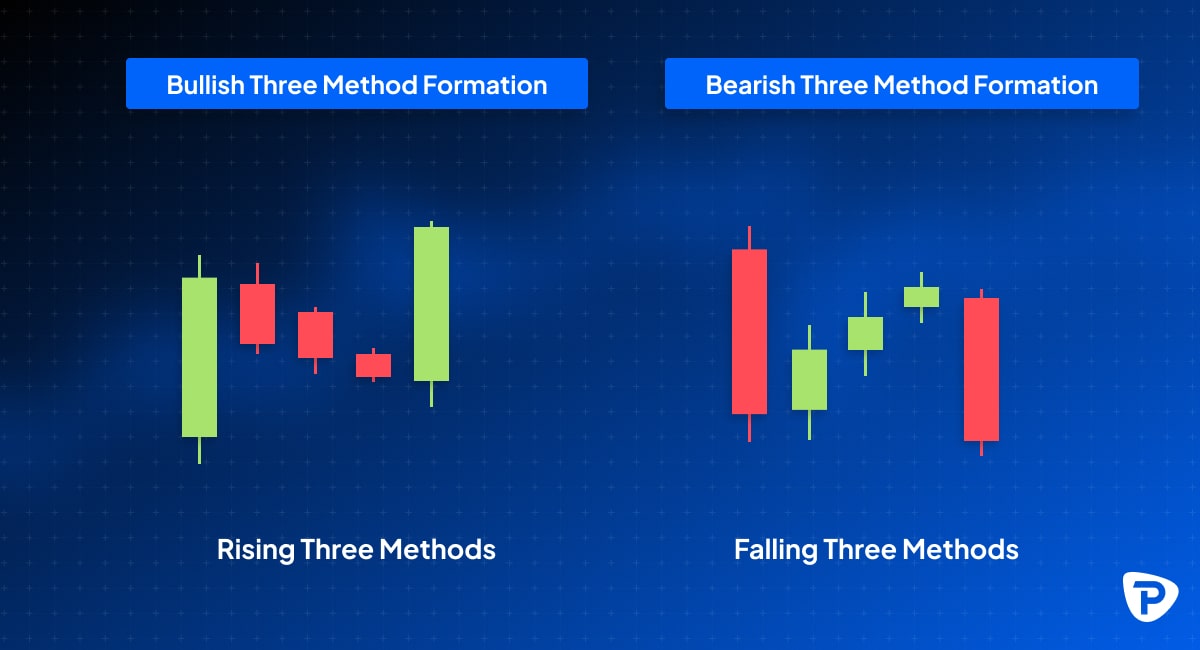
Grasping Candlestick Patterns
Candlestick patterns represent vital tools in technical assessment, providing traders with the market mood. Each stick displays the price movement over a specific timeframe interval, displaying the open, high, low, and close values. By examining the form and hue of these candles, investors are able to deduce the market's direction and identify likely trend reversals or resumptions. Identifying common forms such as doji, hammer, engulfing, and shooting star assists traders anticipate future market movements and make informed decisions.
Integrating candlestick patterns and market structure boosts the accuracy of these signals. The market structure refers to the overall schema of support and resistance levels that dictate market action. When a candle formation appears at a significant support or resistance zone, its trustworthiness as a trading signal grows. For instance, an engulfing stick at a support level may suggest a bullish turnaround, while a shooting star at resistance could signal a bearish turnaround. Analyzing these forms within the framework of market structure provides a more robust trading approach.
Incorporating momentum-based indicators is another valuable way to affirm candlestick indicators. Momentum-based indicators, such as the Relative Strength Index (RSI) or Moving Average Convergence Divergence (MACD), help measure the power of a movement. When a stick formation appears alongside a momentum indicator suggesting strong buying or selling activity, investors can have increased trust in the authenticity of the signal. This interaction between candle forms and momentum trading indicators paves the way for more precise trading choices and better risk management.
Integrating Financial Framework
Grasping market structure is crucial for effective candlestick analysis. Furthermore, market structure refers to the general structure within which price movements occur, consisting of market trends, support levels and resistance levels, and the common behavior of traders. By determining whether the market is in a trend, moving sideways, or changing direction, traders can better analyze candlestick signals to align their strategies with ongoing market conditions.
When paired with candlestick patterns, market structure provides perspective that enhances the validity of trading signals. For case, a bullish engulfing pattern appearing at a strong support level can serve as a significant confirmation signal, suggesting a greater probability of an upward trend. On the other hand, noticing a negative reversal pattern like a shooting star at a resistance level bolsters the argument for a potential decline. This interaction between candlestick formations and market structure is important for making knowledgeable trading decisions.
Additionally, recognizing the subtleties of market momentum can further refine the trading approach. Momentum trading indicators assist assess the intensity of a trend, enabling traders to decide whether to enter or exit based on candlestick patterns together with market structure. For example, if a bullish engulfing pattern coincides with increasing momentum, it signals a robust buying opportunity. Combining these elements creates a comprehensive system that equips traders with the insights needed to manage the intricacies of the market with improved efficiency.
Leveraging Directional Trading Indicators
Momentum market indicators constitute essential tools which help investors assess the strength and direction of market movements. By measuring the rate of variation in price, these signals provide information into whether a trend is apt to continue or reverse. Popular momentum signals include the RSI, MACD, and Stochastic Metric. Each of these indicators can enhance the effectiveness of price action signals, helping investors to better identify entry and exit points based on the prevailing market momentum.
When used with candlestick formations, momentum indicators can provide powerful confirmation signals. For example, if a positive candlestick pattern emerges alongside a increasing Relative Strength Index, this may signal significant acquisition momentum, supporting the strength of the signal. Conversely, if AKMelytics in conjunction with a declining Moving Average Convergence Divergence, it can offer a strong argument for a possible trend reversal. By monitoring momentum, traders can confirm they are not merely depending on price action patterns but are also considering the larger market sentiment.
In addition, assessing momentum within the context of market dynamics supports tactical decision-making. When higher highs are noted in market movements alongside enhancing momentum readings, it creates confidence that a bullish movement is intact. Conversely, if the market structure shifts to declining peaks while momentum signals show a discrepancy, traders should exercise caution as this may signal a deteriorating trend. Consequently, utilizing directional trading signals in conjunction with candlestick signals provides a comprehensive strategy that enhances trading results.
Analyzing Price Action Verification Signals
Candle validation signals are vital for traders seeking to confirm possible market fluctuations. These signals typically appear after a notable candlestick formation and show the probability that a price direction will continue. For instance, when a bullish consuming formation is preceded by a robust bullish candle that ends above the last candle’s top, it can function as a reliable signal for investors to initiate a long position. This method helps reduce dangers associated with erroneous signals that can arise in unstable market environments.
Integrating candle validation signals with market context increases the credibility of trading actions. Investors can examine key support and resistance levels in conjunction with candle patterns to gain a more distinct view of the market behavior. For example, if a reversal candlestick develops at a important support level and is confirmed by a later positive candlestick, it suggests not only a reversal signal but also strengthens the power of the supportive level. This fusion of candlestick indicators and market structure is vital for carrying out profitable deals.
Momentum trading indicators further strengthen the impact of candlestick validation signals. When a series of candlestick formations aligns with rising momentum, as shown by momentum indicators or moving averages, it can signal strong price continuation. For instance, if a double peak formation is confirmed by a negative candlestick and combined with inconsistent momentum signals, it backs the concept of a impending price fall. This multi-faceted approach allows investors to make more informed choices, improving their overall investment approach.
spintax
### Strategies for Effective Trading
To successfully leverage candlestick signals in your trading, it's important to initially establish a clear understanding of market structure. Determining key levels of support and sell zones helps pinpoint where price is probably to react. By merging these levels with specific candlestick patterns, traders can gain insights into likely market reversals or continuations. For example, a bullish engulfing pattern at a solid support level can indicate a high-probability buy signal, while a bearish pattern at resistance might suggest a shorting opportunity.
In addition to recognizing candlestick patterns and market structure, incorporating trend trading indicators can significantly enhance your trading decisions. Indicators like the Momentum Index or MACD provide important context about market momentum. For example, a bullish candlestick pattern confirmed by an upward-moving RSI signals that not only is the candlestick pattern valid, but there is also robust buying momentum driving the price up, increasing the likelihood of a successful trade.
In conclusion, traders should focus on candlestick confirmation signals to reinforce their trading strategy. Instead of depending solely on a single candlestick pattern, look for additional confirmation from following price action. A confirmation candle that continues the direction of the initial pattern supports the case for a trade. Moreover, waiting for the completion of the candle before entering trades can offer better accuracy, reducing the risk of false signals and boosting overall trading performance.