The "Guppy” strategy for binary options
@DavidTraderSignalsThe Australian trend trading guru, Daryll Guppy, presented the world with a trading strategy with the unusual name “Guppy". It is based on the observation of two groups of moving averages, each of which reflects the dynamics of the trend at a different rate.
Instead of the classical approach, where the intersection of fast and slow moving averages serves as an entry signal, Guppy offers a more subtle analysis. It allows you to filter out false signals that often occur during periods of sideways market movement. It is thanks to this filtering that the “Guppy” strategy practically does not allow losses during a flat.
What is the secret of this strategy? It is based on the use of two “packs” of moving averages – fast and slow. Traditionally, the intersection of a fast and slow moving average serves as a signal to open a position, but this approach often leads to false signals during the sideways movement of the market.
Guppy solves this problem in an elegant way. Instead of a single line, each “flock” consists of several moving averages with different periods. Fast moving averages, like sensitive guppy fish, react quickly to the slightest price fluctuations, indicating short-term trends. Slow moving averages, like large fish, move more smoothly, reflecting long-term trends.
The analysis of the relative position of these “flocks” allows the trader to determine the strength and direction of the trend, filtering out false signals. When the fast moving averages are above the slow ones and are directed upwards, this indicates a strong uptrend, giving the green light to open a long position. The reverse situation – fast moving averages are lower than slow ones and look down – indicates a downtrend, opening up opportunities for short positions.
- Setting up the ”Guppy" strategy
The main idea of the Guppy strategy is to visualize short–term and long-term trends using moving averages with different periods.
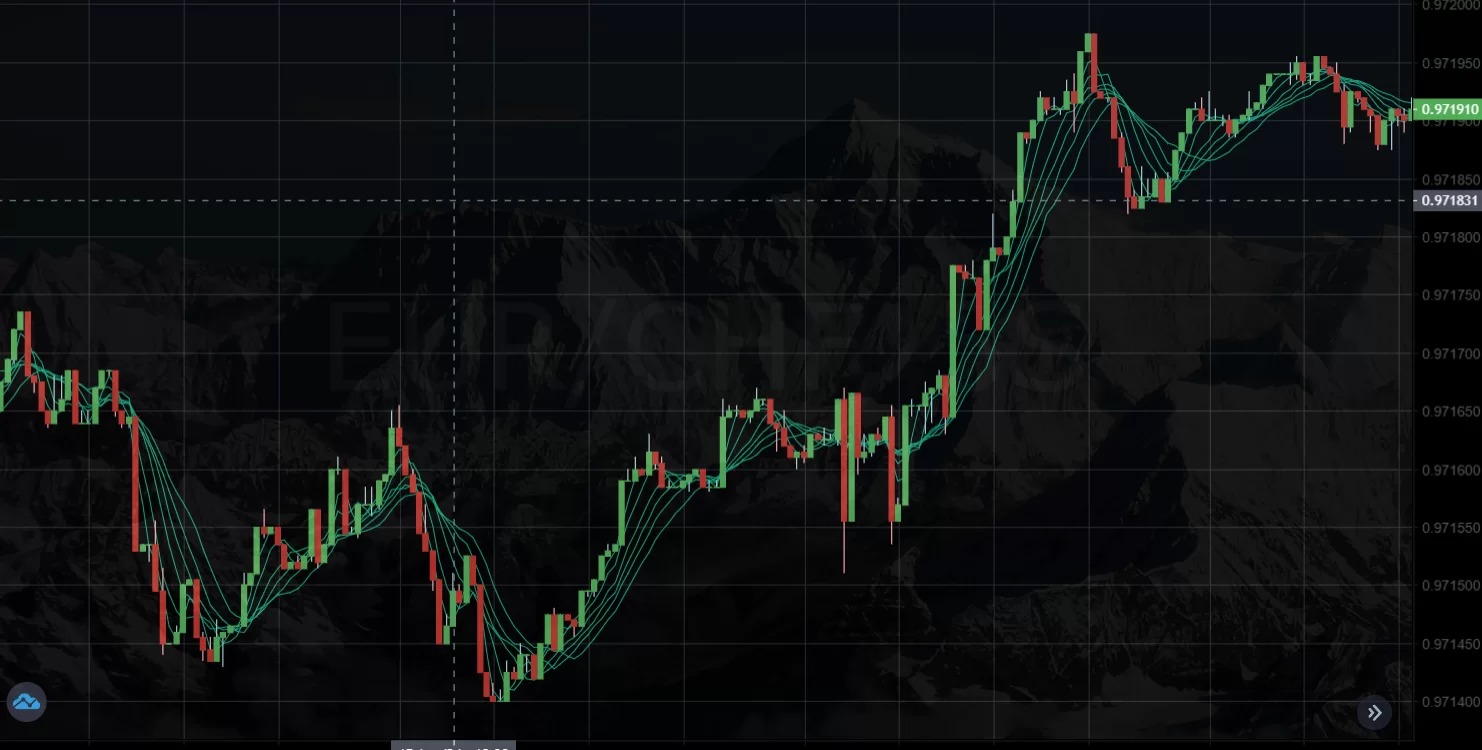
1.Fast MA: 6 moving averages with periods 3, 5, 8, 10, 12 and 15 are superimposed on the chart. They are displayed in the same color (in our example, the lines are green). These lines show short-term price fluctuations and help identify entry and exit points.
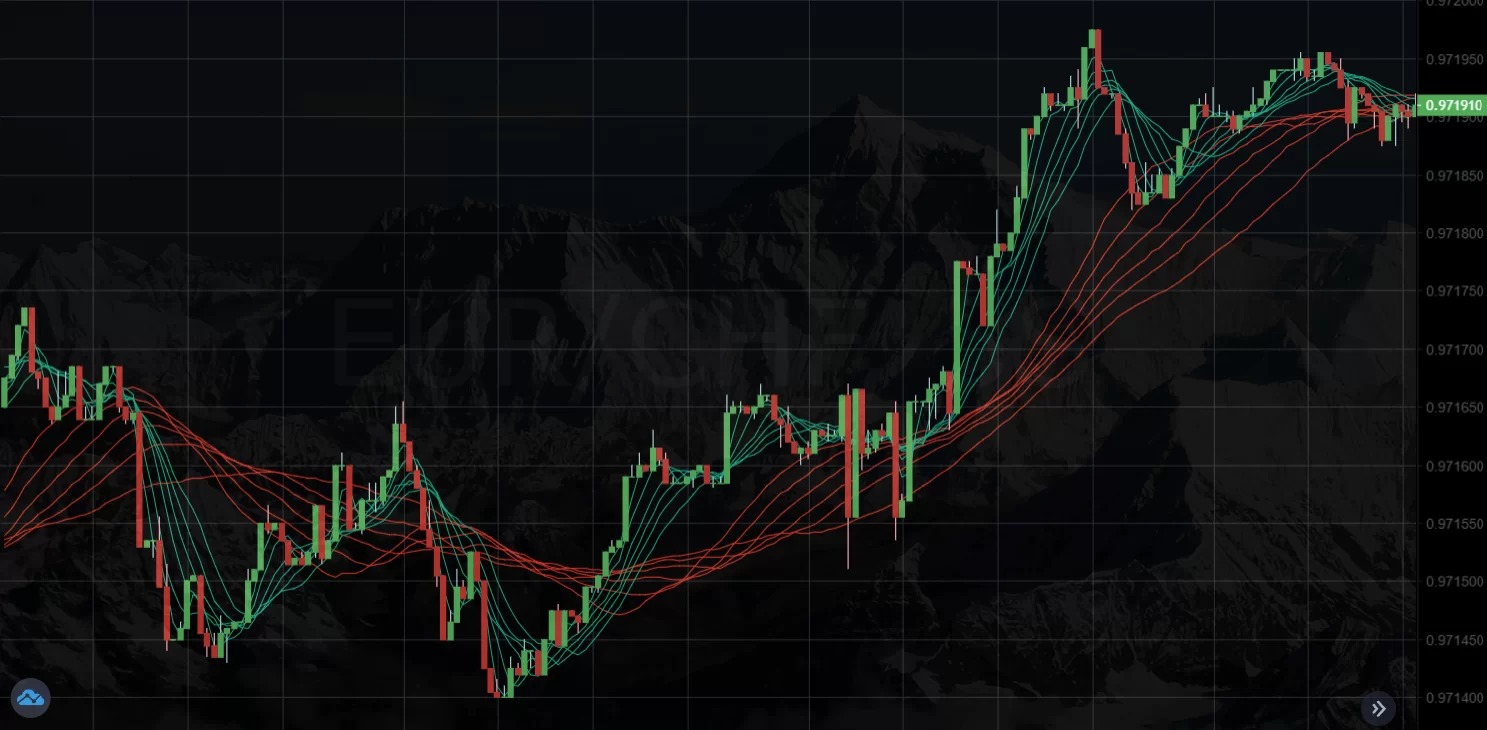
2.Slow MA: The next layer is 6 moving averages with periods of 30, 35, 40, 45, 50 and 60. A different color is selected for them (red lines on the graph). These lines reflect the medium-term trend and serve as a kind of filter for fast MA signals.
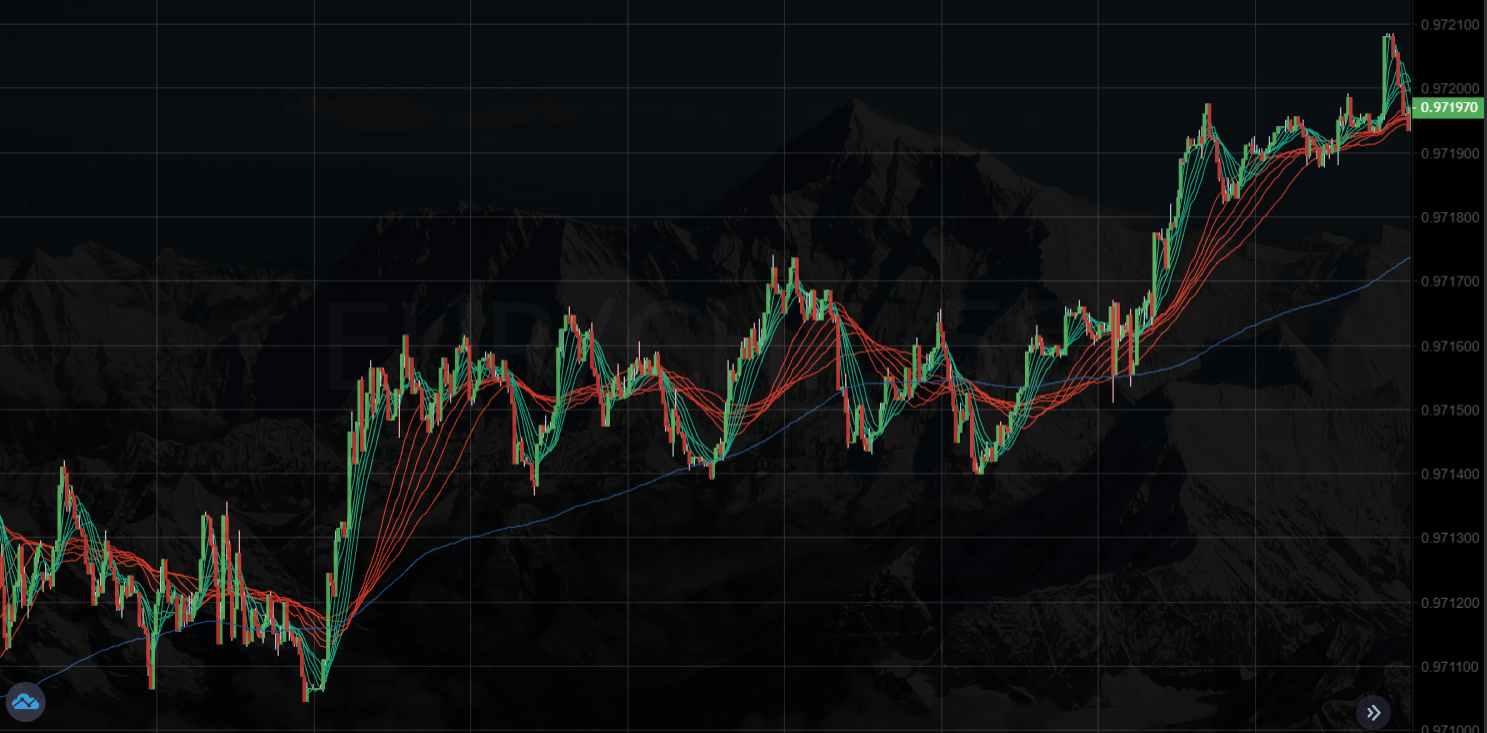
3.The final touch is a moving average with a period of 200. It stands out with a blue line and shows a long-term trend.
2.We recognize an uptrend
On the chart, with an uptrend, the green lines of the indicator line up in a neat row, pointing upwards. Under them, like a shadow, there are red lines.
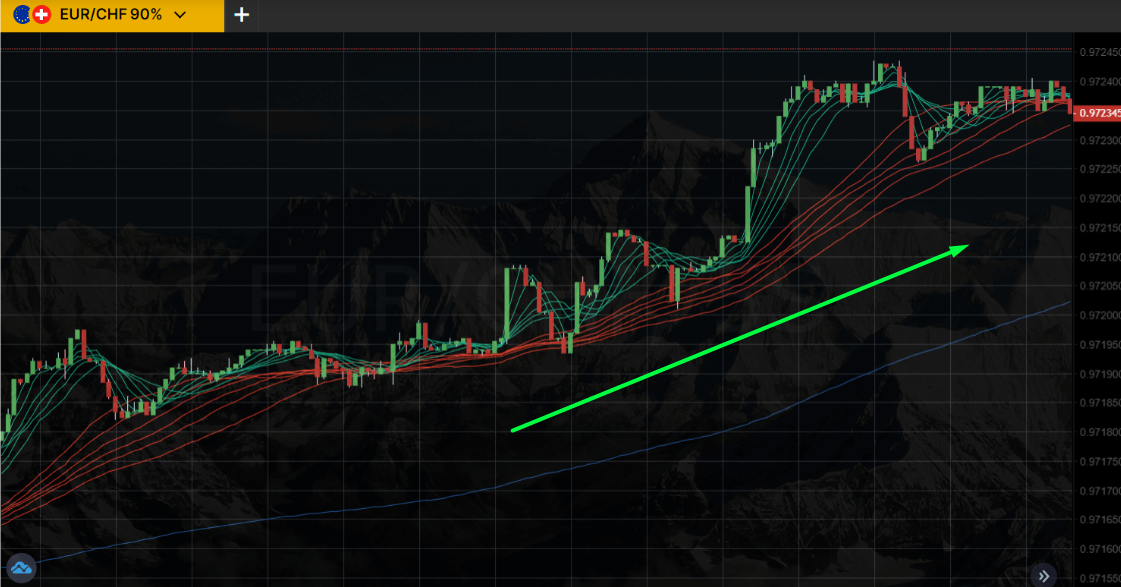
The distance between these two groups of lines is an indicator of the strength of the trend. The larger it is, the more confident the upward movement of the price. It is at this moment, when the green and red lines diverge, as if opening the way, that it is worth considering buying a CALL option (“Up”).
But be careful! The convergence of the lines, like a flock of fish off course, indicates the imminent end of the trend. Do not forget about the “aquarium day” – the bold MA 200 line, which should remain under the price chart throughout the entire uptrend.
3.We recognize a downtrend
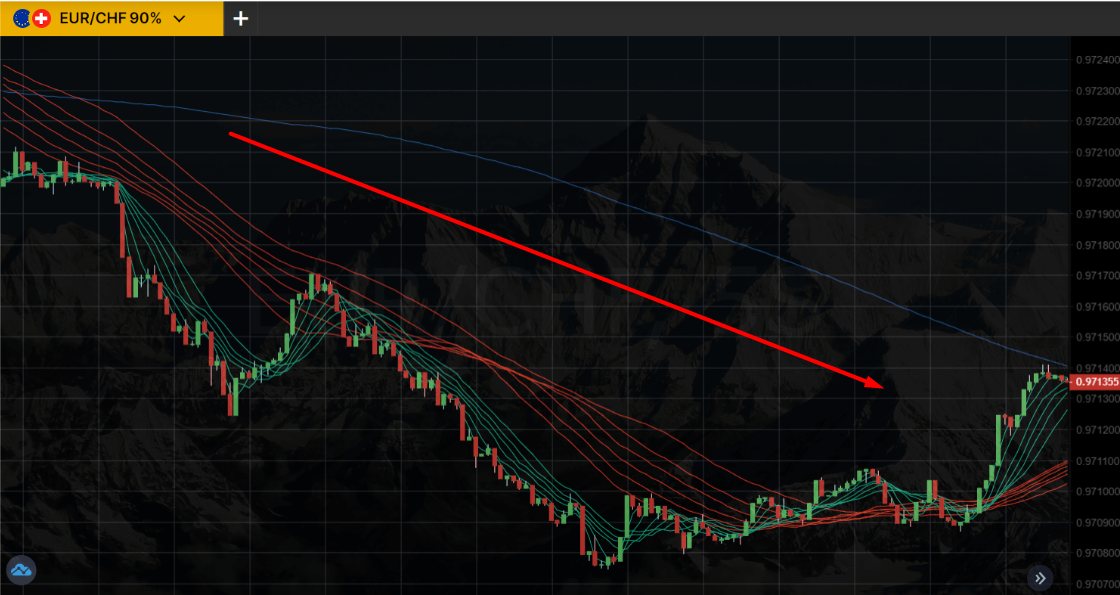
In a downtrend, the picture changes to the opposite. The red lines and the MA 200 are on top, and the green ones are at the bottom.
The convergence and mixing of the lines signal the end of the trend. Just as fish, having lost their direction, randomly rush around the aquarium, the market enters a phase of uncertainty.
Be patient and wait for a new clear picture to appear. The green and red lines should separate again, lined up in orderly rows, but this time the red ones will be located on top. This is a signal to action – you can consider a PUT option (“Down”).
4.Time frame
The Guppy strategy demonstrates the greatest effectiveness in short-term time intervals. The best option is to use a five-minute chart with a forecast of price movement for the next half hour.
It is also possible to use this strategy on minute charts with short-term options (2-3 minutes). However, it should be remembered that this approach is associated with increased risks and requires caution.
5.The pros and cons of the Guppy trading strategy
The Guppy strategy is a vivid representative of trending trading systems, attracting traders with its clarity and apparent simplicity. However, like any instrument, Guppy has its advantages and disadvantages, which are important to know before diving into the world of trading.
• The power of moving averages: The main advantage of Guppy is the effective use of moving averages (MA) to determine the trend. The variety of MA with different periods allows you to capture both short-term fluctuations and long-term trends. The MA 200 acts as a kind of beacon, clearly indicating the global trend.
• Flexibility and adaptability: Guppy is suitable for both short-term trading on minute charts and long-term strategies. By varying the distance between the moving averages, a trader can adapt the system to his style and investment horizon.
• Simplicity and accessibility: The Guppy strategy is easy to implement on almost any trading platform. Its principles are clear even to novice traders, which makes it attractive to a wide audience.
The pitfalls
Despite the obvious advantages, “Guppy" has its disadvantages. On minute charts, the signals can be confusing and contradictory, which makes it difficult to make decisions. For greater clarity, it is recommended to use graphs from 5 minutes and above.
It is important to understand that the “Guppy" is a tool, not a magic wand. To achieve success, you need practice, the ability to analyze the market and manage risks. Blindly following the signals can lead to losses.
Guppy is a powerful and flexible strategy that can bring excellent results when applied correctly. However, like any tool, it requires understanding, experience and discipline.