The 2023 Utility Decarbonization Index
 The 2023 Utility Decarbonization Index
This was originally posted on the Decarbonization Channel. Subscribe to the free mailing list to be the first to see graphics related to decarbonization with a focus on the U.S. energy sector.
Electric utilities and the power sector have a pivotal role to play in decarbonizing the U.S. economy, especially with the electrification of sectors such as transportation.
So, where do the country’s largest electricity producers stand on the path to decarbonization?
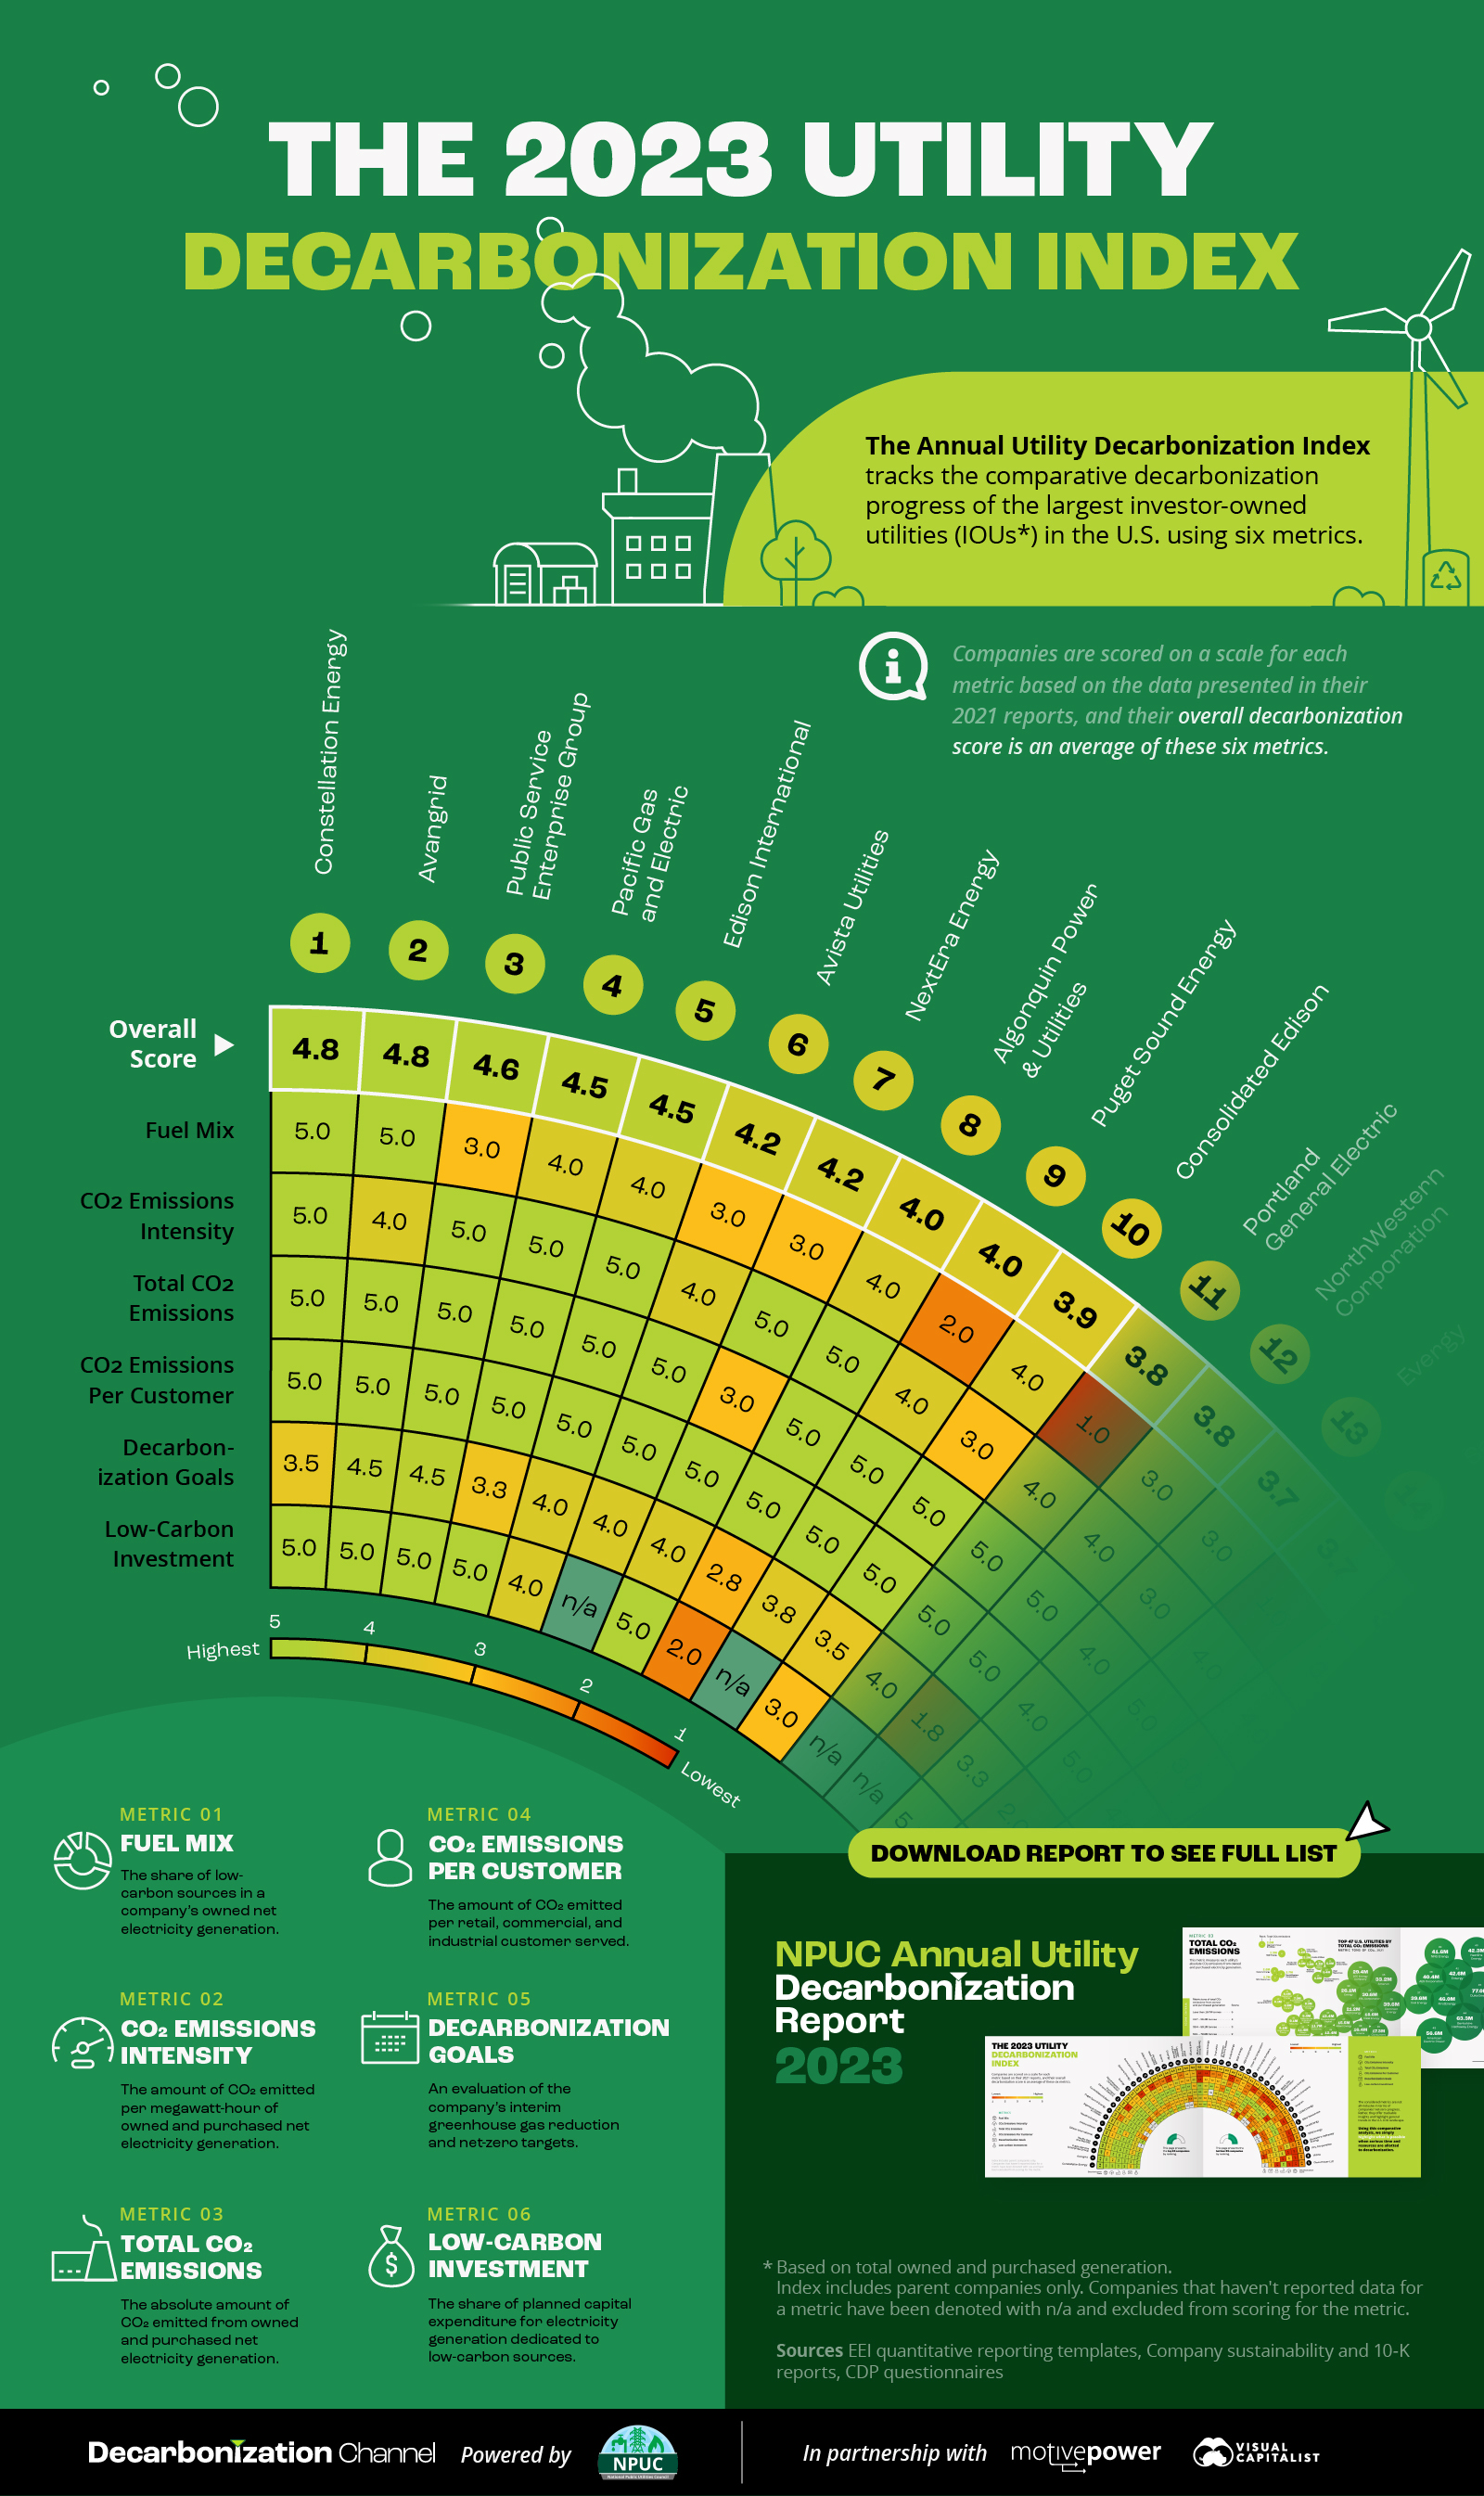
In collaboration with our sponsor National Public Utilities Council, we present the 2023 edition of our Annual Utility Decarbonization Index. The index uses 2021 data (the latest available at the time of data collection) to track the comparative decarbonization progress of the 47 largest investor-owned utilities (IOUs) in the United States.
In the graphic above, we give a preview of the top 10 rankers.
Methodology of the Utility Decarbonization IndexThe Utility Decarbonization Index uses the following six metrics to track decarbonization progress:
- Fuel Mix
The share of low-carbon sources in a utility’s owned net electricity generation. - CO2 Emissions Intensity
The amount of CO2 emitted per megawatt-hour of owned and purchased net electricity generation. - Total CO2 Emissions
The absolute amount of CO2 emitted from owned and purchased net electricity generation. - CO2 Emissions Per Customer
The amount of CO2 emitted per retail, commercial, and industrial customer served. - Decarbonization Goals
An evaluation of the company’s interim greenhouse gas reduction and net-zero targets, with a 50% reduction in emissions by 2030 and net-zero by 2050 as baseline targets. - Low-Carbon investment
The share of planned capital expenditure for electricity generation dedicated to low-carbon sources.
All 47 IOUs in the Decarbonization Index are scored on a scale of one (lowest) to five (highest) for each of the six metrics, indicating whether they are trailing or leading compared to their peers. A utility’s final decarbonization score is an average of its scores across the six metrics.
The data for these metrics comes from company sustainability reports, quantitative ESG reporting templates from the Edison Electric Institute, and the Climate Disclosure Project’s Climate Change Questionnaire filings.
With the methodology in mind, let’s take a look at the 10 utilities that are leading the ranking in this year’s Utility Decarbonization Index.
Enjoying this content? Dive into the full ranking in the Annual Utility Decarbonization Report 2023: The Annual Utility Decarbonization Index 2023
The 47 IOUs ranked in the Index are the largest electricity producers in the country, together representing over 58% of U.S. electricity generation in 2021 and serving 68% of all US. electric customers. Therefore, the decarbonization of these utilities can have a massive impact on the power sector and other electricity-consuming sectors.
However, it’s important to note that a score of five on the Utility Decarbonization Index does not indicate full decarbonization or net-zero emissions. Rather, it indicates that the utility is leading in decarbonization relative to its peers.
Here are the top 10 IOUs in this year’s ranking:

Constellation Energy, a newly formed subsidiary of Exelon, tops this year’s Decarbonization Index along with Avangrid. Constellation is the largest low-carbon electricity producer among the 47 IOUs, with 80% of its owned net electricity generation coming from nuclear power plants. The company also had the lowest CO2 emissions intensity of all utilities in the Index.
Avangrid, a clean energy-focused utility operating in the Northeast, ties for first place thanks to its low-carbon fuel mix and ambitious decarbonization targets to achieve carbon neutrality in Scope 1 and 2 emissions by 2030.
Download the 2023 Annual Utility Decarbonization ReportAre you interested in seeing the rest of the rankings? Check out the full report!
In addition to the Decarbonization Index, there’s much more to unpack, including:
- Six reasons why utilities must decarbonize
- Highlights and challenges to decarbonization from 2021–2022
- The data behind the six individual metrics
- The U.S. Utilities ESG report card
- Decarbonization strategies for U.S. utilities
Download the 2023 NPUC Annual Utility Decarbonization Report and find out everything you need to know about utility decarbonization.
The post The 2023 Utility Decarbonization Index appeared first on Visual Capitalist.