The 2020 Election fraud explained with math
@TheGrayHourHere is just the short list.
- Fairfax Virginia has switched 100,000 votes from Trump to Biden stating a “clerical error”
- Wisconsin suddenly discovers over 112k Biden ballots between 3:30 am and 4:30 am
- Nevada has decided they won’t have all vote counts in until Thursday
- Michigan h@Statsguyphd Twitter thread - https://archive.is/9tWLK has gained 138.339 ballots for Biden since they stopped counting last night. A whopping zero for Trump
- 6 states trump has sizable leads, all six states decided to stop counting ballots on election night (unheard of) and they all have blue strong holds
- Jack from Twitter deletes the current sitting presidents tweet on election night. Glaringly obvious election interference
- LeeJoe, who was running for district 16 senate seat in Idaho and stated so on his account profile, gets his account deleted from Facebook not once but twice. Another example of a glaringly obvious election interference.
- North Carolina has 100% of precincts counted with Trump in the clear lead and it’s not being called.
-H9K | https://www.disclose.tv/t/we-are-literally-watching-a-coup-heres-the-evidence/6806/35
Benford's Law
Wikipedia: "Benford's law, also called the Newcomb–Benford law, the law of anomalous numbers, or the first-digit law, is an observation about the frequency distribution of leading digits in many real-life sets of numerical data. The law states that in many naturally occurring collections of numbers, the leading digit is likely to be small.[1] For example, in sets that obey the law, the number 1 appears as the leading significant digit about 30% of the time, while 9 appears as the leading significant digit less than 5% of the time. If the digits were distributed uniformly, they would each occur about 11.1% of the time.[2] Benford's law also makes predictions about the distribution of second digits, third digits, digit combinations, and so on.
The graph to the right shows Benford's law for base 10, one of infinitely many cases of a generalized law regarding numbers expressed in arbitrary (integer) bases, which rules out the possibility that the phenomenon might be an artifact of the base 10 number system. Further generalizations were published by Hill in 1995 [3] including analogous statements for both the nth leading digit as well as the joint distribution of the leading n digits, the latter of which leads to a corollary wherein the significant digits are shown to be a statistically dependent quantity."
@Statsguyphd Twitter thread - https://archive.is/9tWLK
I am making these tweets to explain in one place some analysis that was done last night.
1 - I was asked offline about doing Benford's on election data. I explained that this is common and a useful way to detect anomalies in data that are driven by artificial process (e.g. fraud)
2 - My student then pointed me towards a tweet that was exploring this type of analysis (but they hadn't done Benford's). So I chimed in.
3 - However, I did not know what data they used so I found a source for the context they referenced. However, I could not initially find write-ins versus non-write-ins, so I looked at candidate counts.
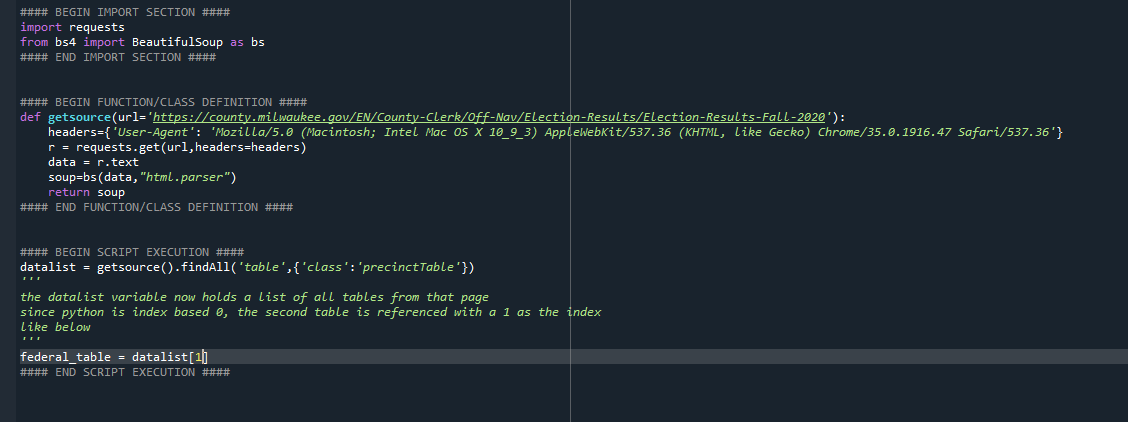
4 - I then wrote a quick script to gather that data, here is an example of what the data gathering portion of this process looked like.
5 - With this data now available to look at in code, I created a process to analyze first digit conformity to the Benford12 - And here are the raw numbers (1 to 9):
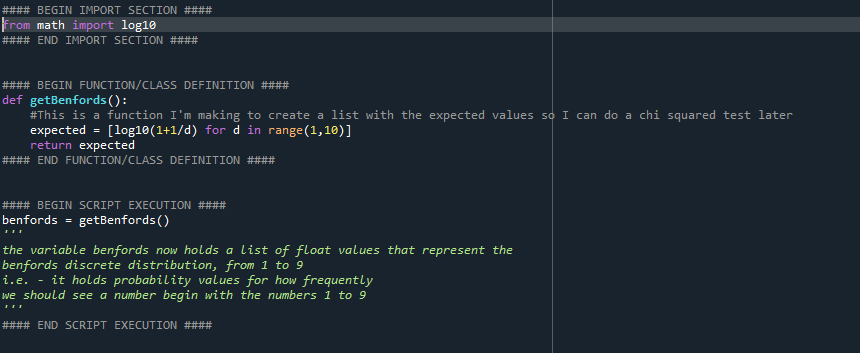
6 - I wrote the code to produce the Benford's discrete distribution. This code looks like this
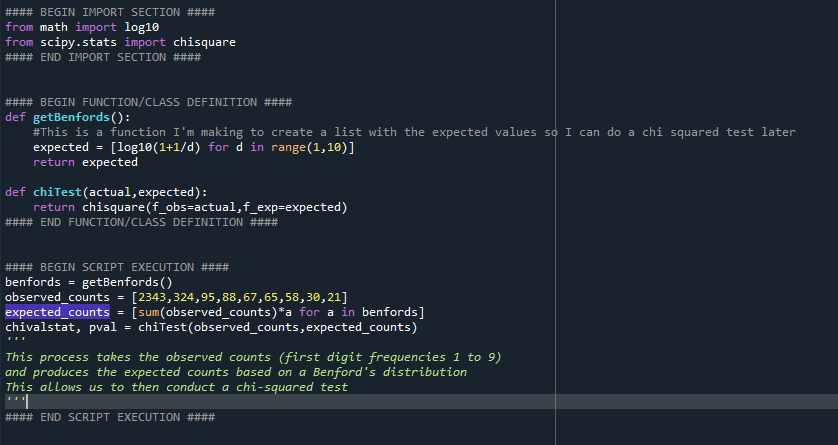
7 - Now that I had the data and the distribution, I simply needed to perform the test. To do that, I leveraged scipy's chisquare. However, prior to doing that, you need to produce the expected result values (not just the percentages. But this is as simple.
8 - To do that, you take the total number of observations (number of numbers that the first digit counts are derived from) and multiply them by the Benford's distribution frequencies accordingly. This looks like this:
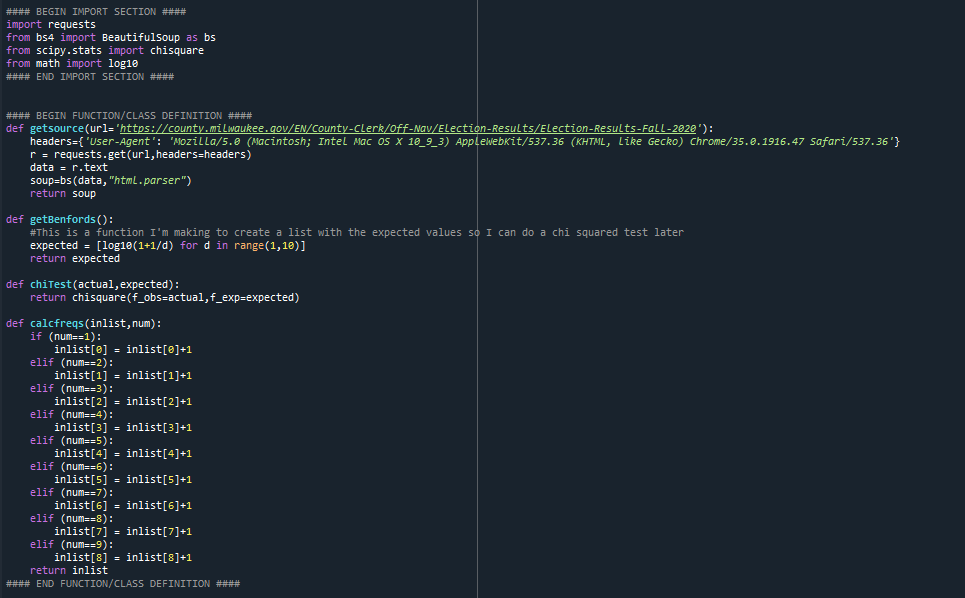
9 - The final process, put together, has some additional code to handle data and count the digits from that webpage (comes in 2 parts, first script setup and function definition, then the script on next tweet):
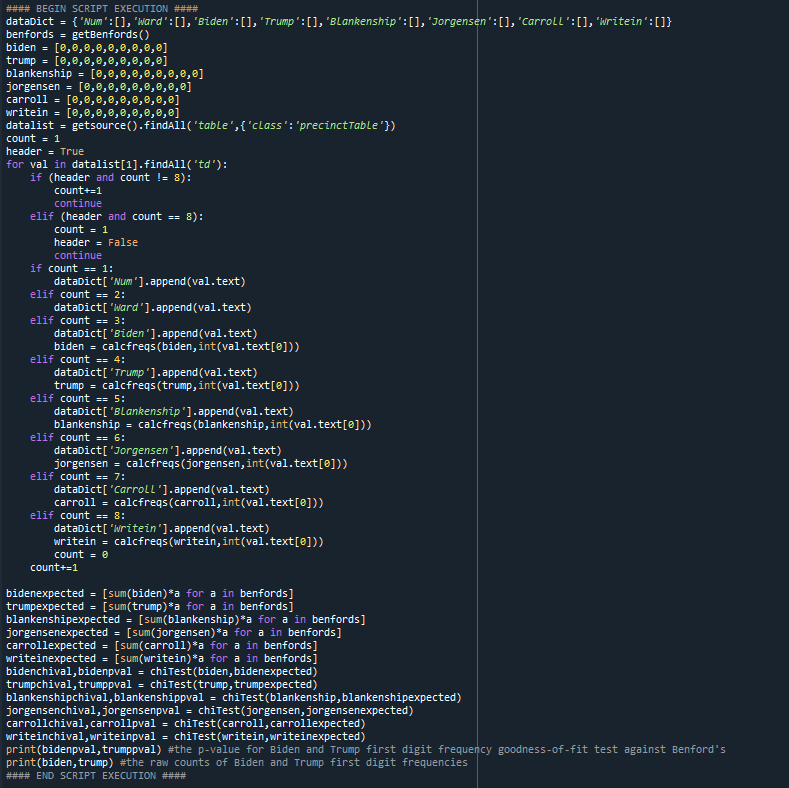
10 - And the rest of that script:
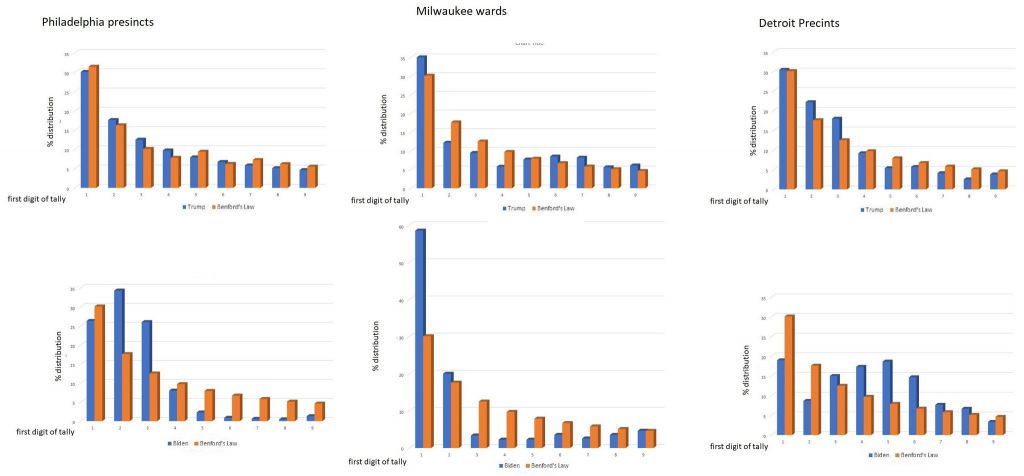
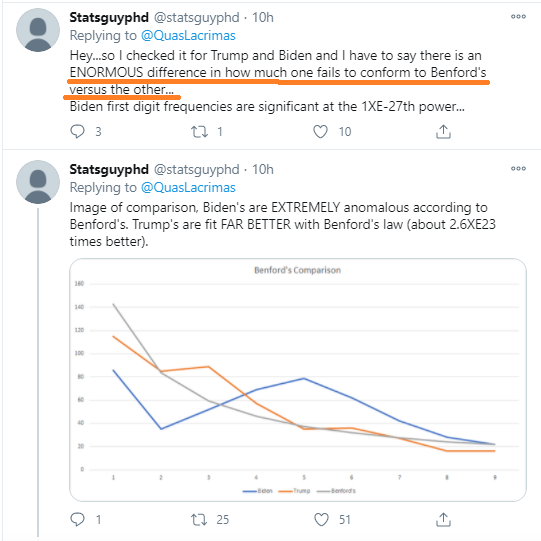
11 - In the end, Biden's vote data from that page is far more anomalous than Trump's. Here is what it looks like visually:
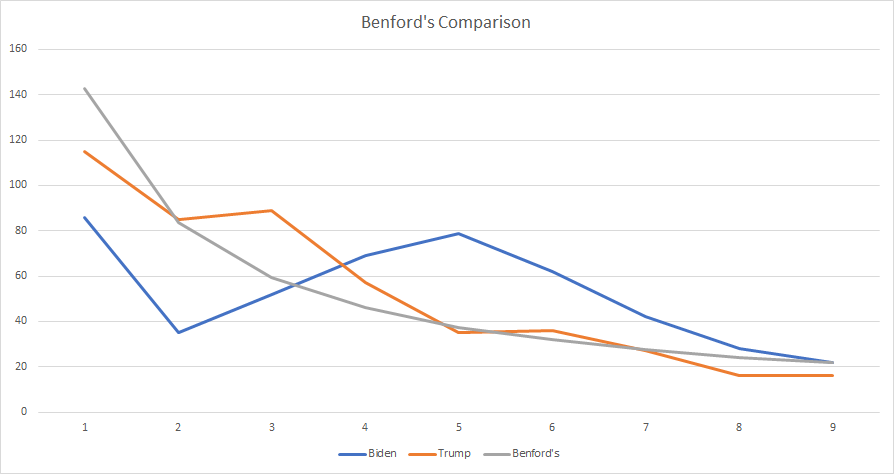
12 - And here are the raw numbers (1 to 9):
Biden: [86, 35, 52, 69, 79, 62, 42, 28, 22]
Trump: [115, 85, 89, 57, 35, 36, 27, 16, 16]
13 - Here are the respective p-values:
Biden 1.5076774999383611e-27
Trump 0.00048111250713426005
14 - What is notable is the extreme difference in their p-values. The drawback to this analysis is that there is a Better test for Benford's goodness of fit. It is the Watson version of the Cramer von Mises test (U2). You can read about why it is better here (next message)
15 - Here:
Lesperance, M., Reed, W. J., Stephens, M. A., Tsao, C., & Wilton, B. (2016). Assessing Conformance with Benford’s Law: Goodness-Of-Fit Tests and Simultaneous Confidence Intervals. PLoS ONE, 11(3). doi.org/10.1371/journa…
16 - What is undeniable is that the first digit frequencies of Biden's vote totals is extremely anomalous in comparison to Trump's.