TON mainnet shard-processing incident: empty blocks over pending work
TON DevelopersIndependent technical incident report · 13 July 2026 · All times UTC
On 13 July 2026, TON mainnet experienced a severe shard-processing slowdown during and after a planned TON Core PUB5 jetton-transfer load test. The basechain expanded from one shard to a sampled maximum of 13 active shards. The topology reacted to pressure, but progress became uneven: some shards continued to finalize blocks, many of them empty, while older messages remained unprocessed and other active shards showed long gaps.
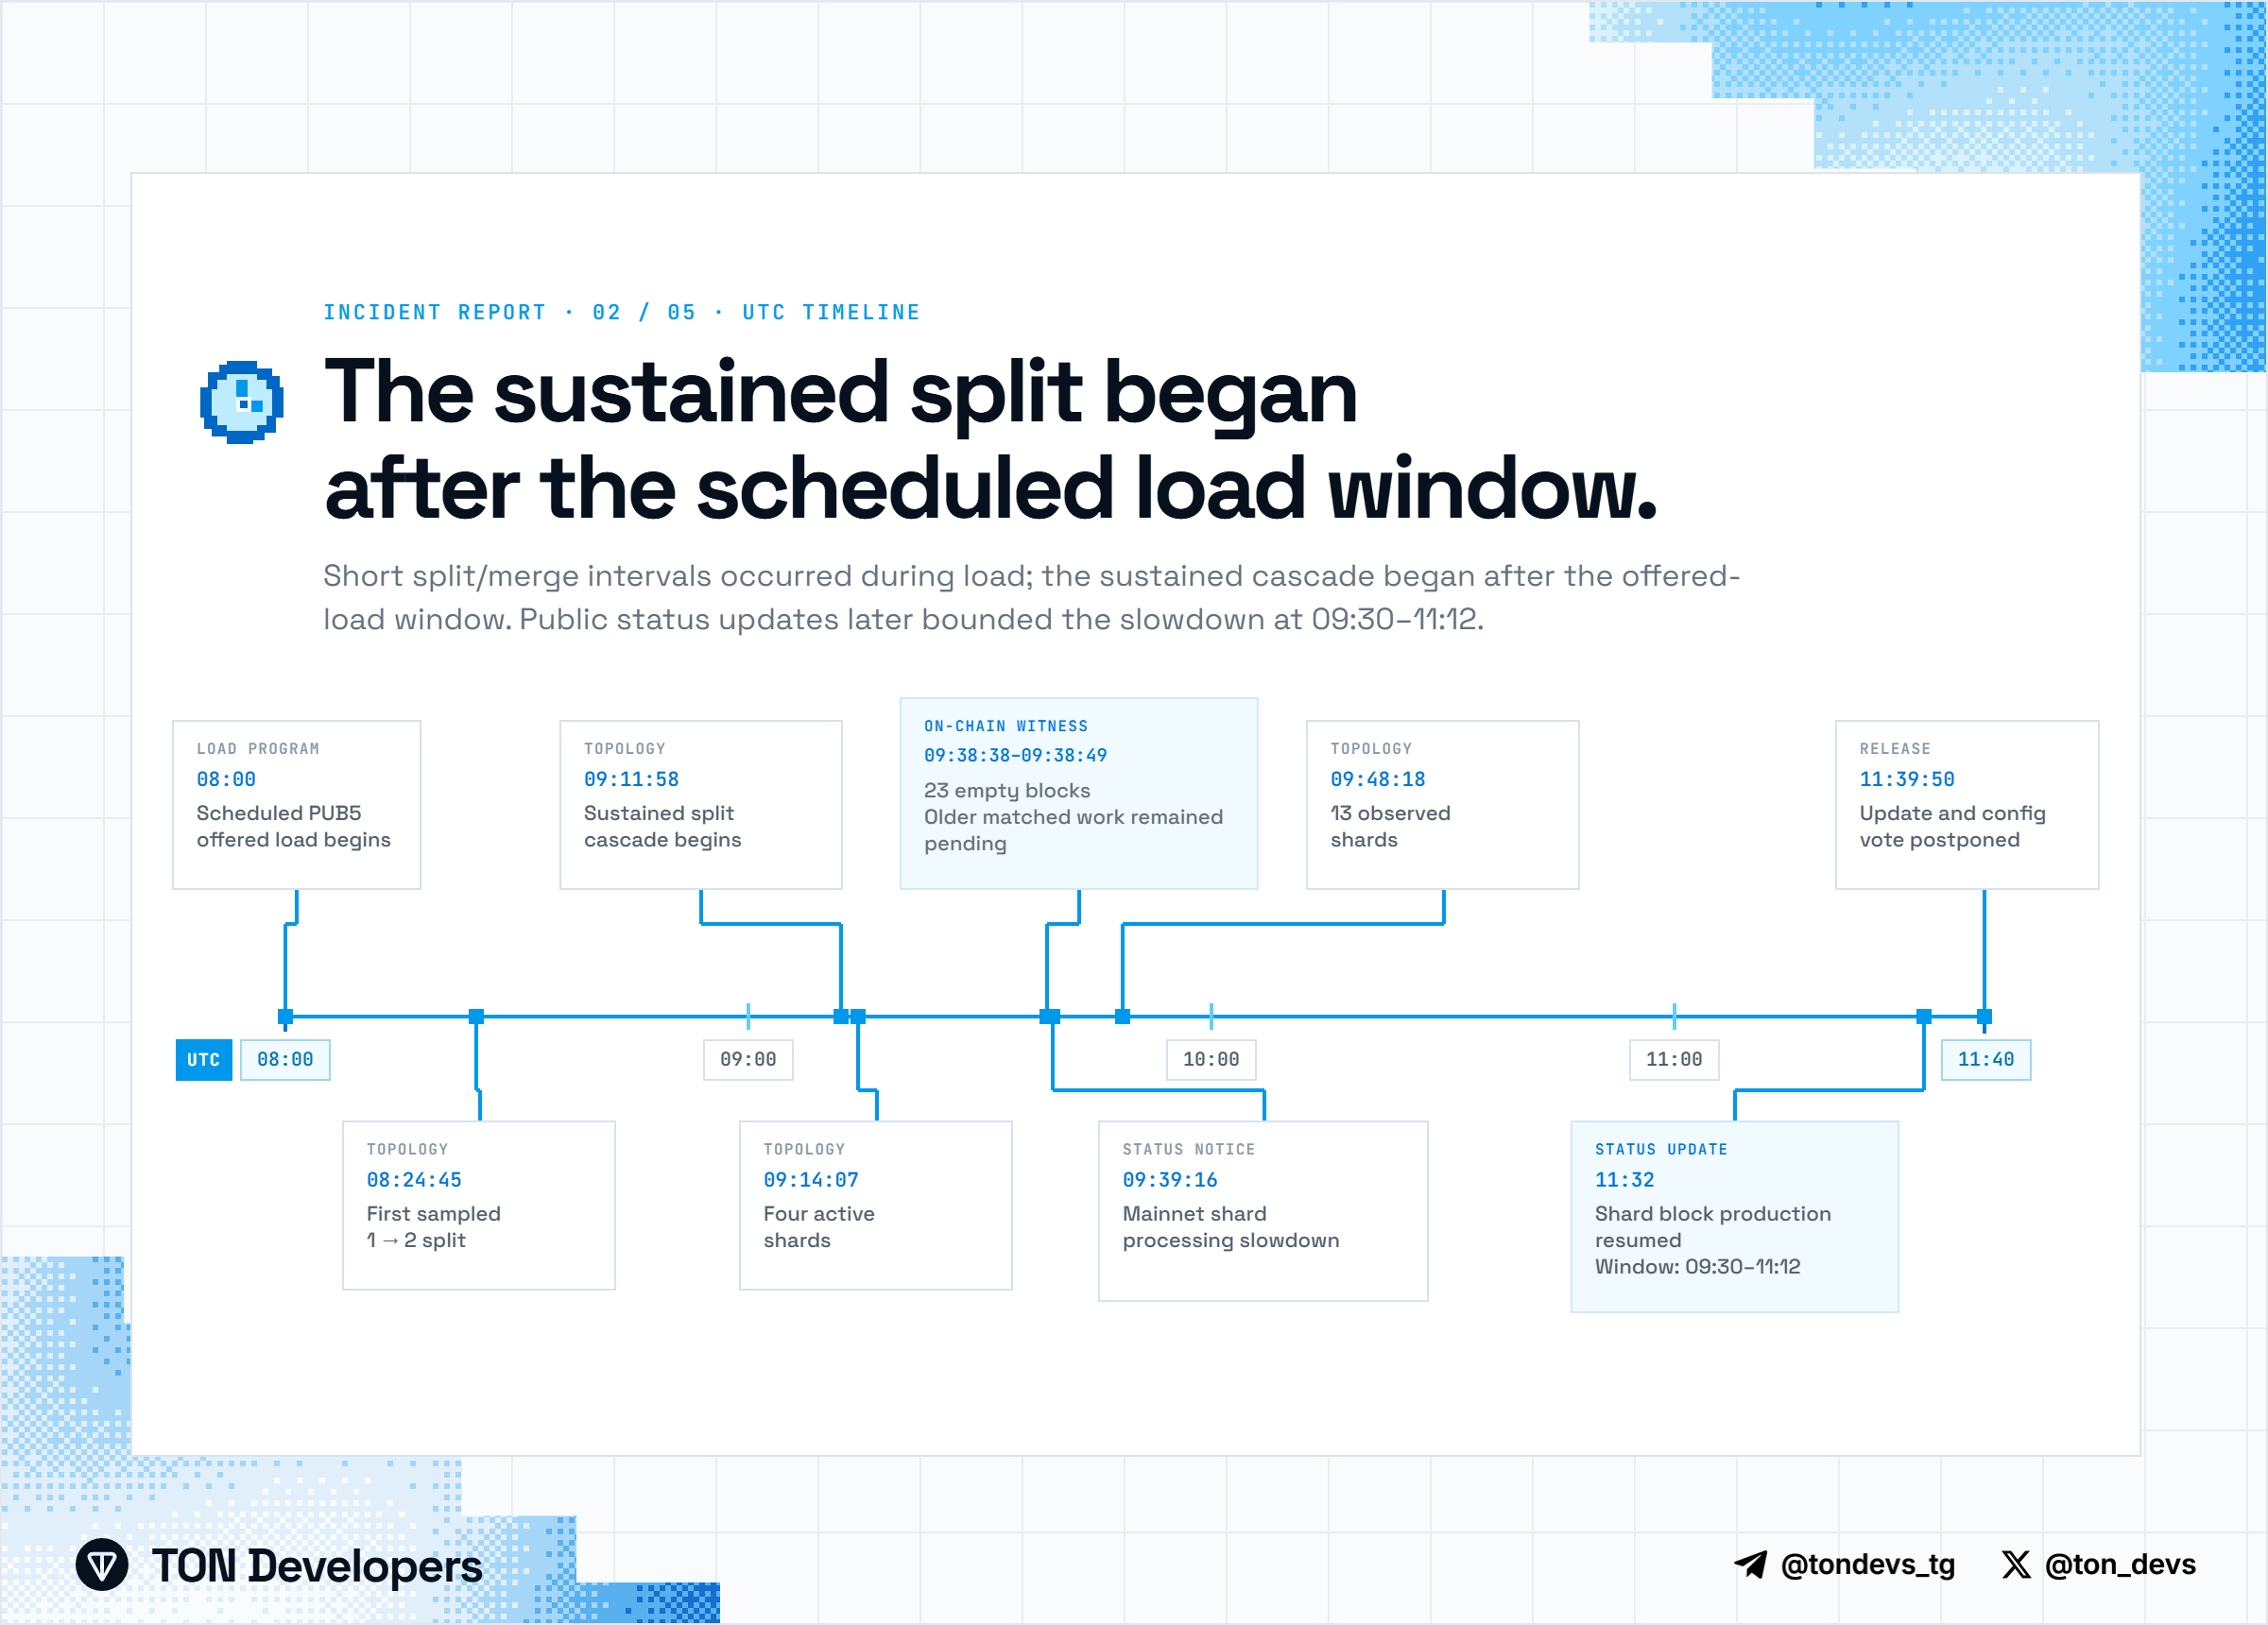
TON Status reported the slowdown at 09:39. At 11:32, a second update reported that shard-chain block production had resumed and bounded the slowdown at approximately 09:30-11:12. At 11:39, the scheduled software update and a configuration vote were postponed.
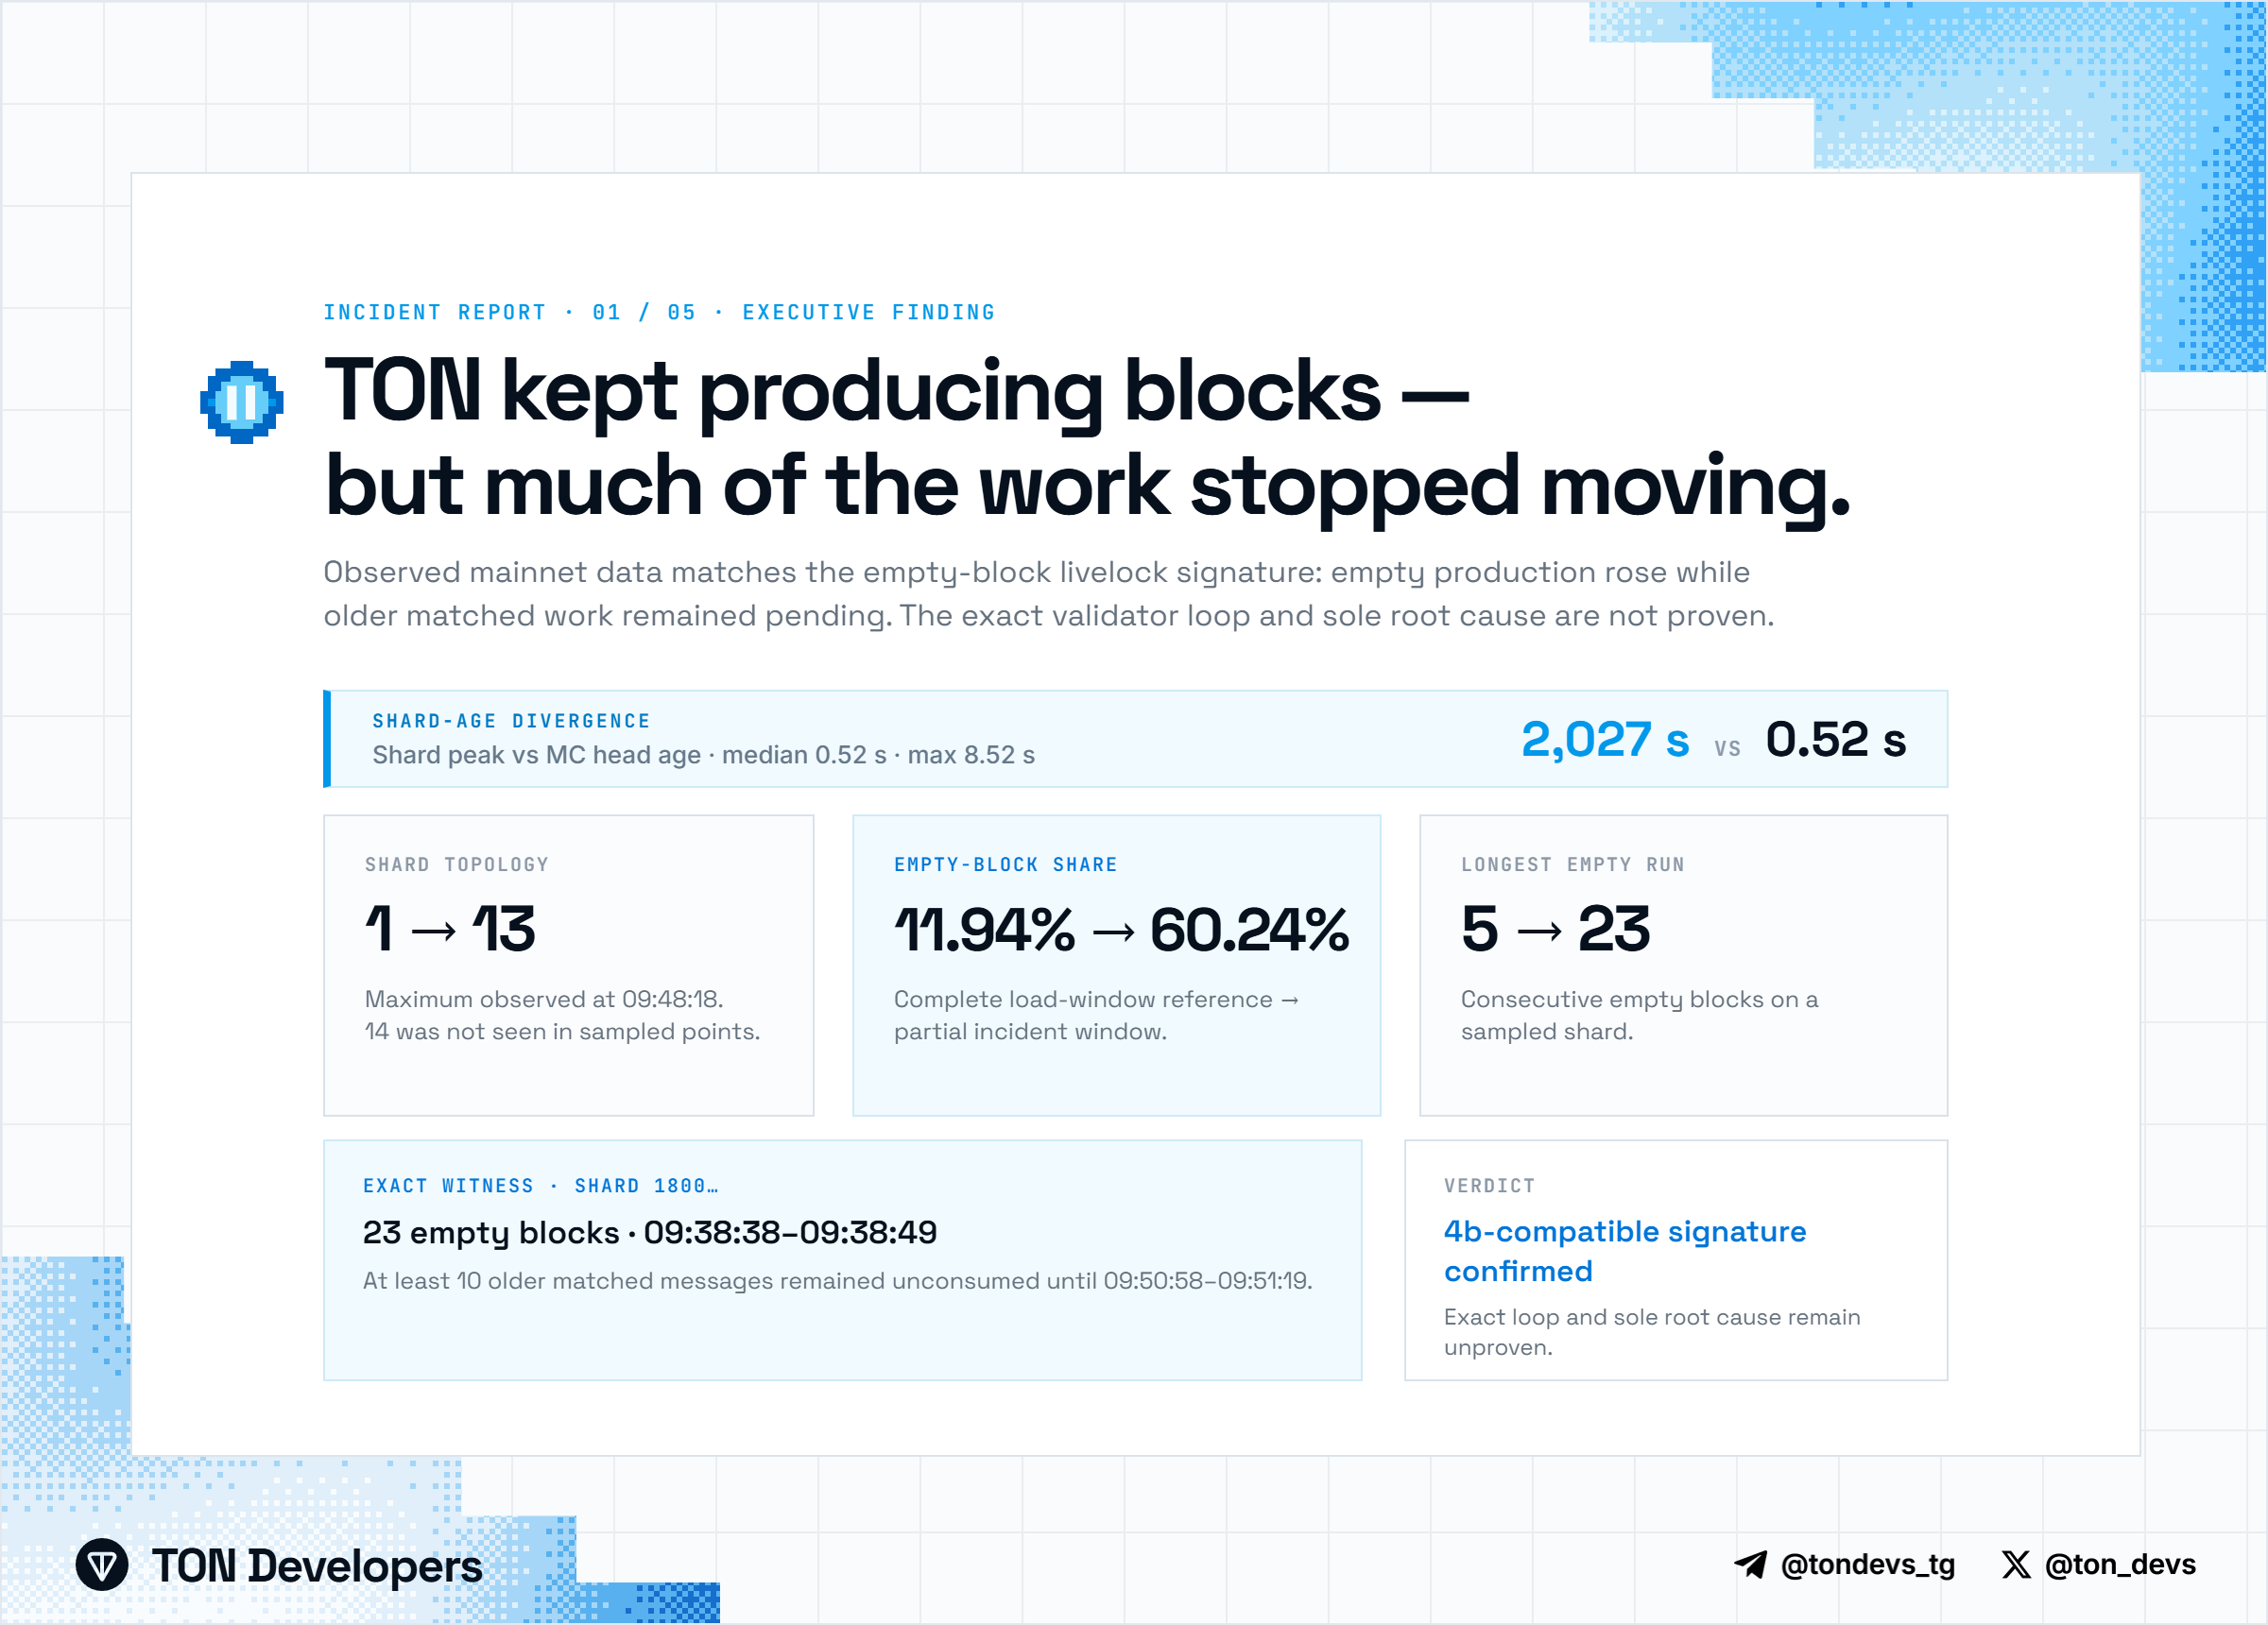
Assessment: the retained history matches a known empty-block livelock class documented as "Bug 4b": internal-queue work can exhaust the next collation deadline and repeat empty fallback blocks without draining the queue. Mainnet reproduced that observable signature; the exact internal loop and sole cause remain unproven.
Summary
- Impact. Message processing slowed from seconds to minutes. In the partial degraded sample, cross-shard message-hop latency reached p95 20 min 58 s and p99 30 min 58 s. Same-shard messages also developed minute-scale tails.
- Shard divergence. In the retained topology-and-telemetry data through 10:43, after excluding one short interval affected by a local node stall, the oldest active shard reached 2,027 s of age while masterchain head age remained at a 0.52 s median and 8.52 s maximum.
- Topology. The first short one-to-two split was sampled at 08:24:45. The sustained split cascade began at 09:11:58, after the planned TON Core 08:00-09:00 offered-load window, and reached 13 observed shards at 09:48:18.
- Failure mode. Empty-block share rose from 11.94% in the complete retained reference to 60.24% in the partial incident extraction. Median transactions per block fell from 20 to zero.
- Exact witness. One shard finalized 23 consecutive empty blocks from 09:38:38 through 09:38:49 while at least ten older matched same-shard messages remained unconsumed until 09:50:58-09:51:19.
- Root-cause confidence. Empty-block production over known pending work is confirmed. The exact validator queue state, candidate deadline path and consensus contribution remain unresolved because validator-private traces were not available.
Impact
This was not a clean network-wide halt. In the retained topology-and-telemetry data through 10:43, after excluding one short interval affected by a local node stall, the oldest active shard reached 2,027 seconds of age while masterchain head age had a 0.52-second median and an 8.52-second maximum. The partial on-chain extraction independently showed active-shard timestamp gaps up to 507 seconds. Together, these measurements establish severe divergence in shard-chain progress while masterchain head age stayed low; the observed apply deficit was zero at the shard-age peak. They do not identify whether collation, candidate loss, validator-group behavior or consensus timing supplied the exact mechanism.
The user-visible consequence was delayed message execution. A matched internal message that normally crossed between two shards in a few seconds could take tens of minutes during the degraded period. This report does not make claims about fund safety, rollback behavior or transaction loss beyond the evidence available in the decoded archive and public status updates.
Timeline
08:00- planned TON Core PUB5 offered load begins.08:24:45- first sampled one-to-two split; the topology later merges back to one.09:11:58- sustained split cascade begins.09:14:07- four active basechain shards are visible.09:38:38-09:38:49- exact 23-empty-block witness.09:39:16- TON Status reports a mainnet shard-processing slowdown.09:48:18- sampled maximum of 13 active shards.09:54:39- the observed shard count begins to fall.10:15:52- the count remains ten while one sibling pair merges and another shard splits into two: a topology replacement hidden by count-only charts.11:32- TON Status reports shard-chain block production resumed and identifies the affected window as approximately 09:30-11:12.11:39:50- the July 13 update and July 15 configuration vote are postponed.
What happened
Source. The supplied account of the TON Core test describes an overnight PUB5 deployment, preparation of roughly 5,000 target wallets and mass transfers scheduled for 08:00-09:00. It also supplies the exact PUB5 master address.
On-chain corroboration. The traffic was broadly distributed rather than concentrated on one contract. Of 313,800 outbound internal messages with a decodable opcode, 89.34% followed the standard jetton_transfer → internal_transfer → excesses sequence. The retained archive contains 92,860 internal_transfer messages from 7,665 jetton-wallet contracts. The largest route accounted for 0.10% of those messages, the top ten for 0.55%, and the busiest basechain account for 0.63% of transactions. A deterministic message-weighted sample mapped 186 of 200 points to the exact supplied PUB5 master; because that mapping used post-incident account state, it is secondary validation rather than a historical census.
Pressure was already high before the first split. During 08:20-08:25, 735 basechain blocks contained 79,588 transactions; p95 archived raw BOC size reached 1,101,018 bytes, p95 gas used reached 1,590,846, and 223 blocks carried want_split. The configured basechain gas soft limit was 10,000,000, so p95 gas used was about 15.9% of that value, while p95 raw BOC size was slightly above the 1,048,576-byte soft limit. However, archived raw BOC length is not the collator's estimate_block_size() value, so this does not prove that the byte classifier triggered the split. TON does not split at a single TPS threshold: the collator combines estimated byte, gas, logical-time, collated-data and queue-pressure signals, then applies a weighted history before scheduling a split. The exact pressure axis remains unknown. The relevant paths are visible in the pinned source for load classification and split scheduling.
The first three two-shard intervals were short and ended in merges. The sustained expansion was different: two shards became four by 09:14:07, twelve by 09:37:03 and 13 by 09:48:18. The cascade took 36 minutes 20 seconds from its start at 09:11:58 to the sampled maximum, and it began 11 minutes 58 seconds after the planned offered-load window ended. ConfigParam 12 set max_split=4, permitting up to 16 leaves at full depth; the sampled maximum of 13 therefore was not the configured split ceiling.
At 10:15:52, the observed count stayed at ten while sibling shards 2800… and 3800… merged into 3000… and e000… split into d000… and f000…. TON evaluates leaves independently, so simultaneous opposite transitions are not by themselves evidence of faulty control logic. The event does show that a shard-count-only chart hides continuing topology adjustment. Horizontal scaling occurred, but useful work did not remain evenly distributed across the new topology.
Evidence of the failure mode
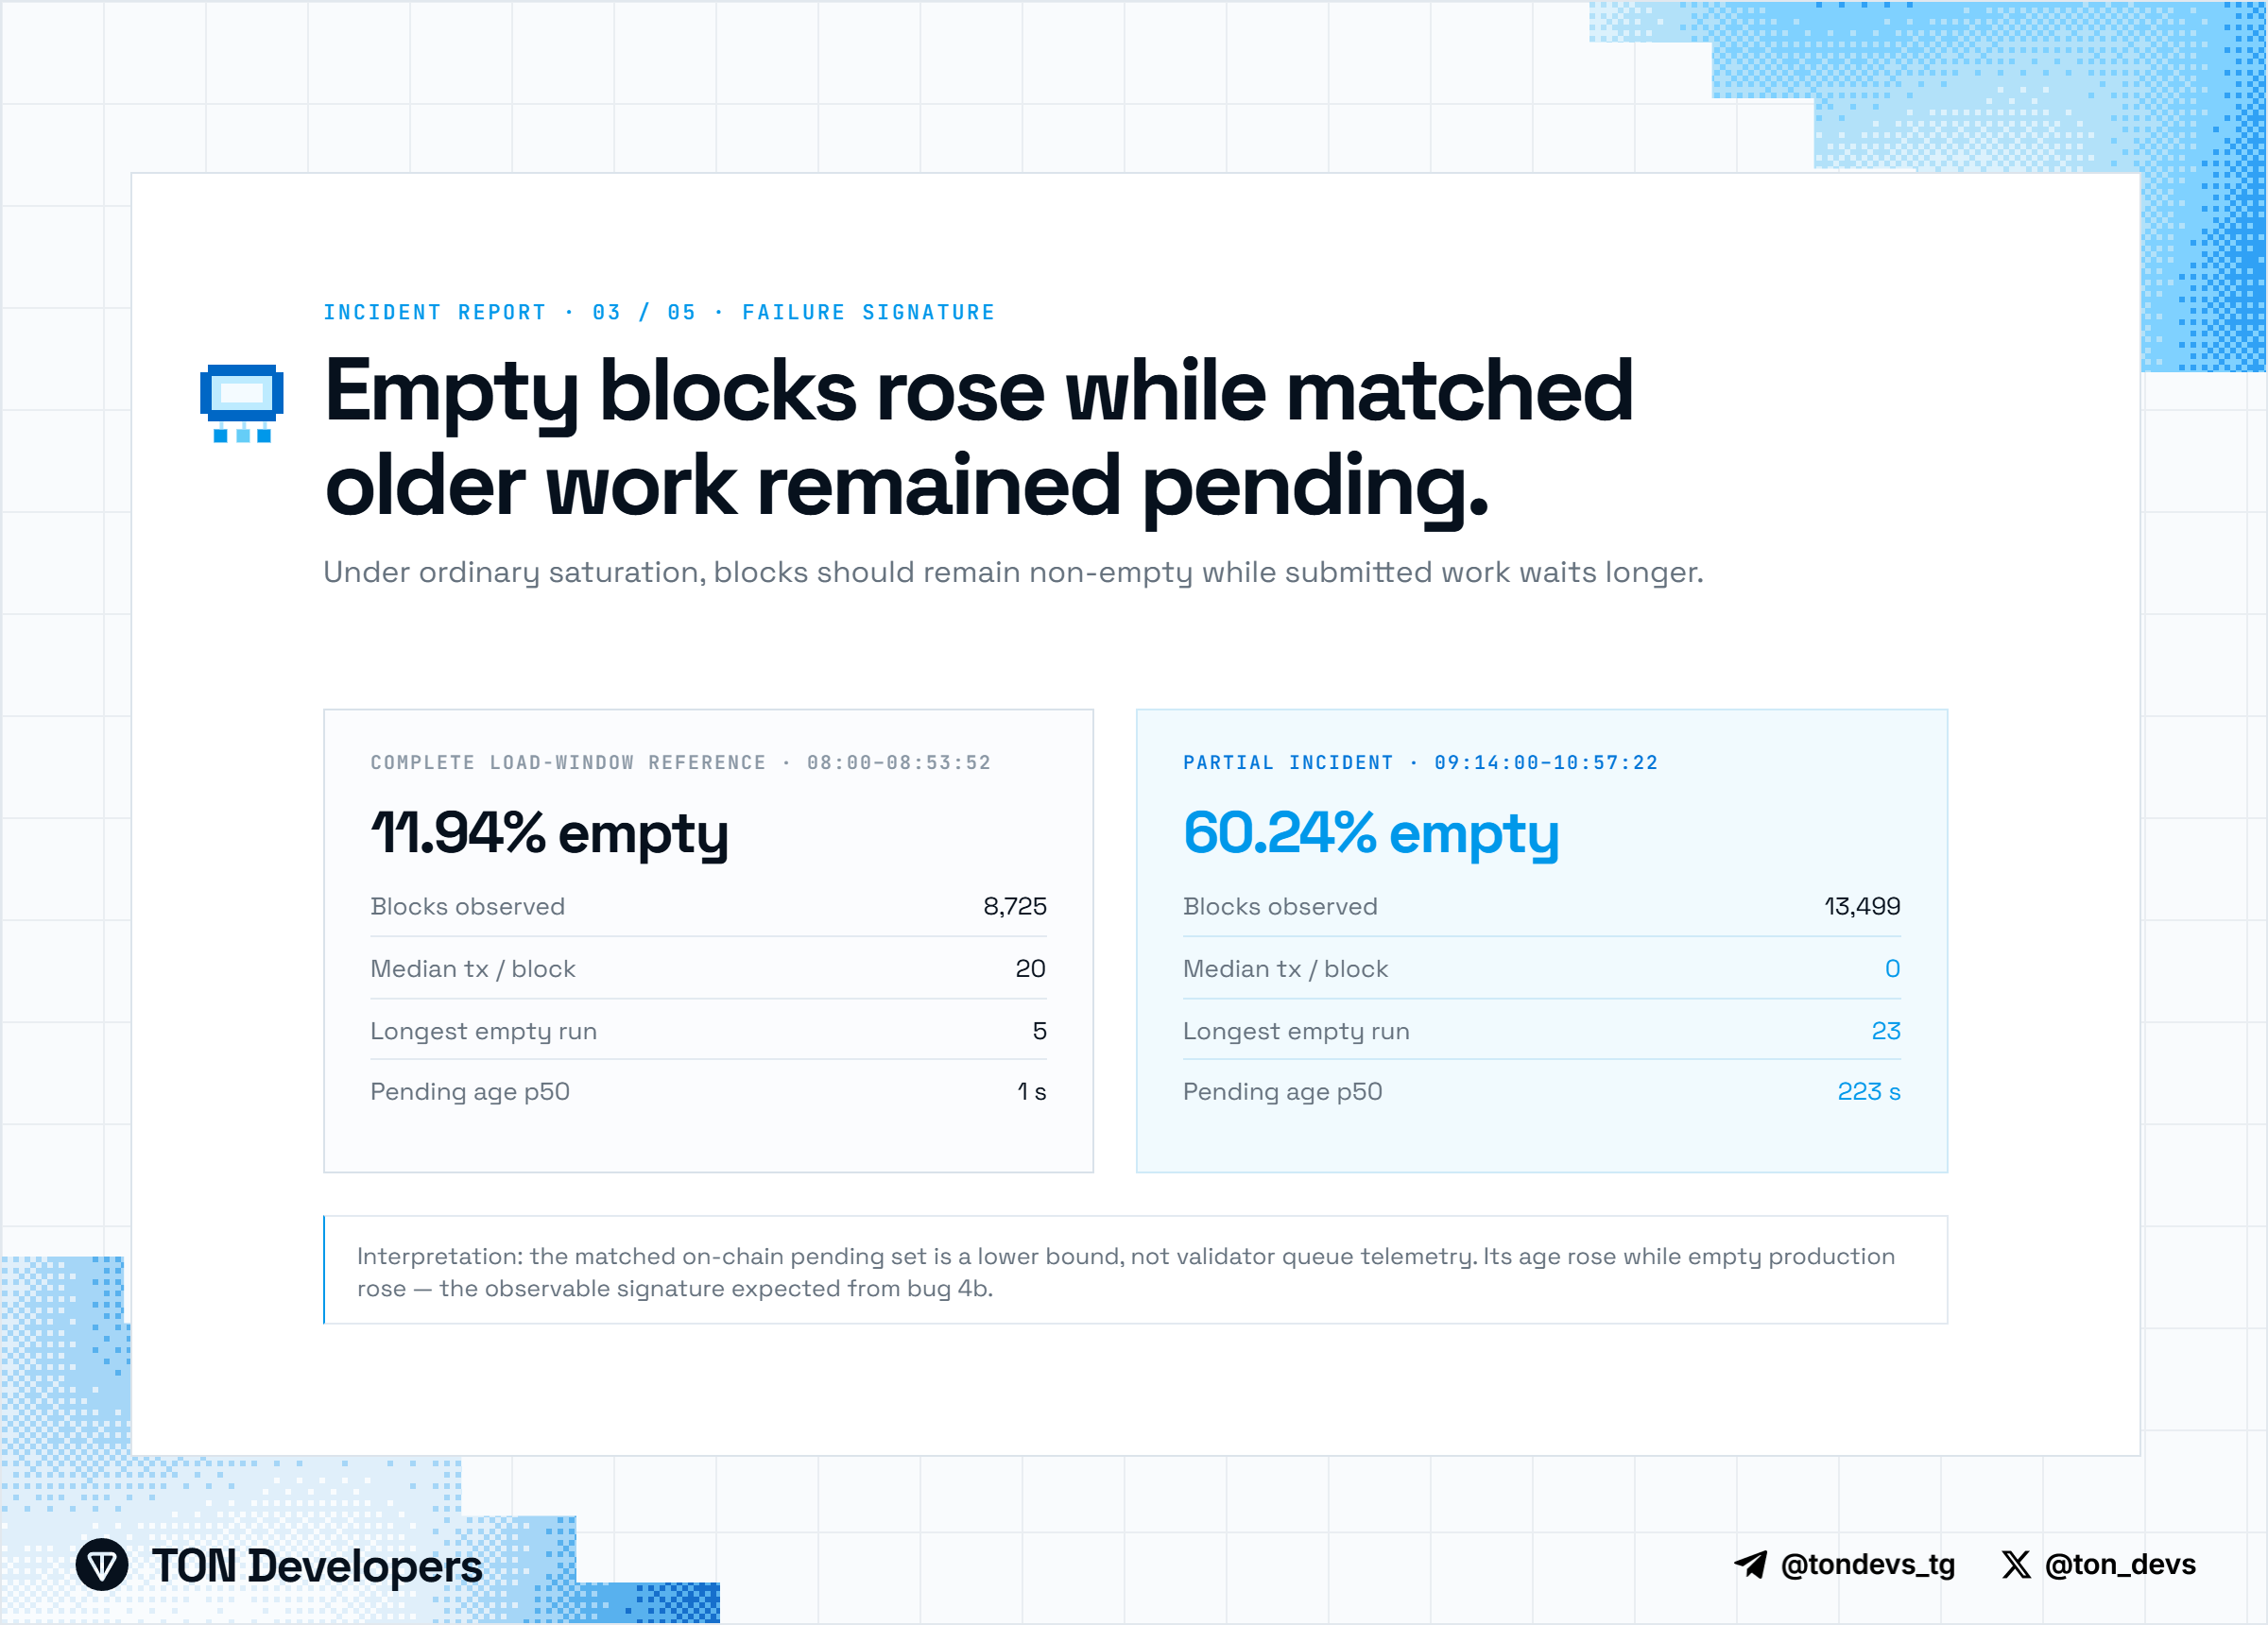
Normal saturation should preserve non-empty block production while submitted work waits longer. The retained incident data shows a different state:
- empty-block share: 11.94% in the complete 08:00:00-08:53:52 reference versus 60.24% in the partial 09:14:00-10:57:22 incident extraction;
- blocks with one or fewer transactions: 14.51% versus 76.24%;
- median transactions per block: 20 versus 0;
- p95 gas used per block: 747,488 versus 81,853, about 9.1 times lower during the incident sample;
- longest consecutive empty run: 5 versus 23;
- p50 age of the oldest known pending message at qualifying empty blocks: 1 s versus 223 s.
"Known pending" is deliberately narrow. It means a same-shard internal message whose source transaction was finalized before an empty block and whose destination transaction was finalized after it. It is a matched on-chain lower bound, not a reconstruction of the validator's full inbound or dispatch queue.
Causal assessment: what "Bug 4b" means
The name comes from the robustness section of DanShaders' TON benchmark. It describes a livelock, not a generic capacity limit. In the remaining laboratory case, one large block admits roughly 870 external messages and creates about 1,740 deferred internal messages. The next collation spends its time processing the inbound-internal or dispatch queue, misses its candidate deadline, emits an empty fallback block, and repeats because the queue is still present.
The benchmark observed that remaining instance with RAM-resident state and raised "unleashed" limits. Mainnet conditions were not identical. The mechanism is relevant because an unbounded loop can fail under any environment that drives it past the deadline; the laboratory result alone is not proof that this happened on mainnet.
Mainnet did reproduce the class signature at the block and message level: blocks continued, many were empty, and older known-pending same-shard work crossed an exact empty run before later consumption. That evidence is inconsistent with benign saturation as a complete explanation for the exact witness. It does not identify the exact internal loop or exclude coupled collator, validator-group or consensus effects.
Root-cause grade: strong corroboration of a Bug 4b-compatible livelock class; mechanistic proof and sole causality remain open.
Message latency
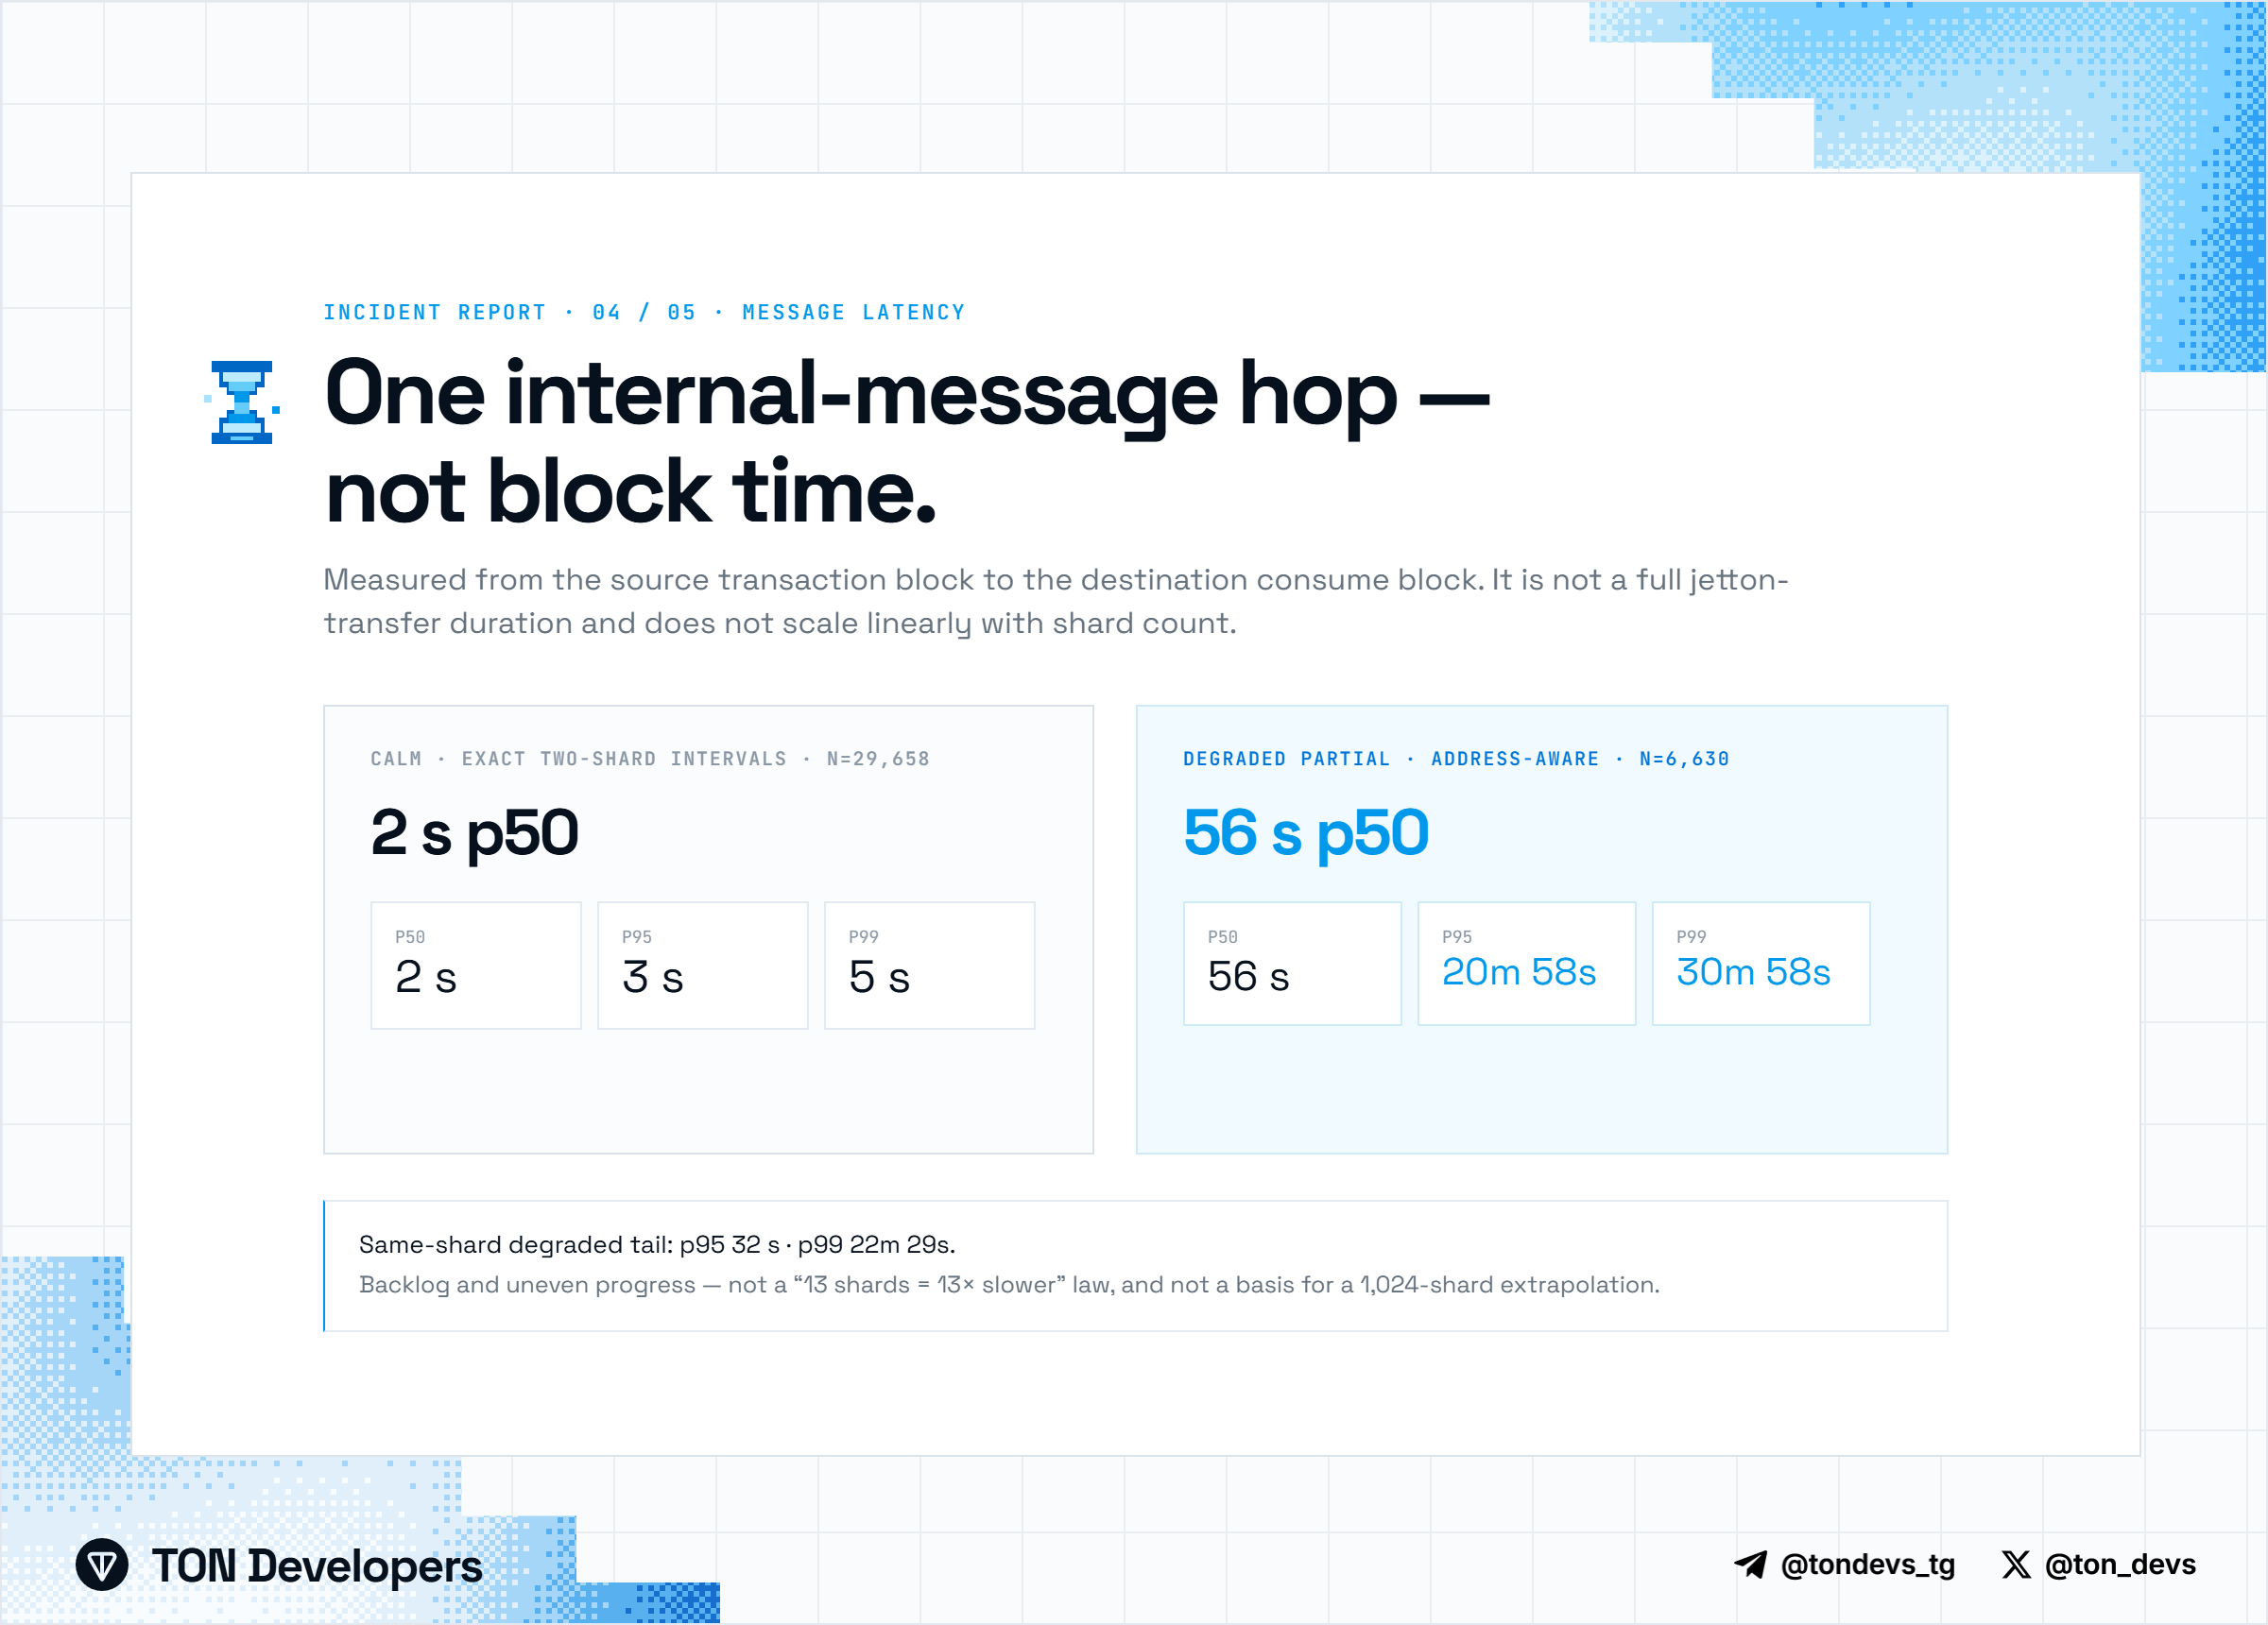
The latency measurement is one internal-message hop: from the timestamp of the source transaction block to the timestamp of the consuming destination transaction block. It is not block time, wallet confirmation time or the duration of a complete jetton transfer.
Across three exact healthy two-shard intervals, 29,658 cross-shard messages measured p50 2 s, p95 3 s and p99 5 s. In the partial degraded address-aware sample, 6,630 cross-shard messages measured p50 56 s, p95 20 min 58 s and p99 30 min 58 s. Same-shard messages also reached p95 32 s and p99 22 min 29 s.
The minute-scale tail appeared inside a shard as well as across shards, so it cannot be explained by the ordinary cost of an additional masterchain routing hop. It is consistent with stalled or heavily backlogged shard chains during a changing topology. It is not evidence that 13 shards are a fixed multiple slower than two, and it cannot be extrapolated to a theoretical 1,024-shard network.
Throughput and sharding interpretation
The highest complete one-minute output bucket in the retained archive was 27,232 finalized basechain transactions at 08:24, or 453.87 raw tx/s. That minute coincided with the first short split, but it is not a protocol threshold. It measures finalized transaction records across observed basechain shards, not offered external-message TPS, unique messages or logical jetton transfers.
The highest complete five-minute bucket was 272.05 raw tx/s. Neither figure can be equated directly with third-party explorer counters unless their event definitions and aggregation windows are reproduced.
The benchmark's early 250-320 raw TPS row is also not a mainnet ceiling: it used 512 KiB defaults. The later mainnet-parity runs in the same benchmark report approximately 940-990 sustained raw TPS. More importantly, the benchmark states that healthy overload should increase backlog while block production continues. The empty-block-over-pending-work witness is why this incident cannot be reduced to "capacity exceeded."
Release and explorer context
The sustained shard cascade and rising shard age were visible before the scheduled 10:00 software update. Pre-update configuration snapshots were byte-identical for the inspected parameters. The retained evidence does not support saying that a new configuration activation triggered the slowdown.
At 11:09:12, commit 31421c7 changed a consensus-explorer statistics parser so a skip-certificate observation can initialize the estimated slot start. This improves session statistics. It is not a blockchain fix and does not identify the cause of the incident.
Recommended remediation and release gates
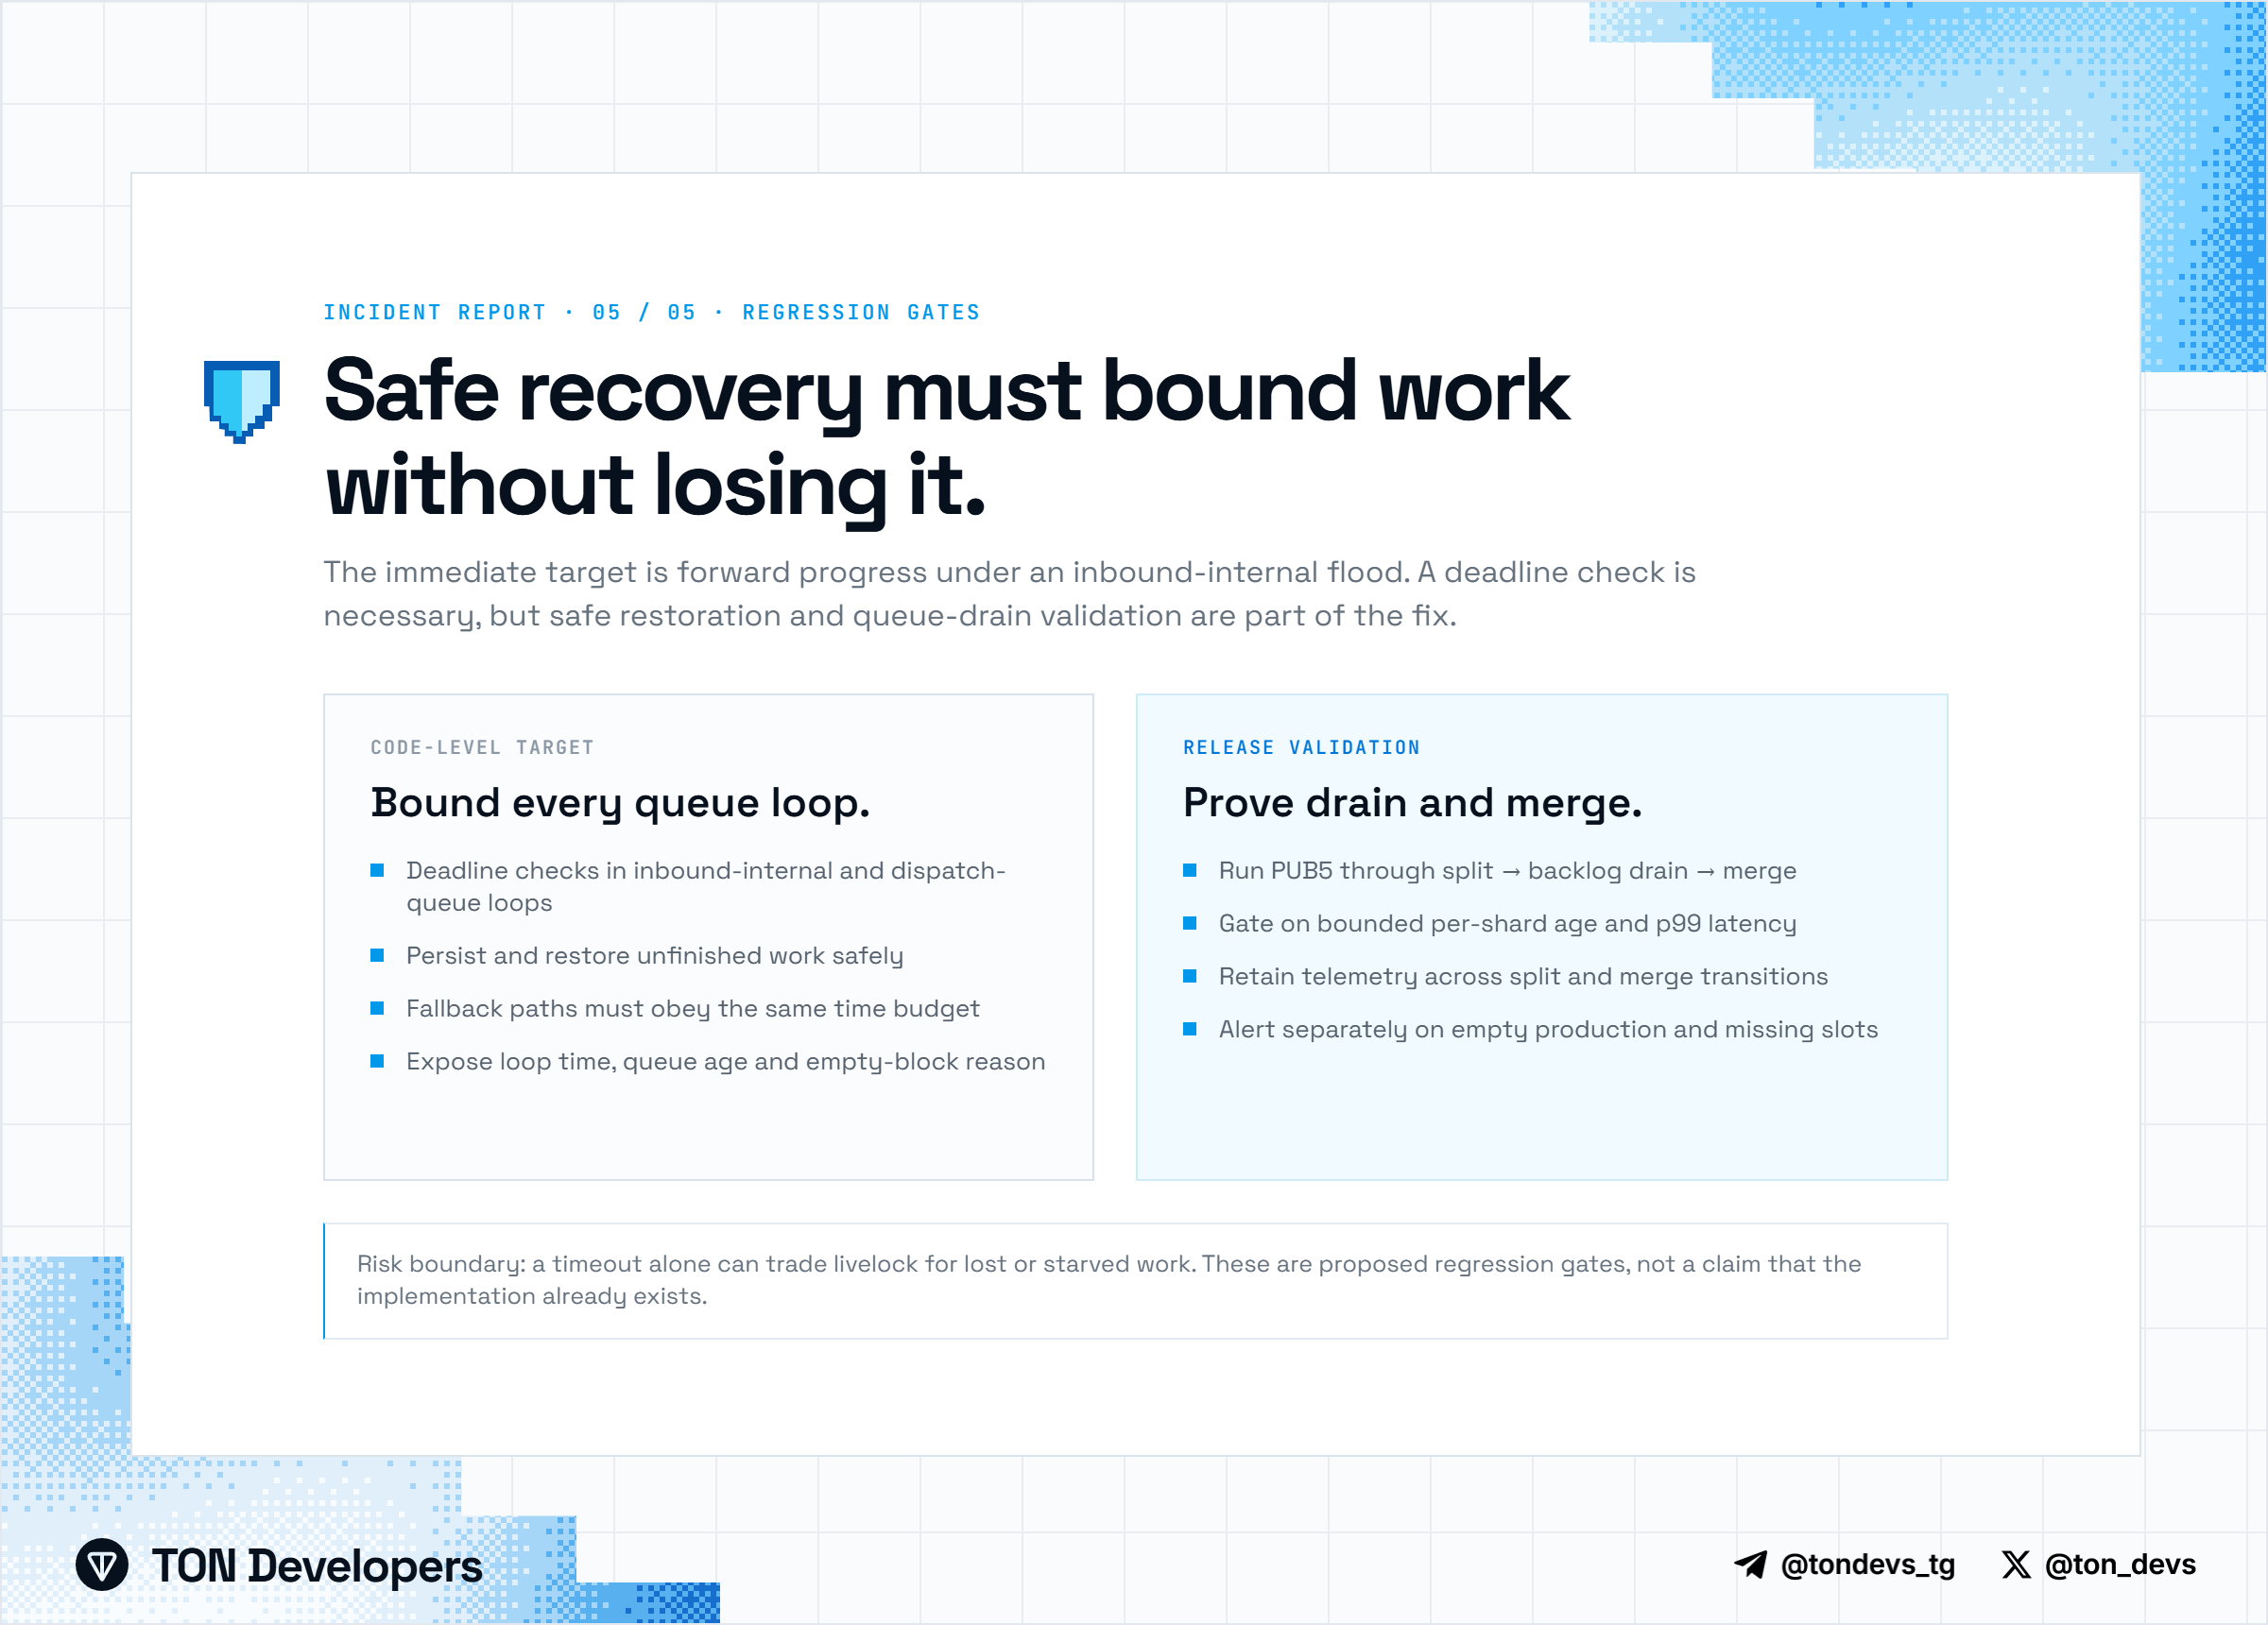
The evidence supports a narrow code-level objective: every inbound-internal and dispatch-queue processing loop must respect the candidate deadline. A safe fix must also preserve unfinished work. A timeout that merely abandons or starves eligible messages would replace a livelock with a different correctness or liveness failure.
A release regression should repeat distributed PUB5-style load through split, backlog drain and merge, and should fail unless all of the following remain bounded:
- per-shard chain age and empty-block rate;
- oldest eligible inbound and dispatch-queue work;
- collation time, deadline exits and candidate lifecycle;
- matched-message p95 and p99 through topology transitions;
- skip-slot and consensus-session progress.
These are evidence-derived targets, not claims that TON Core has implemented or approved a particular patch.
Evidence limits
The complete block archive covers 08:00:00–08:53:52. The incident block and message extraction covers 09:14:00–10:57:22 but is partial and biased toward left-side shard ancestors. Topology was sampled rather than captured at every masterchain block. The 2,027-second active-shard age and 0.52/8.52-second masterchain comparison uses the retained topology-and-telemetry data through 10:43. One short interval with missing telemetry and later catch-up telemetry are omitted from that contrast.
The retained data does not include validator inbound or dispatch queue depth, collation-deadline traces, candidate lifecycle, per-leader misses or consensus vote timing. Those missing traces are the difference between confirming the observable failure class and proving the exact root cause.
Primary sources
- TON Status 221 - shard-processing slowdown
- TON Status 222 - reported recovery window
- TON Status 223 - update and vote postponed
- DanShaders single-node jetton benchmark
- Pinned TON source snapshot used for code-path analysis
- Consensus-explorer parser commit 31421c7
This report is an independent reconstruction from public source code, official status posts, retained full-node telemetry and decoded block archives. It is not an official TON Core postmortem. TON Developers Telegram Group | TON Developers X