Support
FaDGood afternoon, everyone! I see that the new format is flying like hotcakes. So it's worth continuing. So, the toughest topic, which the students of the tutorial are agonizing over (do not take into account the interaction, those who are in the subject will understand).
For PA amateurs, the question sooner or later becomes critical: what should we tie a pattern or a signal candlestick to? In response the Internet and forums start to offer a lot of options. These include:
As well as pivot pivot points, you can find them on the profile sites, they are constantly updated.
And more niche ones in the form of "four-bar reversals", or just high/low prices.
Oh, I forgot, the Fibonacci levels, as well as dynamic levels in the form of moving averages. By the way, a lot of trend indicators are based on moving averages in the form of Bollinger, Alligator. These are the basic concepts that can be found on the web.
Funny, I worked with all this, somewhere just tried to work, but did not understand the specifics of the tool.
Let's go back 6 years: "One day, a young and green FaD was rubbing another pair of pants in front of the monitor, clicking the TF, admiring the charts. Suddenly he stumbled upon GBPJPY, commonly referred to as "peasants". The H4 chart has attracted him by its unprecedented beauty. Beautiful candles and a slight upward trend for 5(or 6) bullish candles. The price was going higher and higher. And at this point FaD paid attention to the spouts of the candlesticks, which were heading towards the sun.
Anyway, the point is, at that moment I was interested in hai, because I saw that the price behaved very interestingly before the next surrender to the high. This idea interested me.
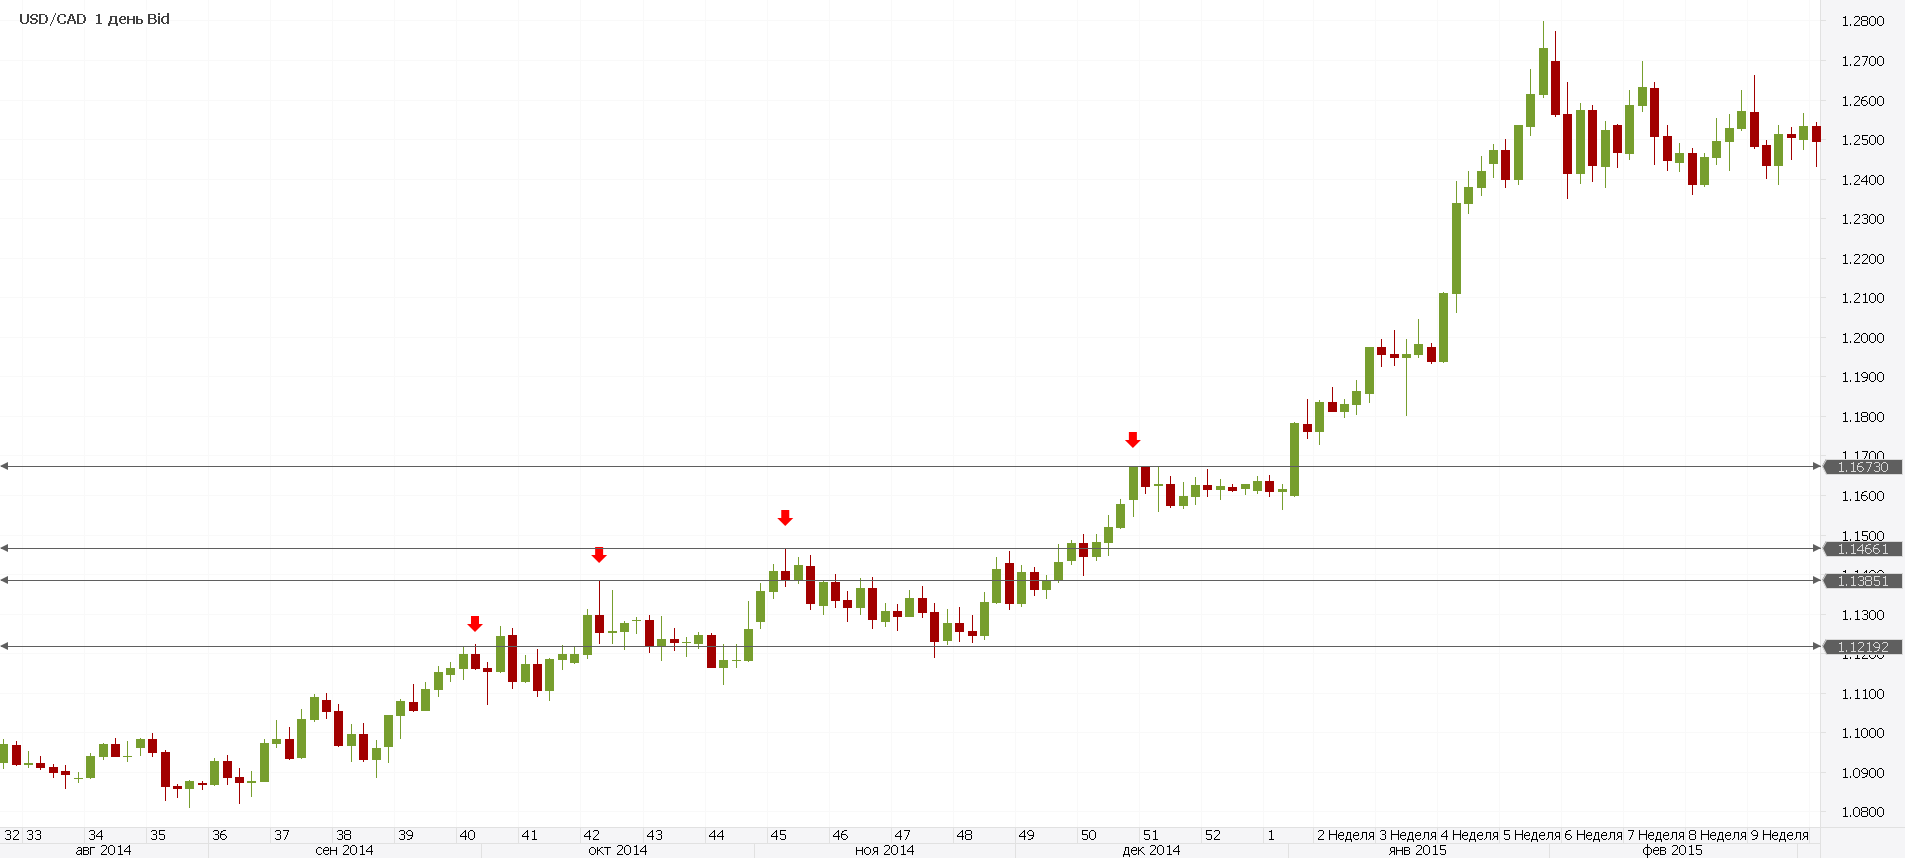
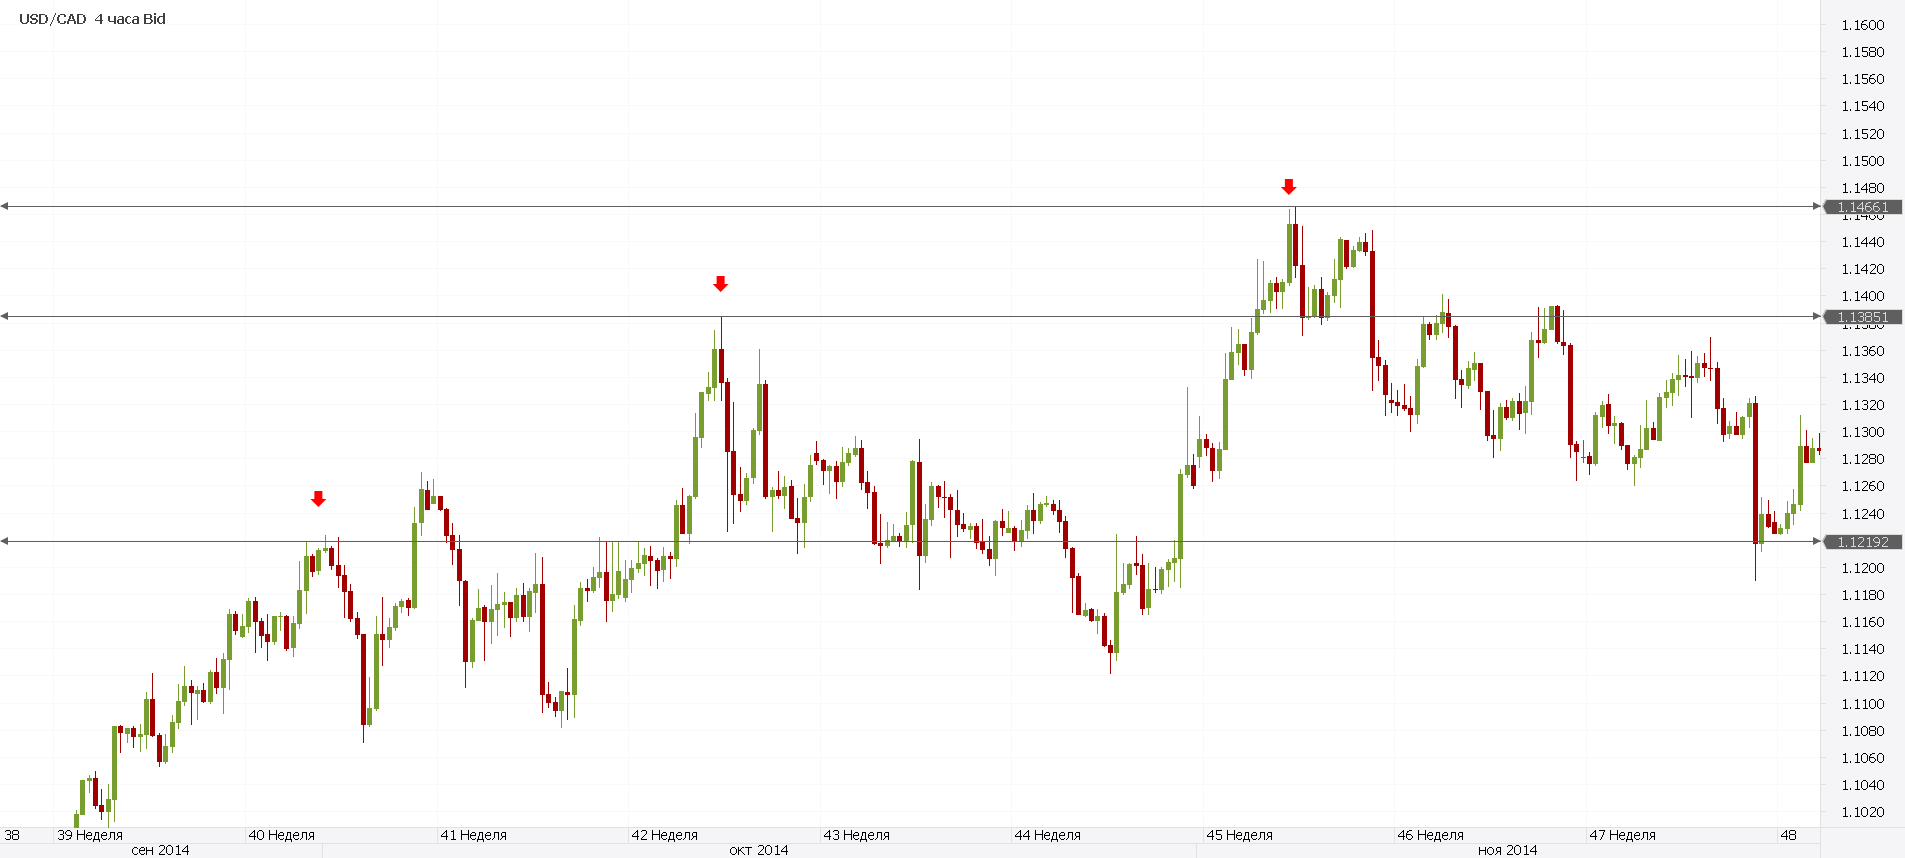
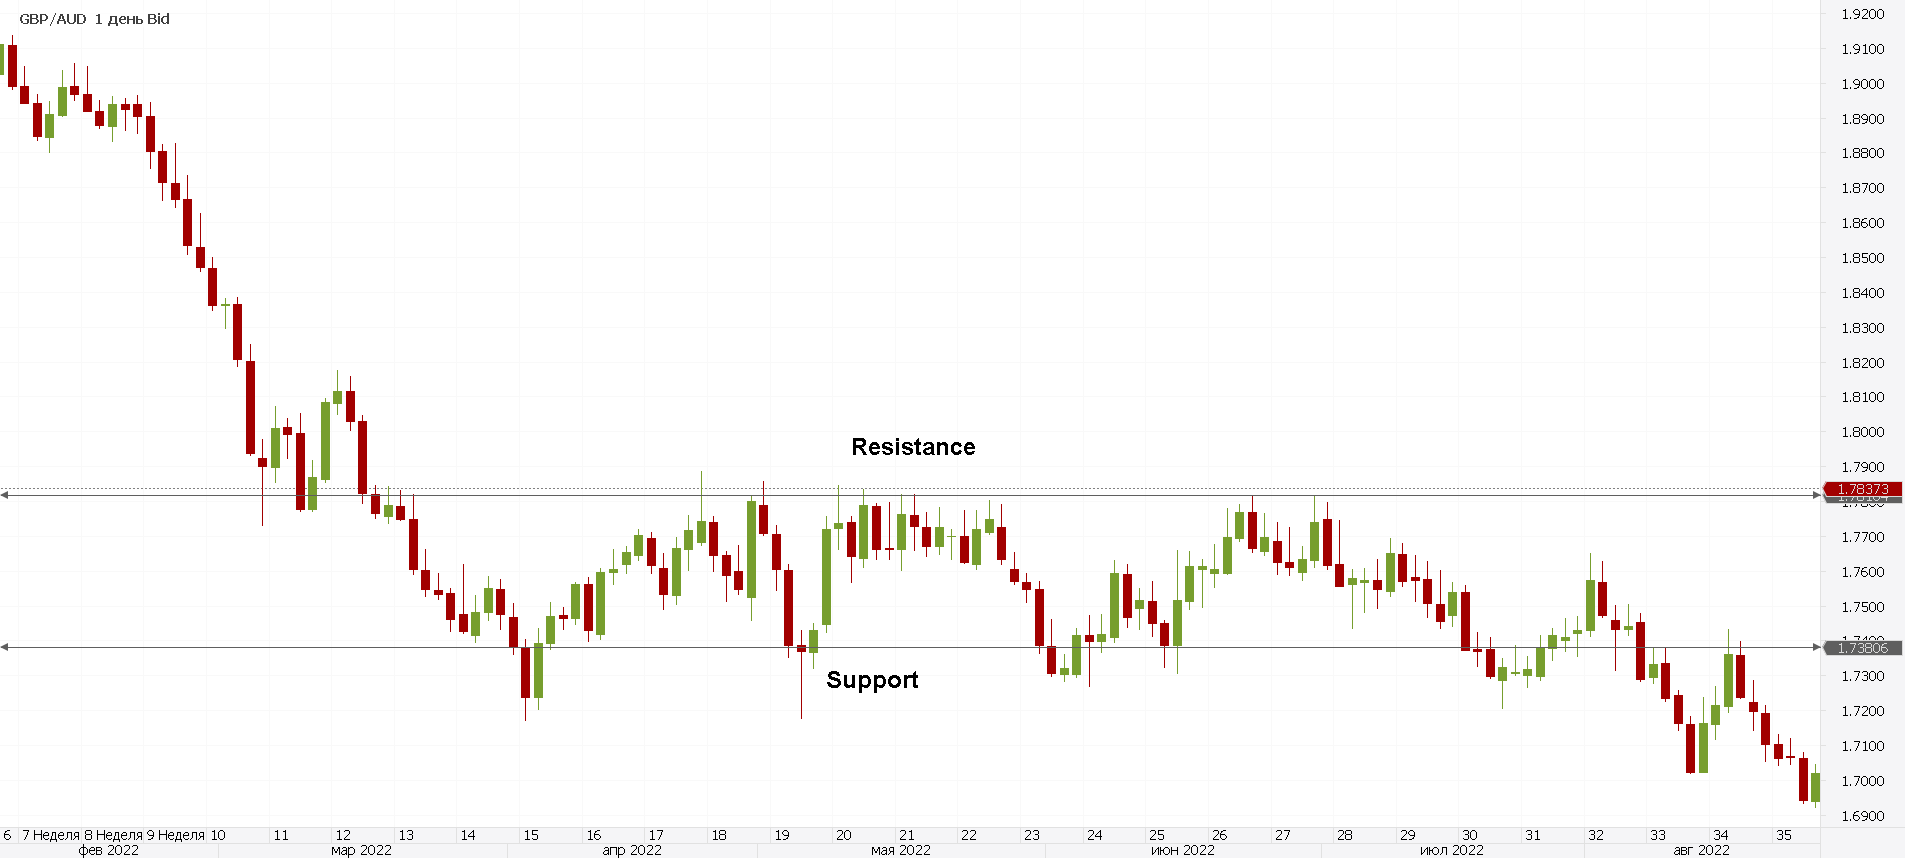
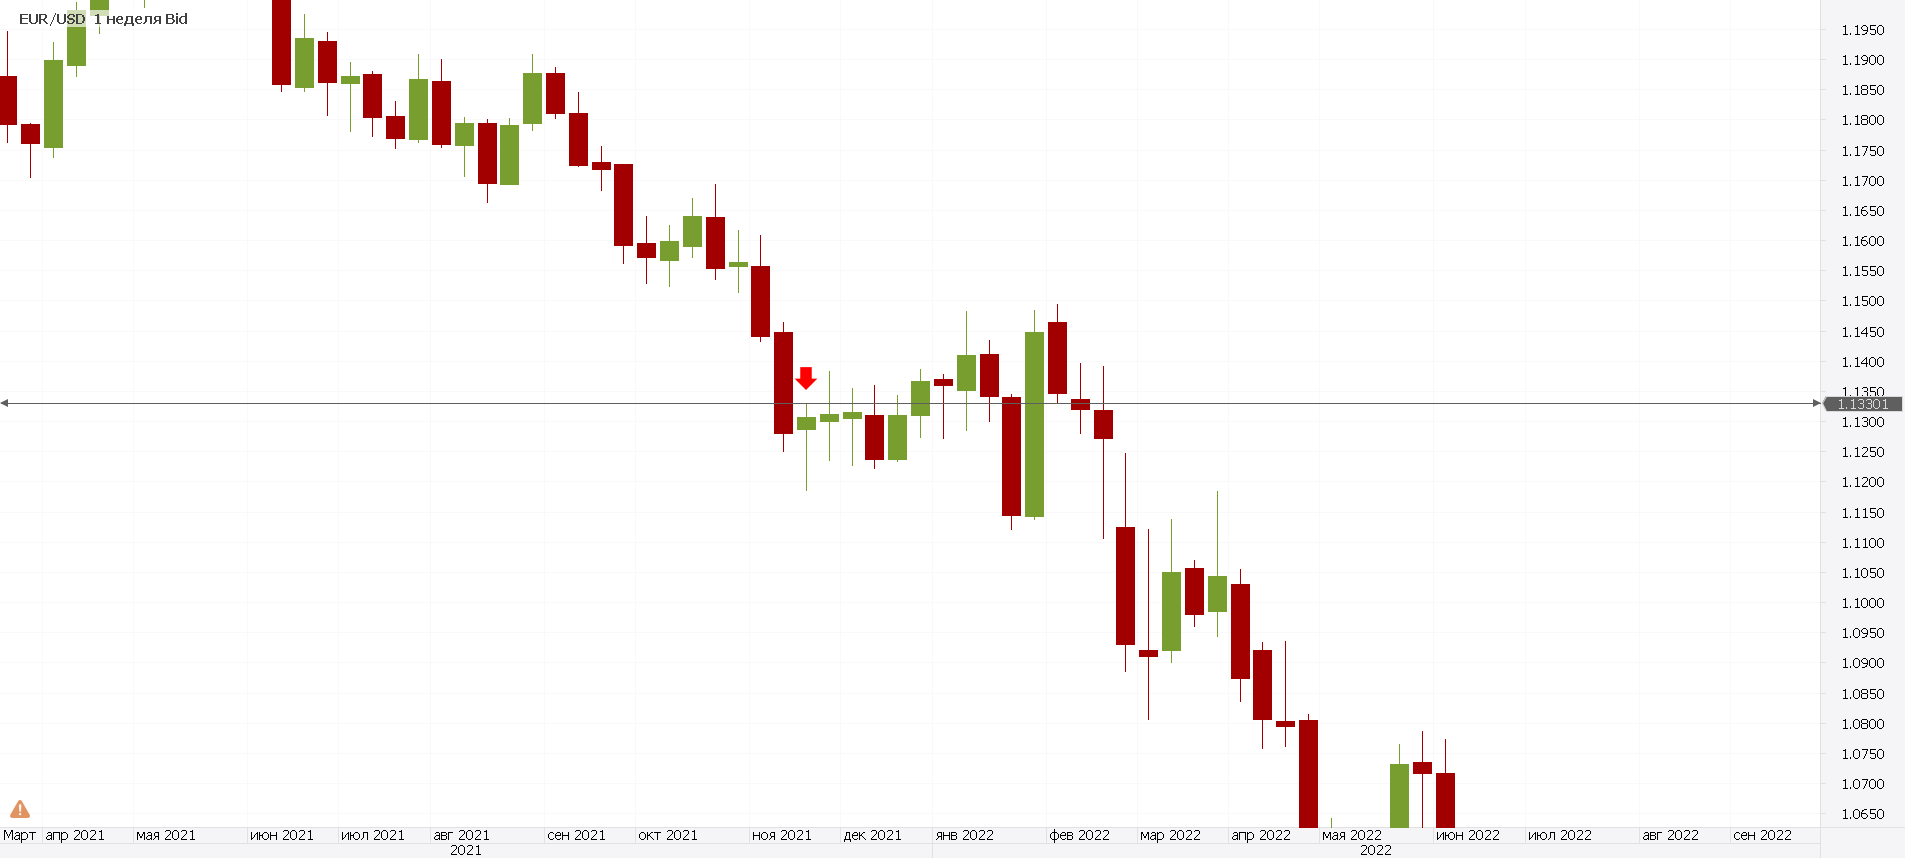
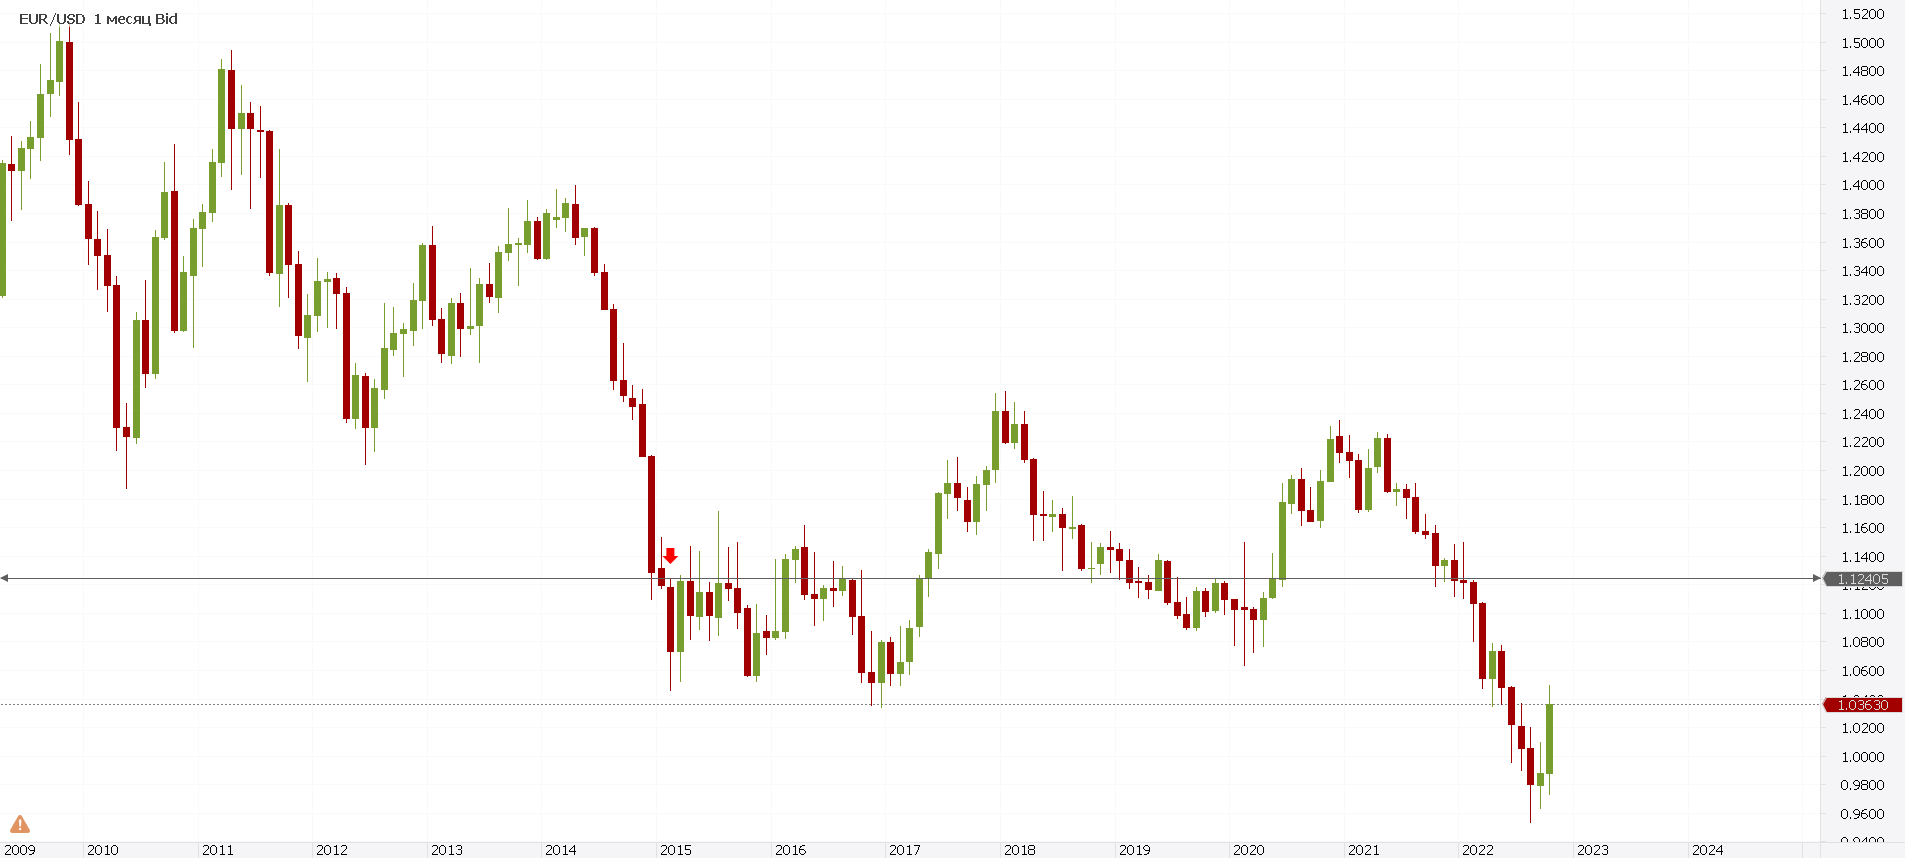
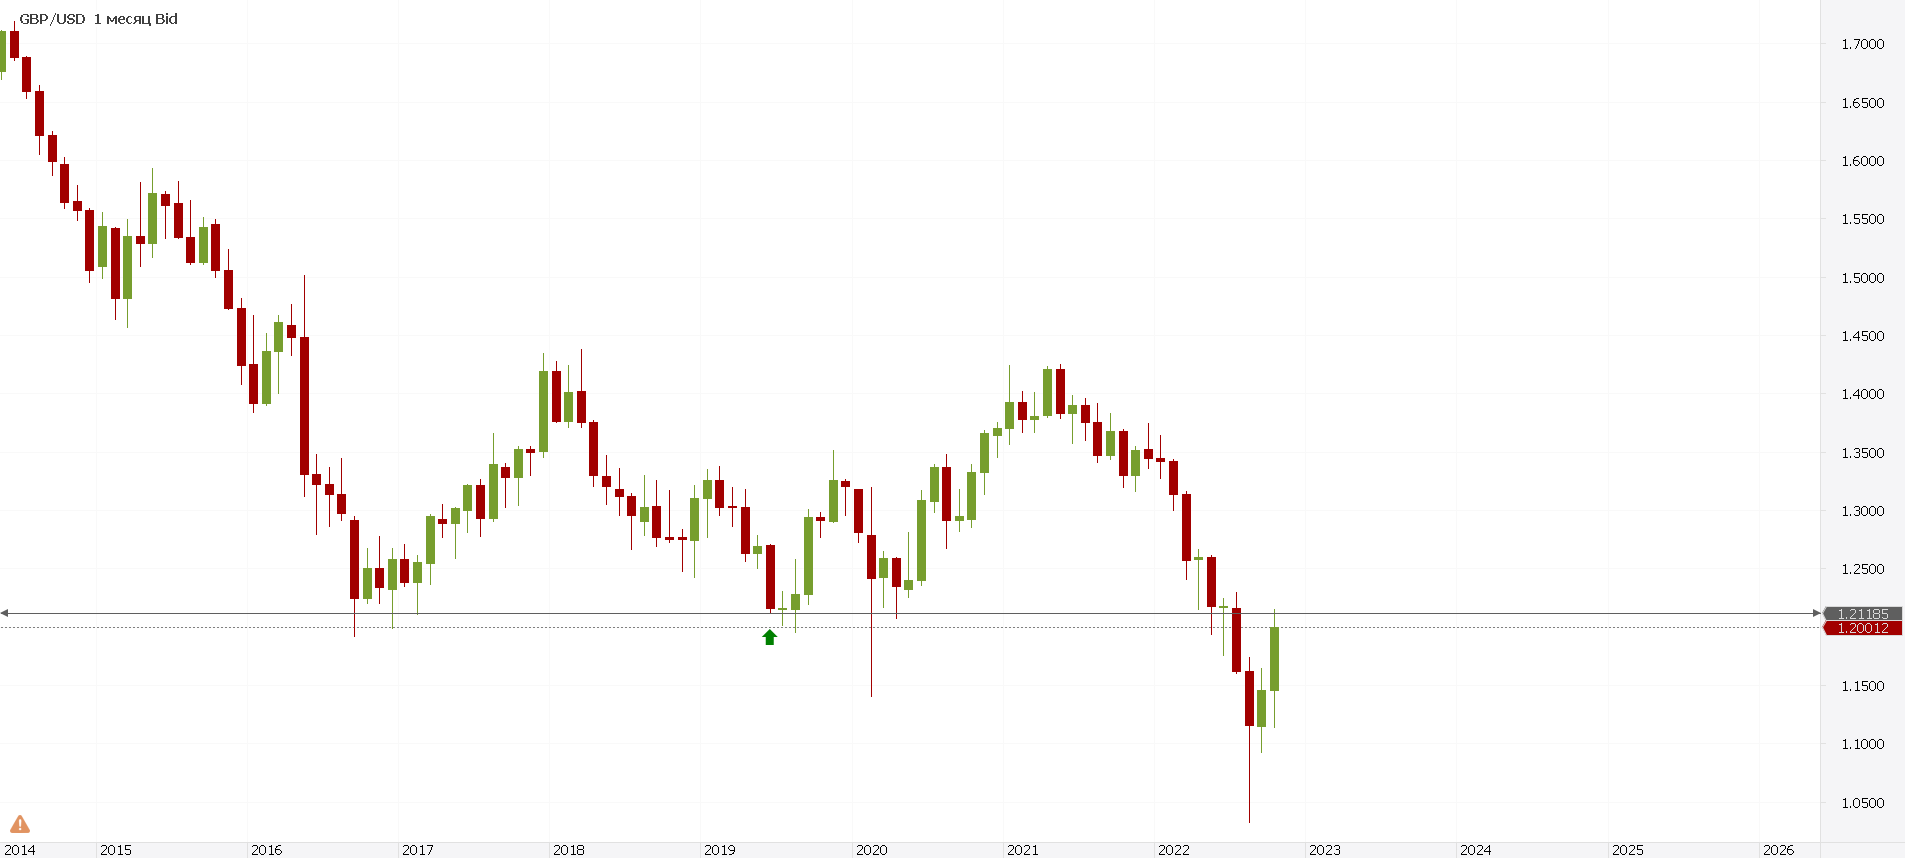
Started digging. I got to the bottom of what is now called a support in a certain place. So, a support is a point of a candle, its high or low, beyond which the price cannot move (a certain amount of candles). But the price is actively expressing its interest in the form of test shadows, but the bodies of candlesticks don't close beyond the limits of the support.
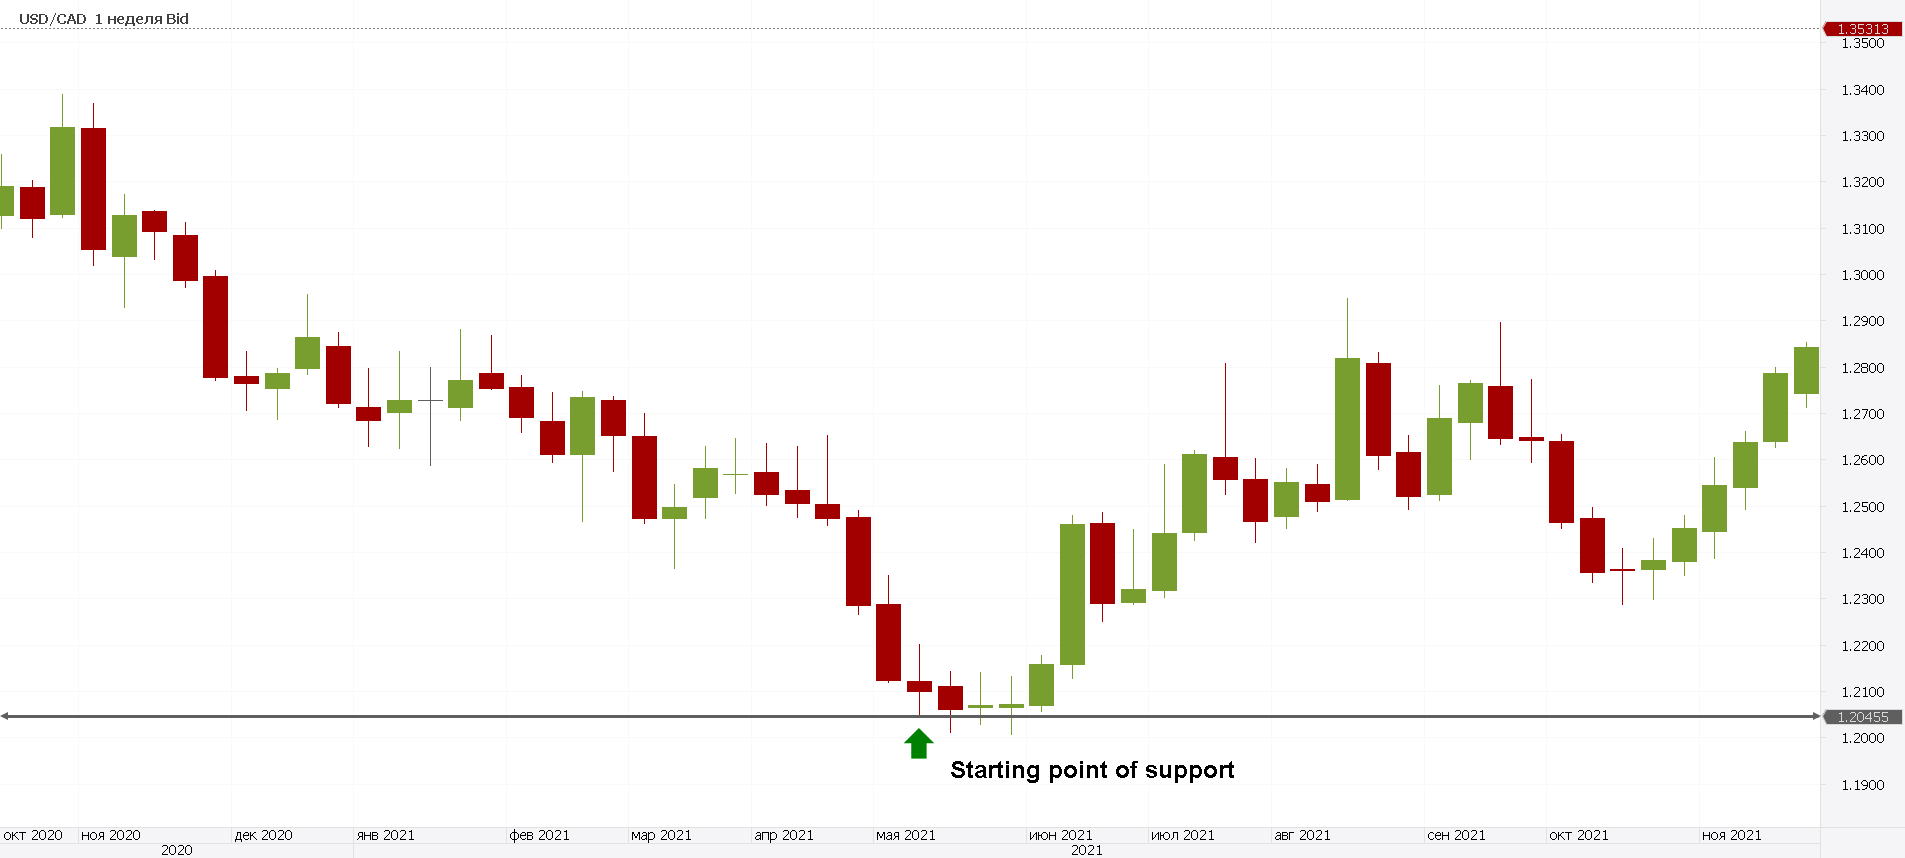
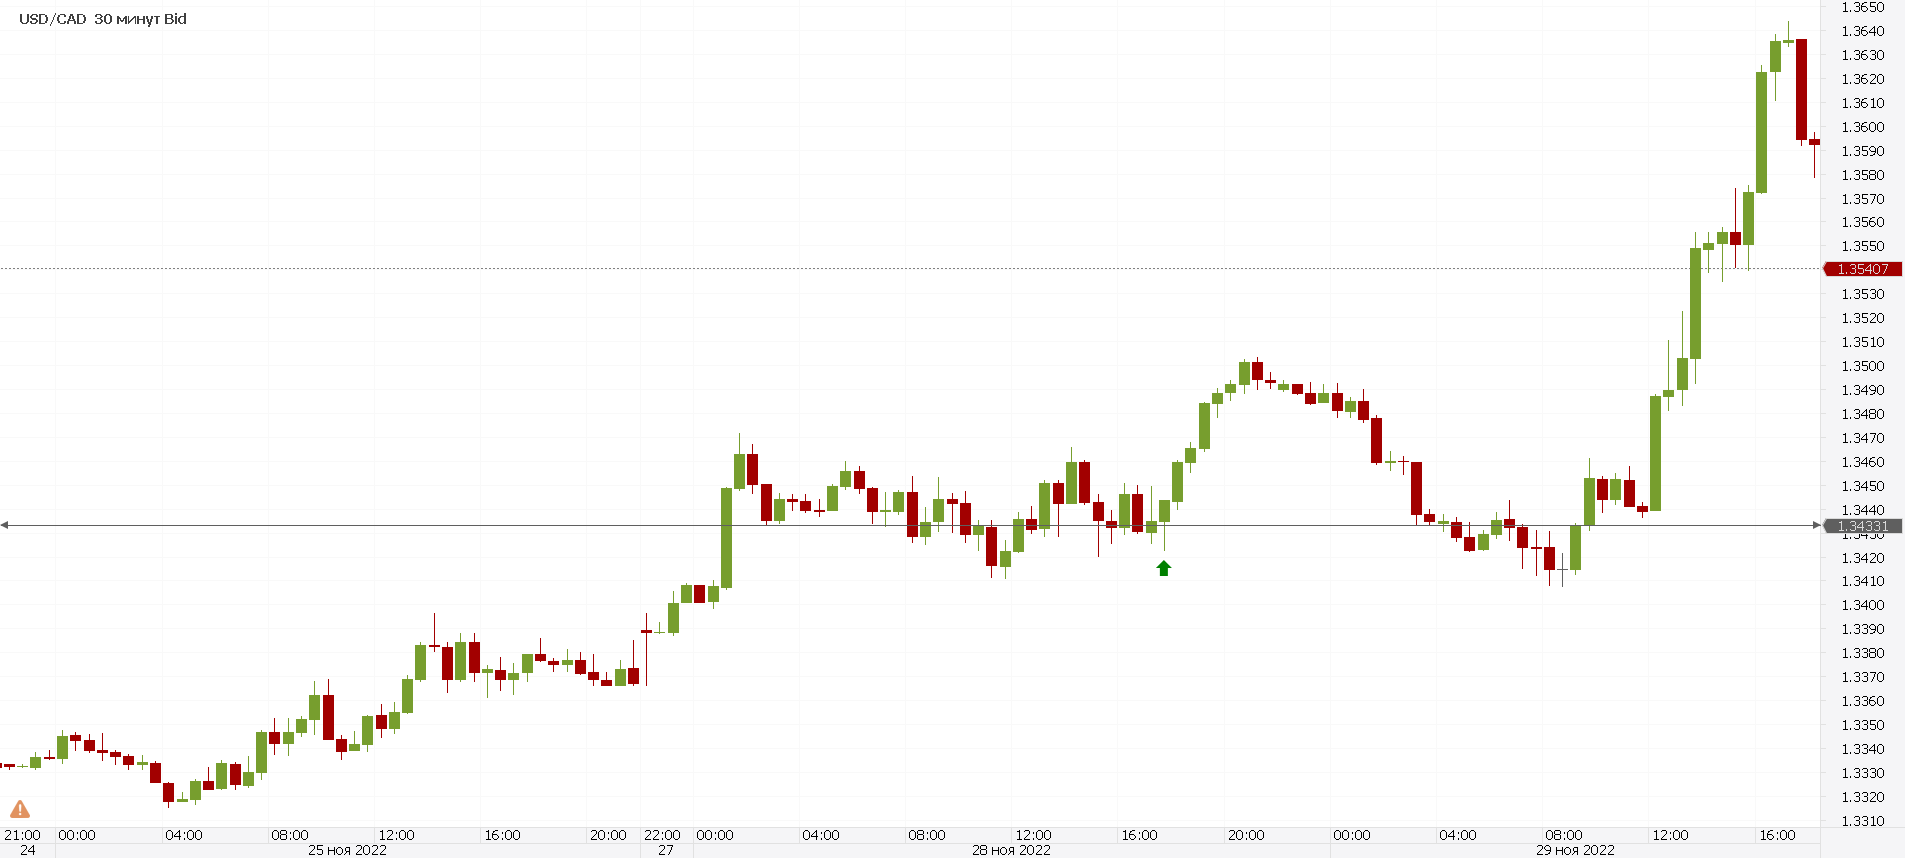
The logic is simple: support as an obstacle to further price movement, which means that this is where it will decide on its further movement. The decision-making is traceable on the lower timeframes.
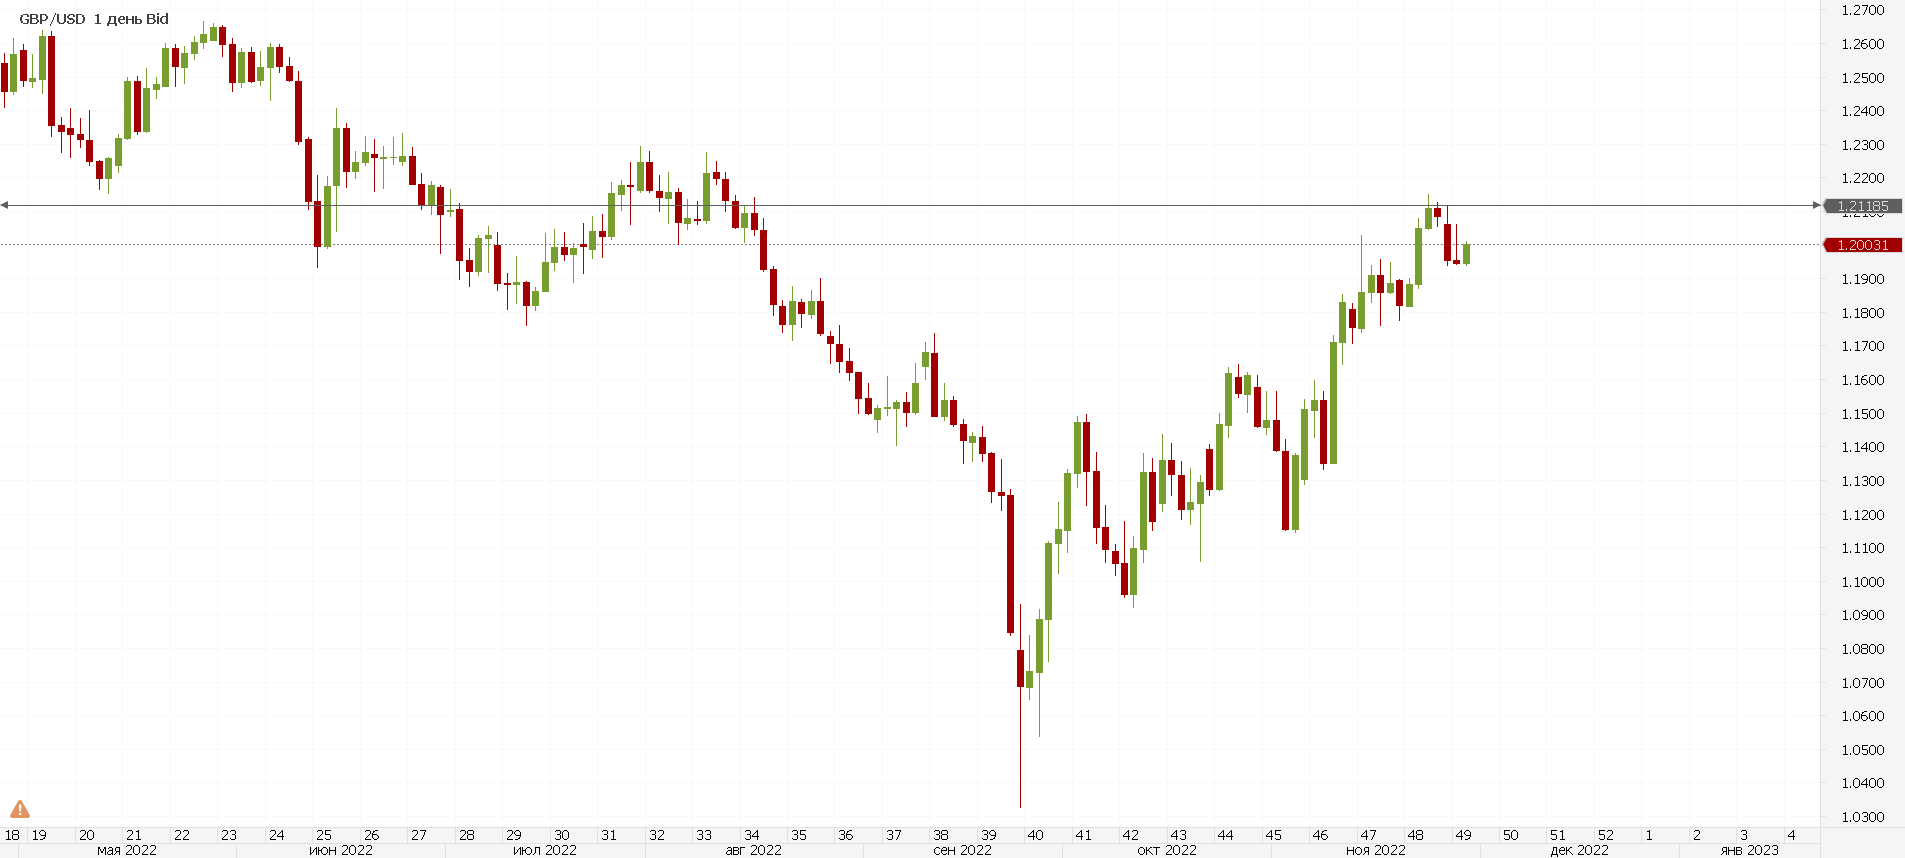
The best thing is that the price will either roll back and move away from the support or break through the support. There is no third option, the price will sooner or later move after the support. Both variants suit me, my system allows trading on both breakout and rebound from the pivot.
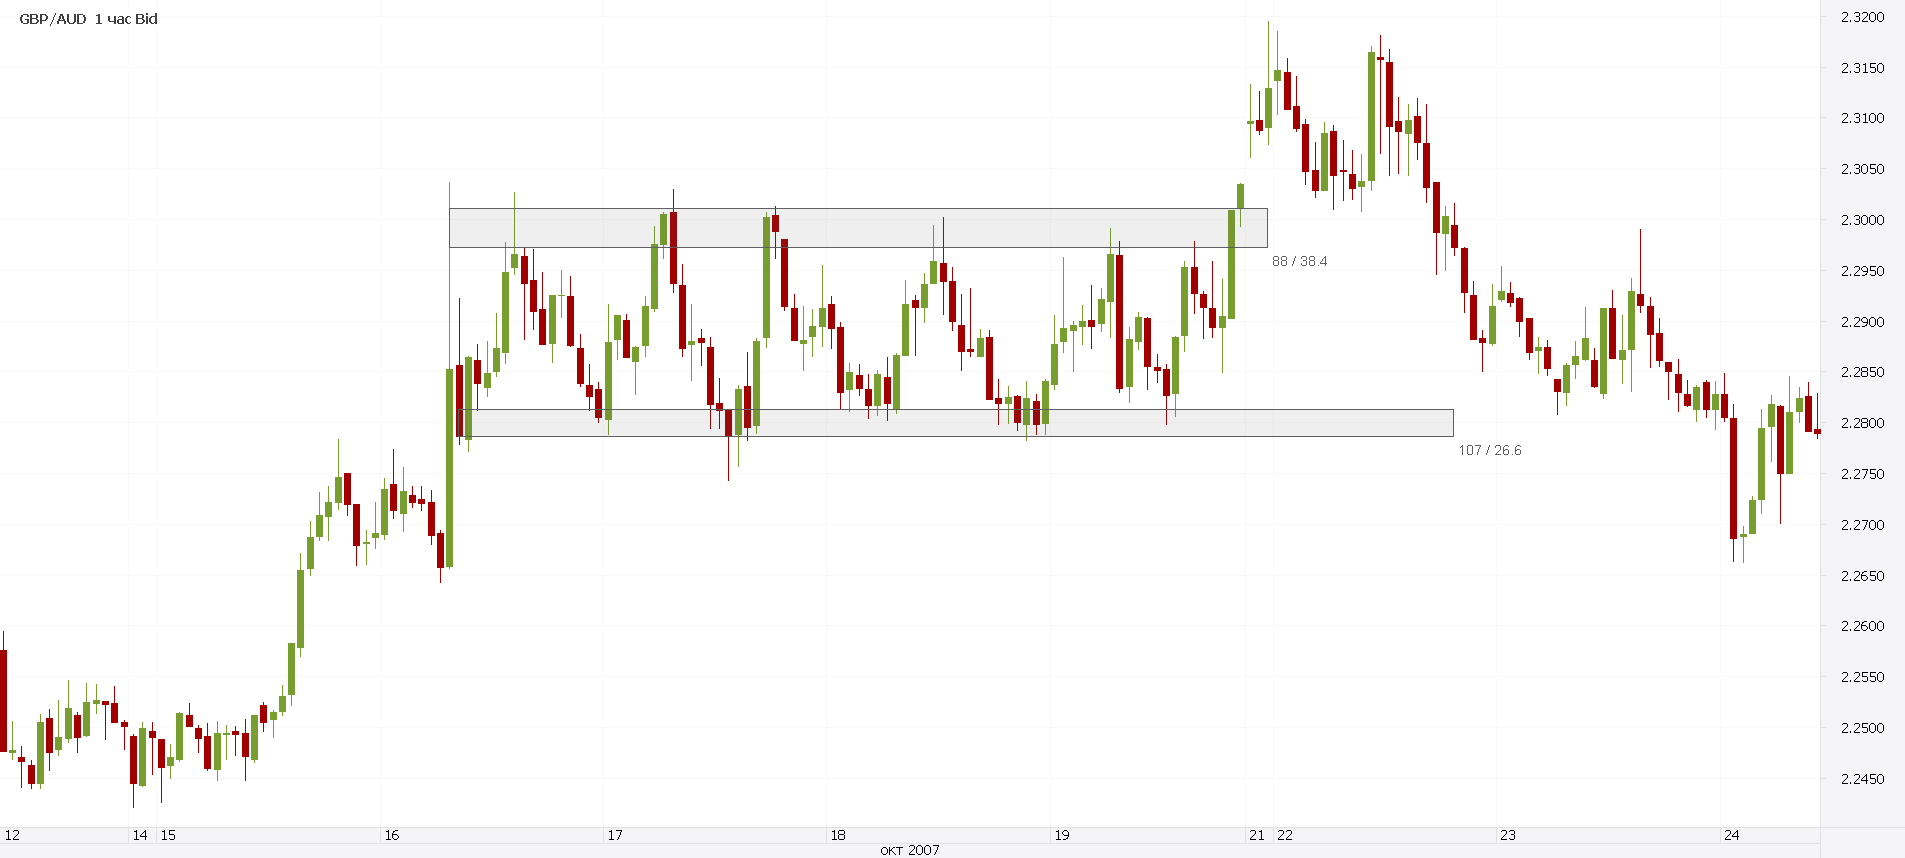
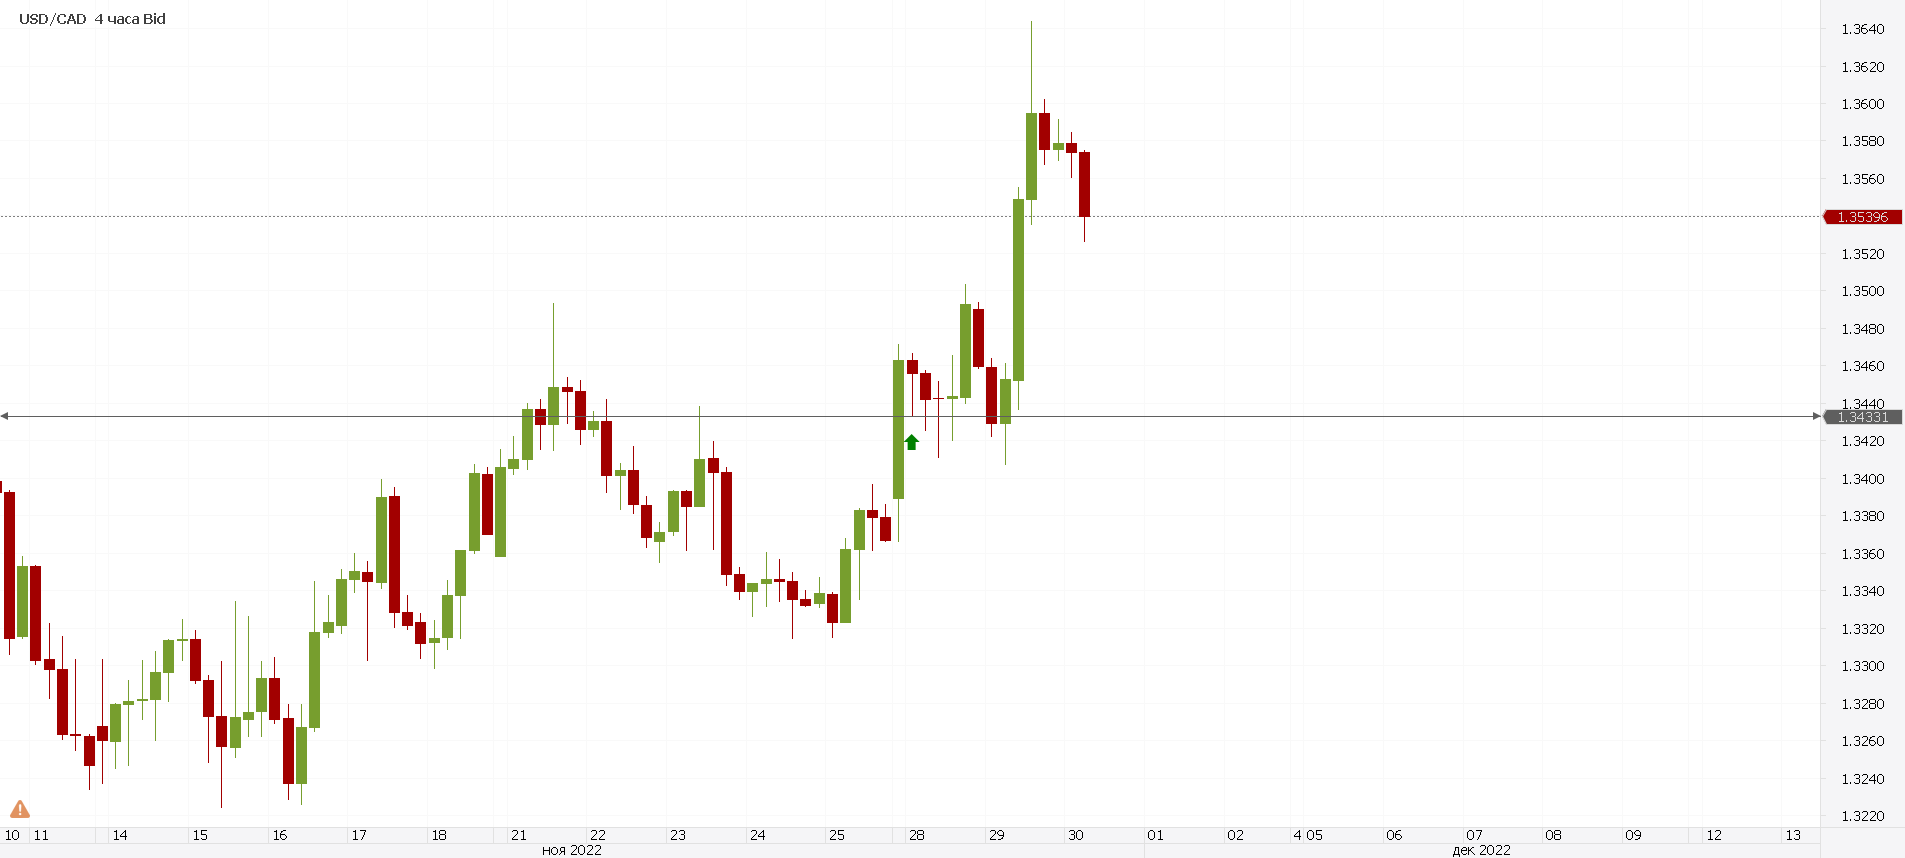
Below is an example of a system entry:
https://t.me/dnfad/2395 (example trade)
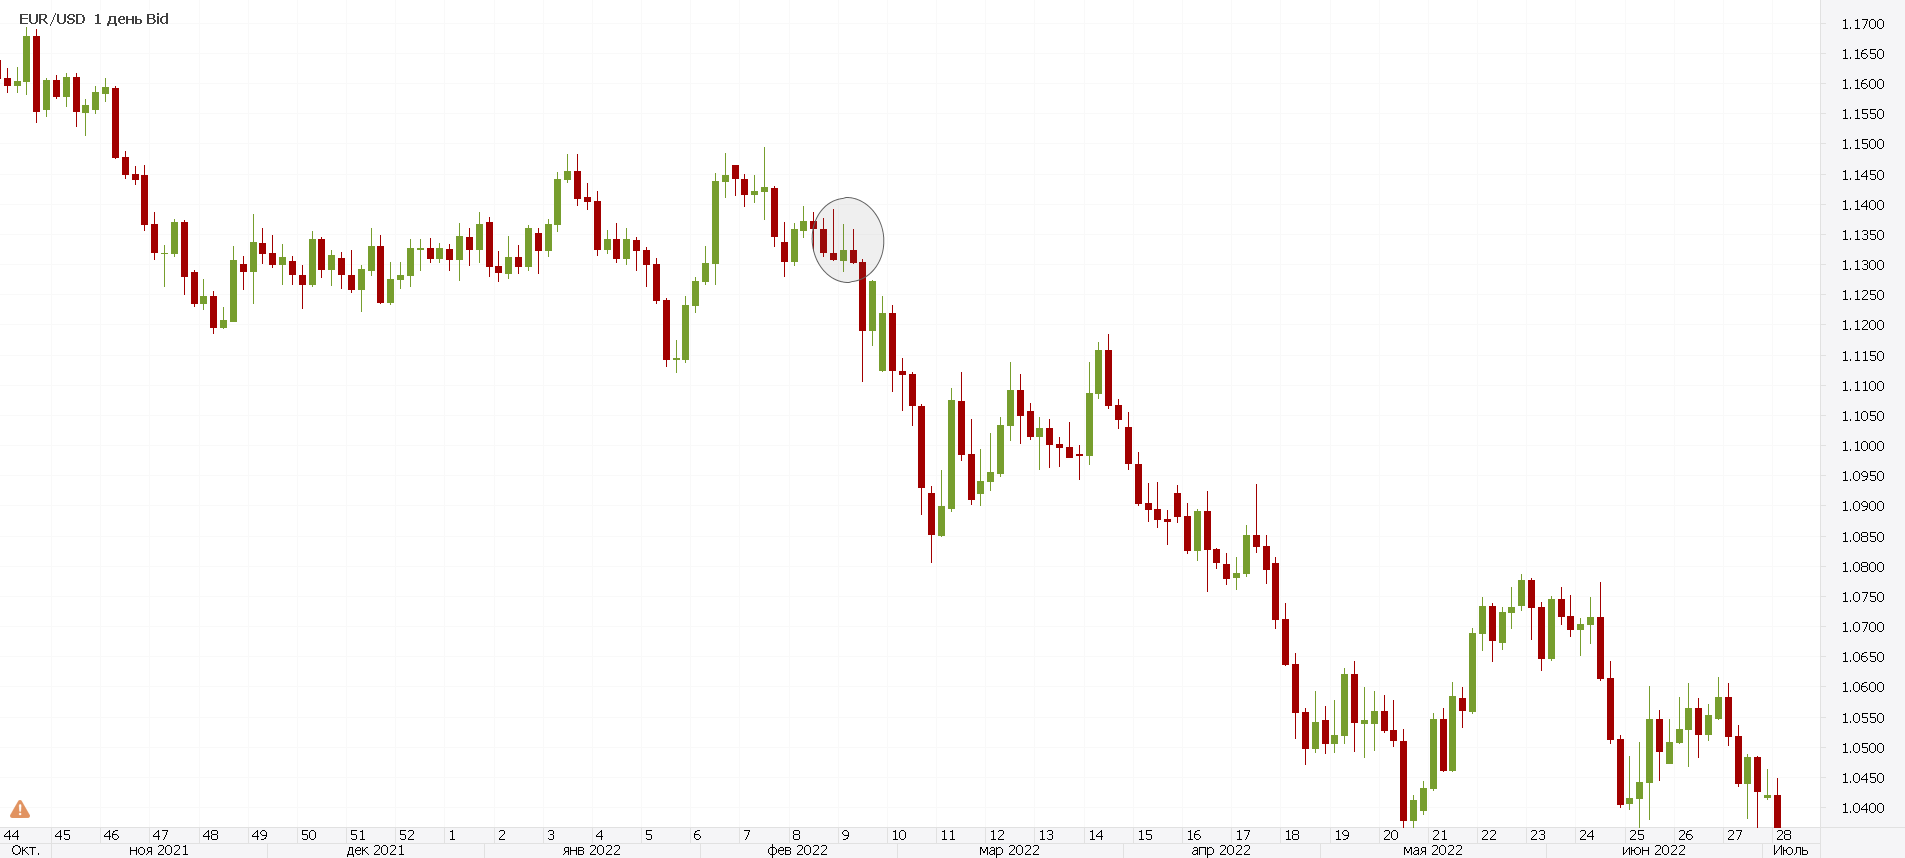
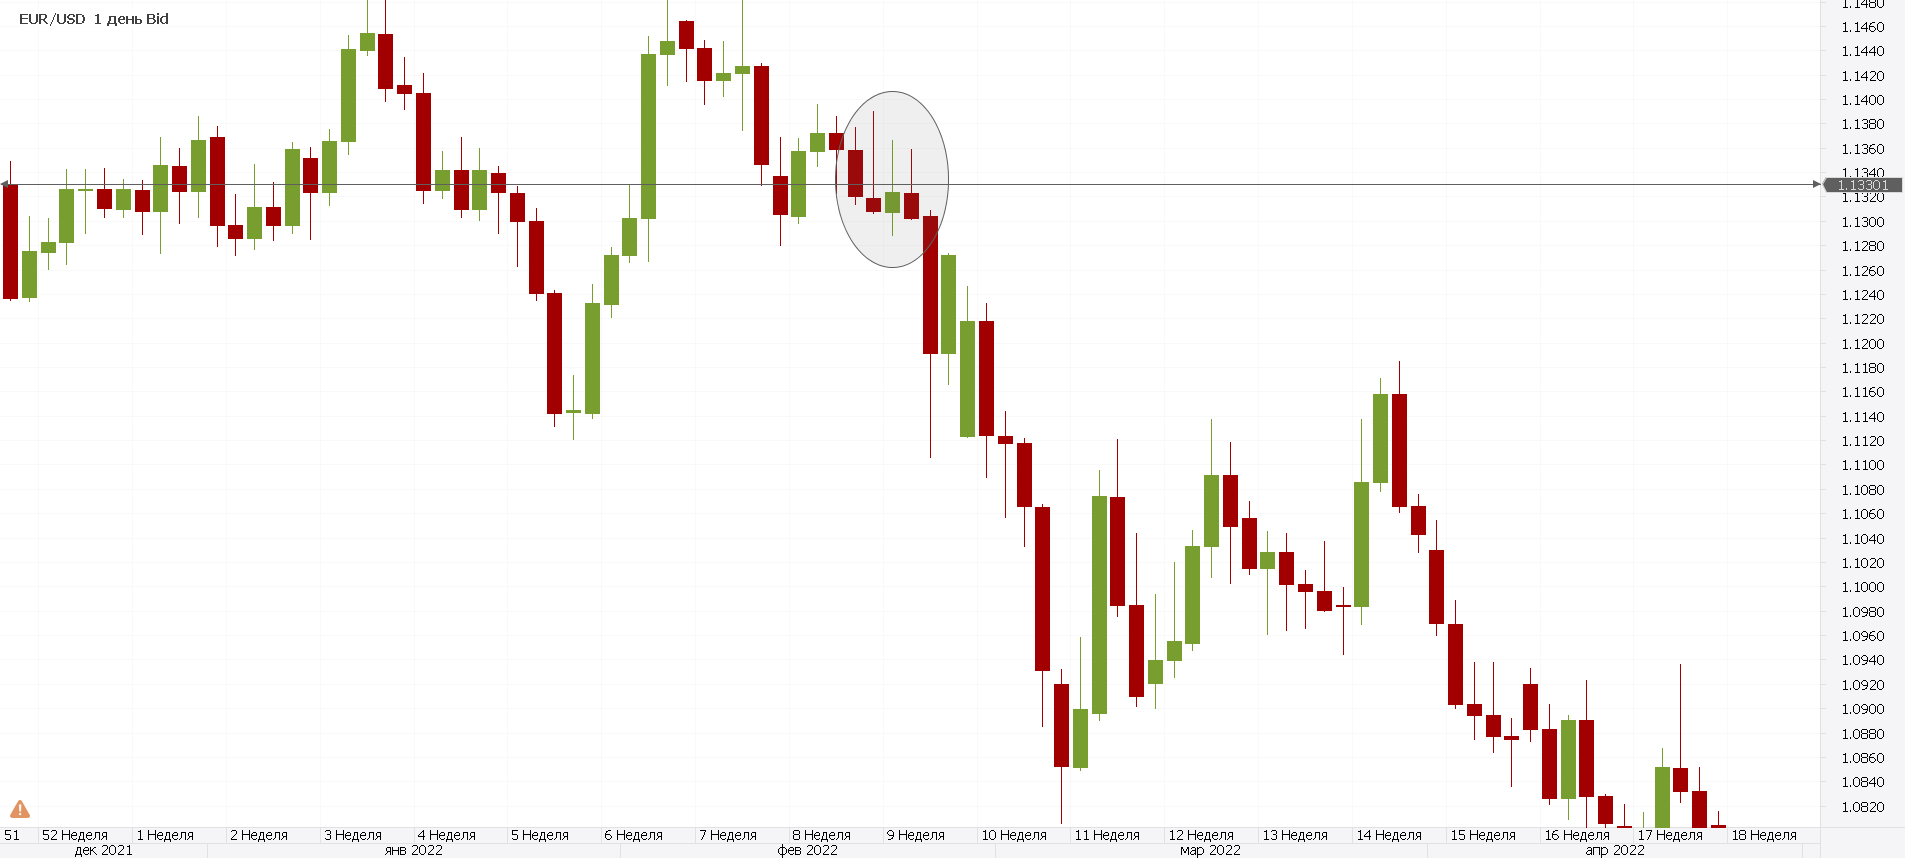
Below is an example with the correct candle:
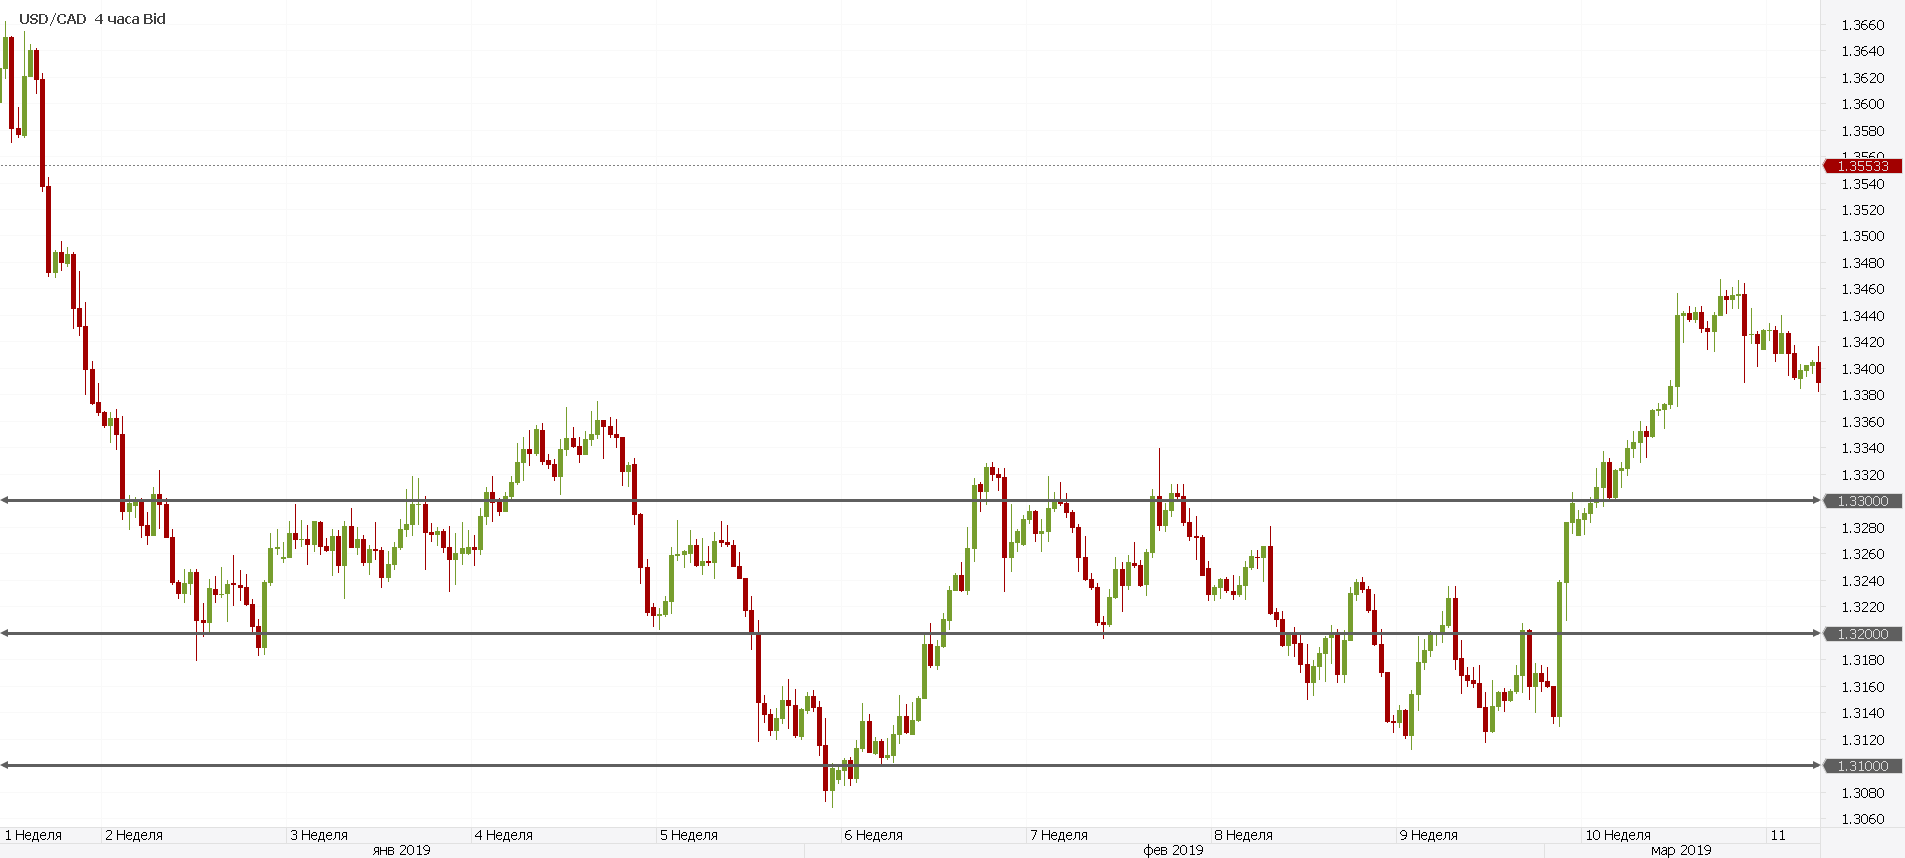
The main advantage of the supports is that you know the specific point where the decision will be made. It's not some zone where price will probably turn around. You know up to 4 or 5 decimal places where everything will happen.
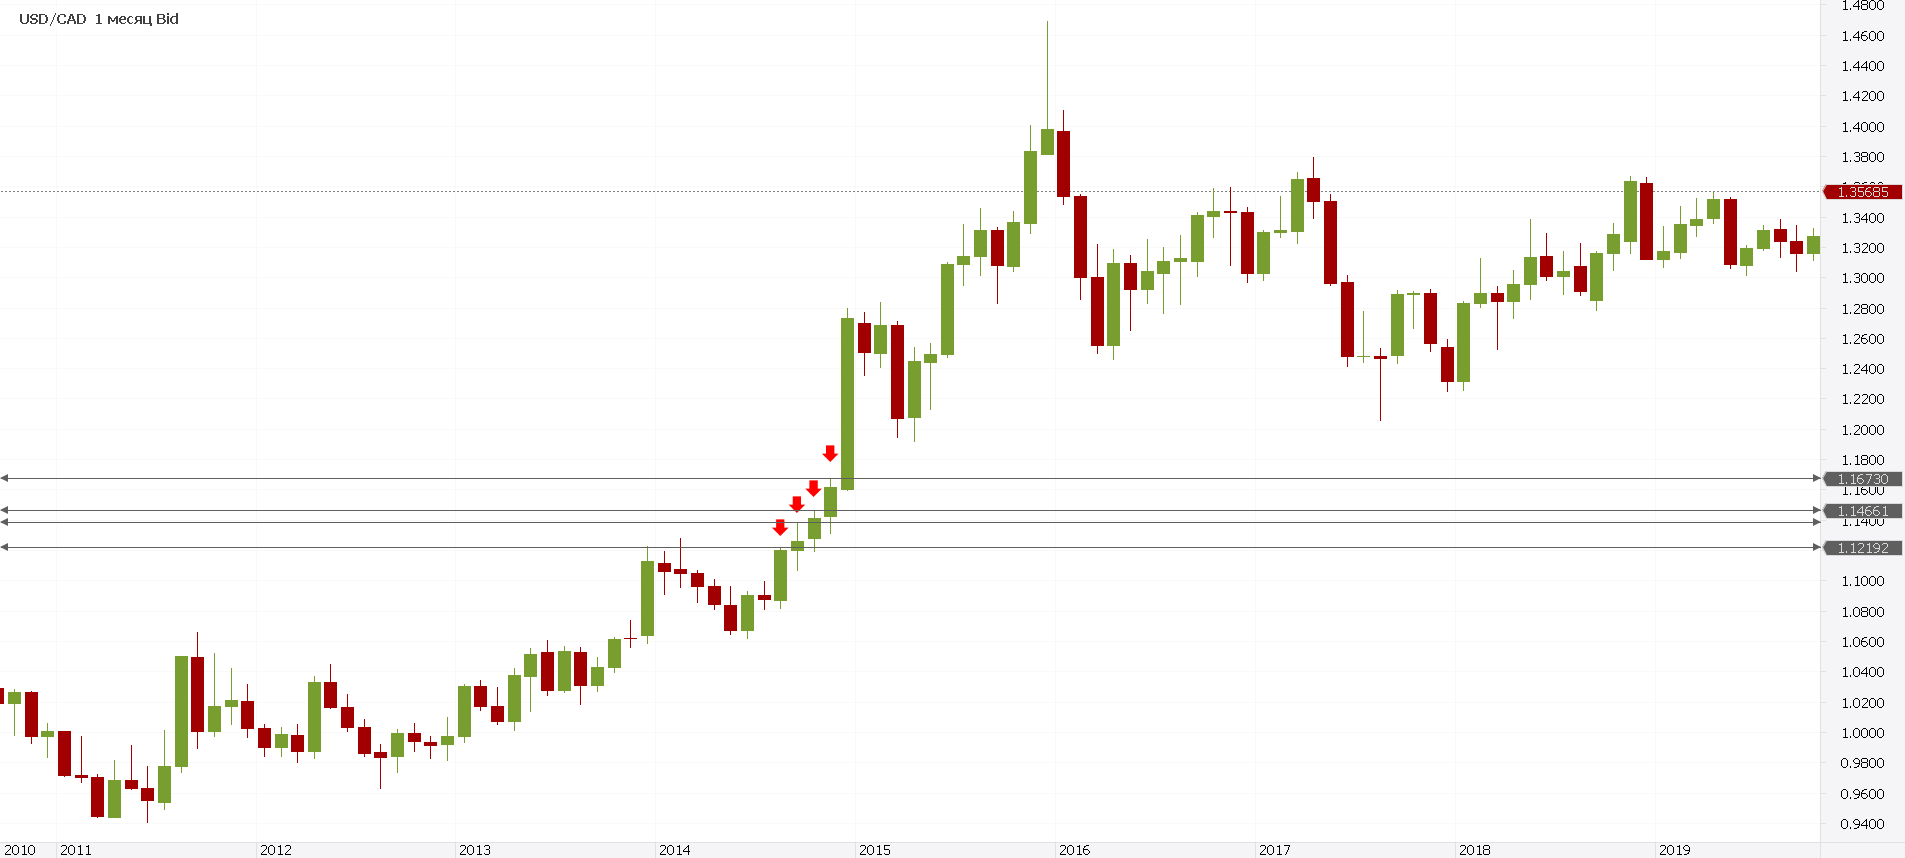
Also, the pivots are able to influence each other, and the older the TF, where the support is built, the stronger this influence can be traced.

I will not publish it, of course, because it is a vast topic that requires a long study and correction of knowledge. I hope this information will help you to orient on the chart easier and make right decisions. Good luck to you all, your FaD.
https://t.me/dnfad - collection of trades and sundries
https://t.me/mslfad - thoughts on trading and typical trader's behavior