Setting up filters: Timeframe Period
itspowermove_bot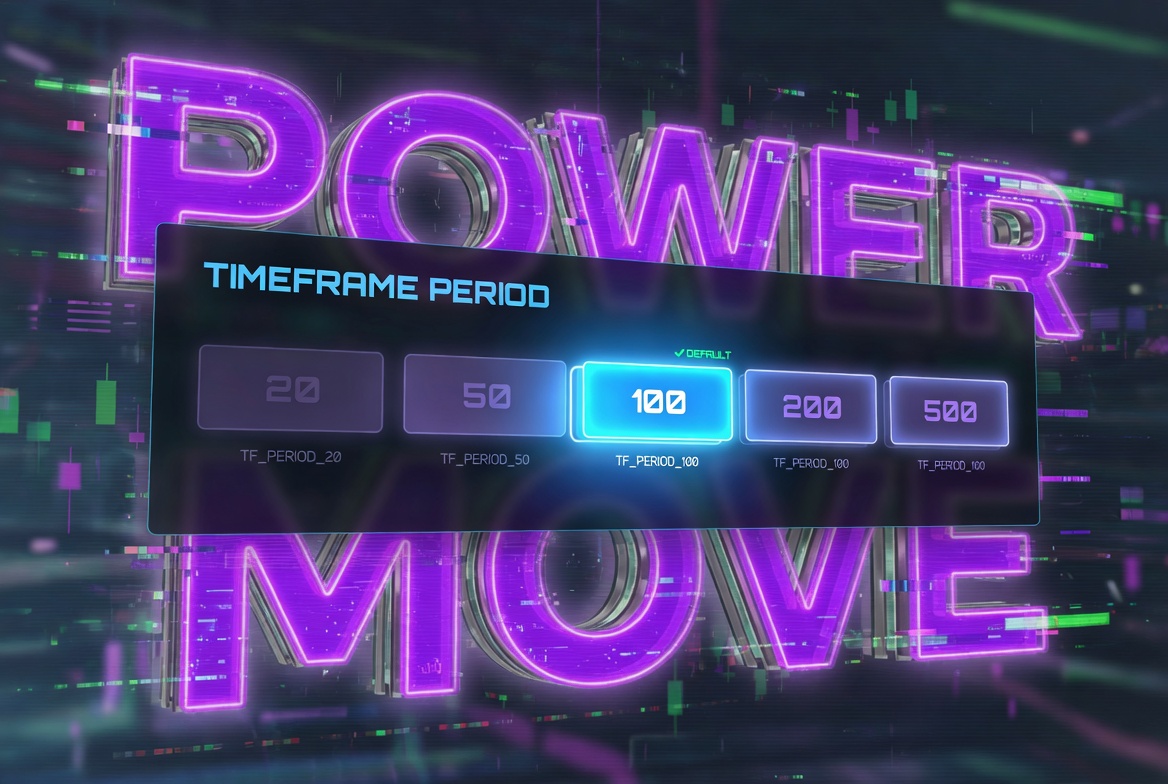
The first and most important parameter on every timeframe is "Period". It determines how "fresh" or "stable" your analysis will be. Let's break it down.
📌 What is it?
This is the historical depth (number of bars) that the screener uses for calculations on the selected timeframe.
For example:
- Period 50 on 1D = the last 50 daily candles
- Period 100 on 1H = the last 100 hourly candles
All analysis is calculated based on these bars.
🎯 What is it for?
The period directly affects the sensitivity and reliability of signals:
- Short period → signals are more current, but there's a higher risk of false positives.
- Long period → signals are more stable, fewer false positives.
Choosing the right period helps filter out noise and show only the coins that match your trading horizon.
📈 Short vs Long Period: What's the difference?
🔥 Short period (up to 50 bars)
- Fast reaction to a new market regime
- Great for catching the start of trends and impulses
- Downside: more noise and false signals
🛡️ Long period (60–200+ bars)
- Stable statistics
- Less impact from individual anomalies
- Downside: slower to react to trend changes
⚡ Which timeframe and period should you choose?
The choice of timeframe always depends on your trading style, experience, and psychological resilience. The main rule: the shorter the trades, the smaller the timeframe.
🔥 Scalp and intraday (time in trade: minutes to a few hours)
- Main timeframes: 1H, 15M, 5M
- Recommended period: 30–70
- Pros: maximum detail, plenty of opportunities
- Cons: high noise and stress
📈 Swing trading (time in trade: 1–10 days)
- Main timeframes: 4H + 1D
- Recommended period: 50–100
- Why: balance between the global trend (on D1) and entry points (on 4H)
🛡️ Positional and long-term trading (time in trade: weeks to months)
- Main timeframes: 1D, 1W
- Recommended period: 80–200+
- Pros: most reliable signals, minimal noise, relaxed trading
- Cons: fewer trading ideas, not suited for quick profits
💡 Best practice — Multi-timeframe analysis
Use the combined top-down method:
- Higher timeframe (e.g. 1D) — identify the global trend and overall picture
- Middle timeframe (4H) — look for confirmation of the direction
- Lower timeframe (1H) — find the precise entry point
Example of a classic Power Move setup:
- 1D (period 50) — overall market picture
- 4H (period 50) — trend confirmation
- 1H (period 100) — entry point
There is also the well-known "Three Screens" system by Alexander Elder, which is built on the sequential analysis of three different timeframes. We'll cover it in the article on configuring multi-timeframe filters.
This approach helps filter out noise, find higher-quality signals, and see the full market picture.
🧠 How does the selected period work in Power Move algorithms?
- The more bars in the period, the more "reserve" candles are available for calculating "fair volatility" when anomalies are detected.
- The number of bars in your period is used to compare against Bitcoin on the same timeframe when calculating the Pearson correlation coefficient — a method named after British statistician Karl Pearson.
- Important nuance: if a coin doesn't have enough historical data on the selected timeframe (e.g. it's relatively new), it won't be included in the selection. The screener requires a complete set of bars for accurate calculations.