Setting up filters: ATR Period
itspowermove_bot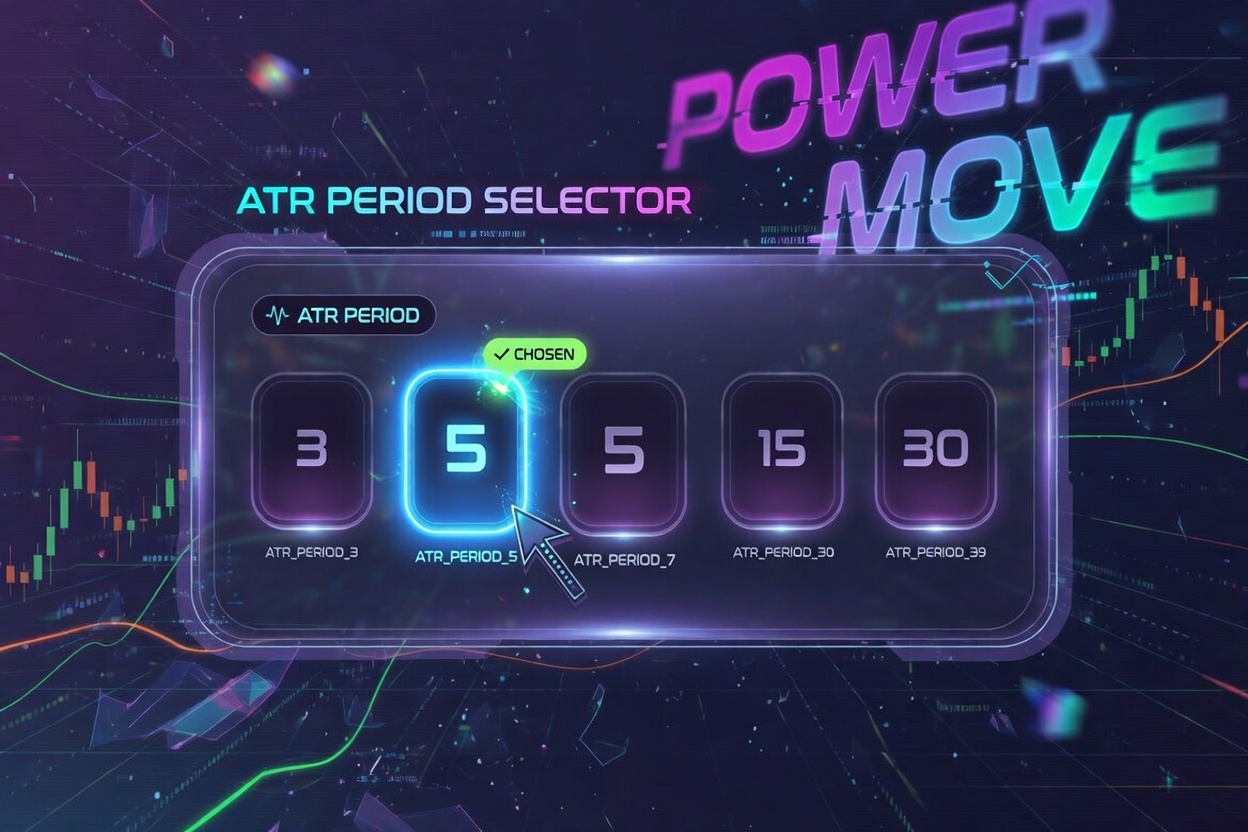
One of the most powerful and useful tools in the Power Move screener is the "Clean ATR Period". This is a special ATR calculated with automatic filtering of paranormal bars. It doesn't just measure average volatility — it provides the cleanest and most honest picture possible. It's what helps you identify:
- the current phase of movement (consolidation, impulse, or trend completion),
- the level of market manipulation,
- the real remaining move in LONG and SHORT,
- the coin's "breathing" across different timeframes.
As a result, you make clear and rational trading decisions — not based on emotions and guesswork, but on the pure arithmetic of current price data.
📌 What is ATR?
Standard ATR
ATR (Average True Range) is an indicator that measures an asset's volatility — i.e. the average magnitude of price movement over a given period. Developed by Welles Wilder in 1978.
Simply put:
- ATR = 2% → the price moves an average of 2% on the selected timeframe
- ATR = 300 points → average movement of 300 points
⚠️ ATR does not indicate direction (up or down) — it only shows the degree of volatility. A rising ATR means increasing volatility; a falling ATR means it's cooling down.
😔 The downside is that standard ATR accounts for every bar in a row — including news spikes, manipulations, and "dead" tiny bars. This makes the data easy to distort, which is especially visible in the crypto market.
📊 What is "Clean ATR" at Power Move?
"Clean ATR" solves the problem of the standard version. It removes paranormal bars (anomalous impulses), replacing them with normal values drawn from a reserve taken over the selected timeframe period, and shows the market's true volatility — not one distorted by news and outliers.
How it's calculated:
- A set number of bars is taken (your "ATR Period").
- Paranormal bars are identified: bars that are 2x larger or 3x smaller than the average norm.
- These bars are replaced with neighboring normal bars from the reserve.
- The average range value (High – Low) is calculated.
The result is the cleanest and most realistic volatility reading for the instrument.
🎯 What is it for?
Clean ATR provides several important advantages and completely changes your approach to trading, making it more predictable:
- ✅️ Assessing the level of market manipulation
By the number of replaced paranormal bars (shown in the results as "Paranormal bars replaced (count)"), you can immediately see how "dirty" the period was. The more replacements — the higher the likelihood of manipulation. On higher timeframes (e.g. 1D) this is especially important: if there are many replacements, it's better to skip the trade to avoid getting caught in a "stop hunt." - ✅️ Understanding the current phase of movement
The "Range Activity" indicator shows how actively a coin is working through its average range.
20–40% — the coin is in consolidation and preparing for an impulse.
70–100% — the coin is already moving actively; the market is "wide awake."
Above 100% — an anomaly or the beginning of a strong trending move is possible. In this case, keep a close eye on the coin.
Important: the higher the timeframe, the more weight this parameter carries. - ✅️ Calculating the real remaining move
Based on the Clean ATR, the screener shows Distance Covered / Remaining Distance in LONG and SHORT (in % and points). You can clearly see where there is still potential for movement and where the momentum has already been spent.
This helps you:
— Switch to counter-trend trading in time, when the remaining trending room drops below 30%.
— Assess the probability of a level breakout: if the remaining room is above 70% a breakout is quite realistic. If it's below 30% a breakout is unlikely.
— Stay confident in a trending move when there is still plenty of room left.
— Identify consolidation: if the Distance Covered / Remaining Room values in LONG and SHORT are roughly equal (e.g. around 30–40%), this is an additional signal that the price is in accumulation and the market has not yet decided on a direction. - ✅️ The coin's "breathing" across multiple timeframes
On different timeframes, Clean ATR reveals the full picture, for example:
On 1D — the overall context: how many points the coin travels on average per day, how much room is left, and whether any anomalies occurred.
On 1H — what matters most is not the remaining distance, but the Clean ATR value itself. It helps you accurately understand the size of potential local corrections and set your stop-loss correctly, so it doesn't get triggered by ordinary intraday volatility.
⚡ Which ATR period should you choose?
The ATR Period is the number of recent bars on the selected timeframe (excluding the current unfinished bar) that the screener uses to calculate the Clean ATR. In simple terms: how many recent candles the algorithm uses to calculate the instrument's true average volatility.
It's important to understand the relationship between the timeframe and the ATR period:
- The higher the timeframe — the shorter the ATR period needed.
On a daily chart, a short period is enough to capture the most current volatility (typically the last 3–10 days). - The lower the timeframe — the longer the ATR period can be.
On an hourly chart, a longer period helps understand volatility in a broader context and smooth out noise.
Practical recommendations:
🔥 Short period (3–7 bars) — Ideal for scalping and aggressive intraday trading. Reacts quickly to changes in market regime.
📈 Medium period (7–15 bars) — A universal option for most traders.
🛡️ Long period (15–50+ bars) — Suited for swing and positional trading. Provides stability and smooths out random spikes.
Power Move recommendations:
- 1D → 3–7 (volatility over the past week — maximally relevant)
- 4H → 5–10 (volatility over 1–2 days)
- 1H → 15–36 (volatility over the past day and beyond)
These values produce a Clean ATR that accurately reflects current market reality — both globally and locally within context.
🏆 The main advantage
These are purely arithmetic calculations based on current price data, cleaned of market noise. No subjective interpretation. The more relevant and clean the context — the more predictable the coin's behavior.
You no longer need to pile on dozens of indicators. You clearly see:
- true volatility,
- market noise in the form of anomalies,
- the real boundaries of price movement,
- the current market phase.
As a result, Power Move saves you hours of analysis and delivers exactly the coins that match your settings — from those just getting ready to "fire," to ones already actively trading or pumping right now.