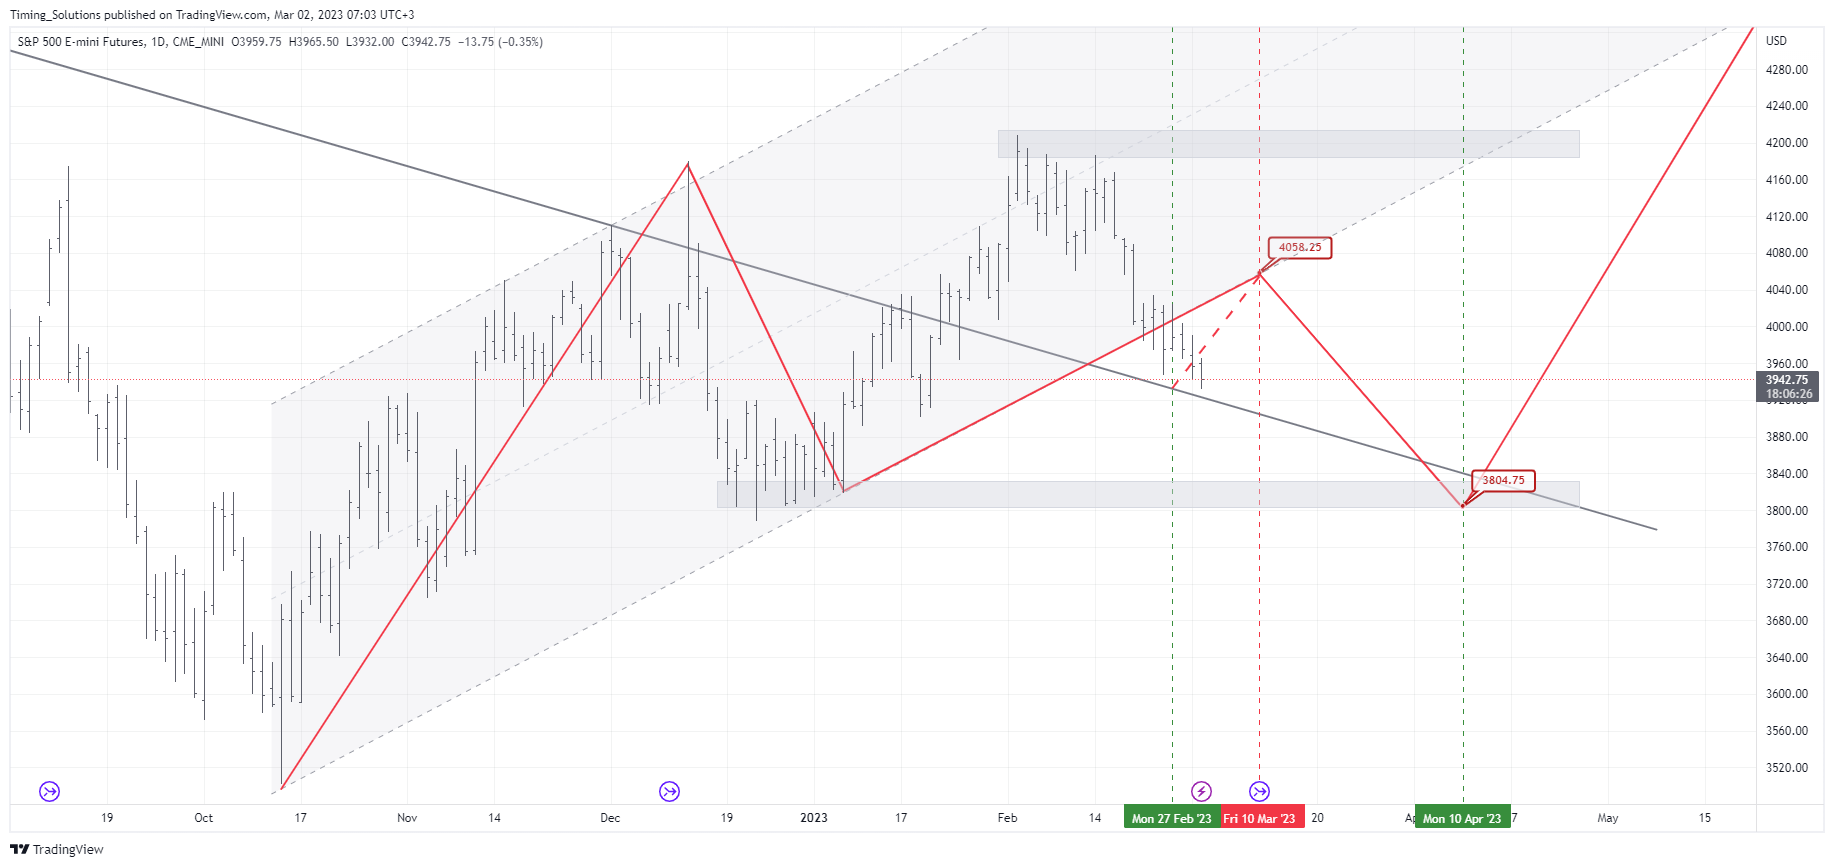
SPX. Where is expected increase?
TS Forecasts. Sergey IvanovFirst of all let's have a look at the price chart from price levels viewpoint. SPX dropped from bullish channel and is currently traded under bottom line. Obtained turning points allow to assume that expected short-run increase is aimed to retest bottom line (approx at 4060) just prior to drop further to 3800.
Thus, we have two basic items of the further price chart forecast:
- we have bearish scenario till the 10th of April;
- the most dynamic growth for a few months is projected from traditional rally started on the 10th of April;
- expected for this and next week bullish is going to be corrective.
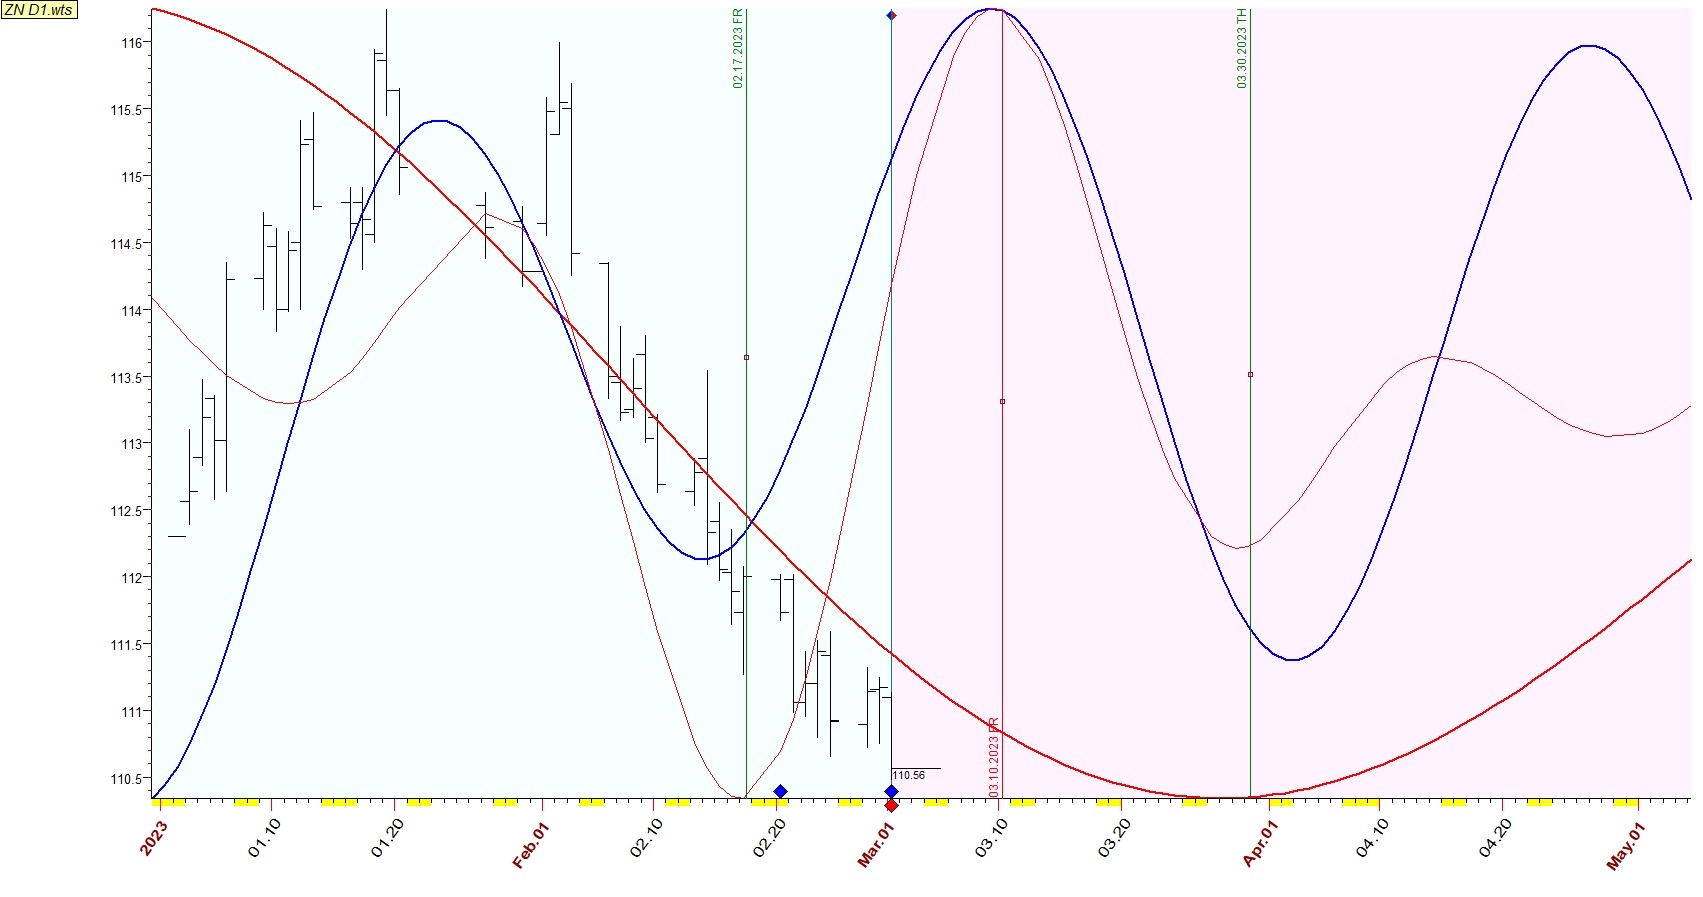
Now, let's find the correspondent foundations from cycles viewpoint. Talking about adjacent markets we have to consider T-bonds and VIX charts to get aligned forecasts. Indeed, TNX current decline is developing in divergence toward projection lines: fast cycles blue line and seasonality thin red line. Remember, that 10Y T-bonds are highly affetced by seasonality. So, it is reasonable to expect a sharp bullish swing to work out this divergence, but not longer than by the end of the next week. The rest month is going to be bearish for T-notes to turn bullish into long-run growth from April.
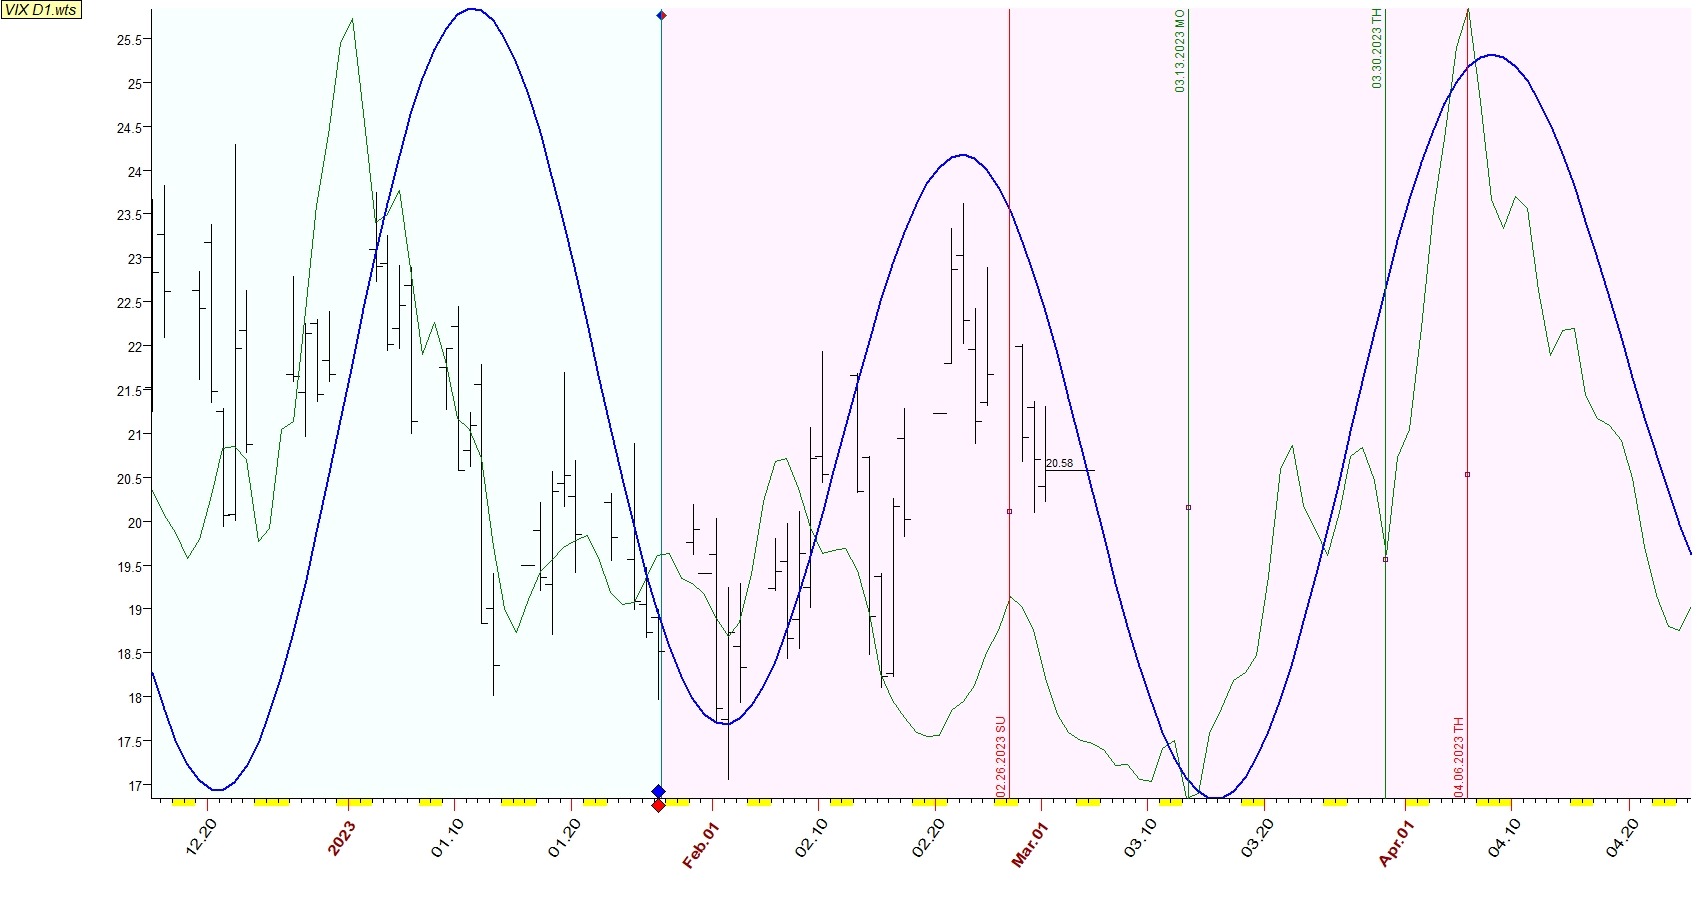
Second, VIX chart is clearly inder bearish presure from highly effective fast annual cycles blue line and astro composite green line. Coincided bullish turning point is projected as a responce to the next FOMC meeting announcement and will be accomplished right to the date of expected April's markets rally.
Finally., SPX daily chart. This is fast cycles composite blue line in a couple with similarity vs gold violet line. Here we may see that expected bullish short-run swing stays intact to get completed by the end of the next week and turn down till April 10th.
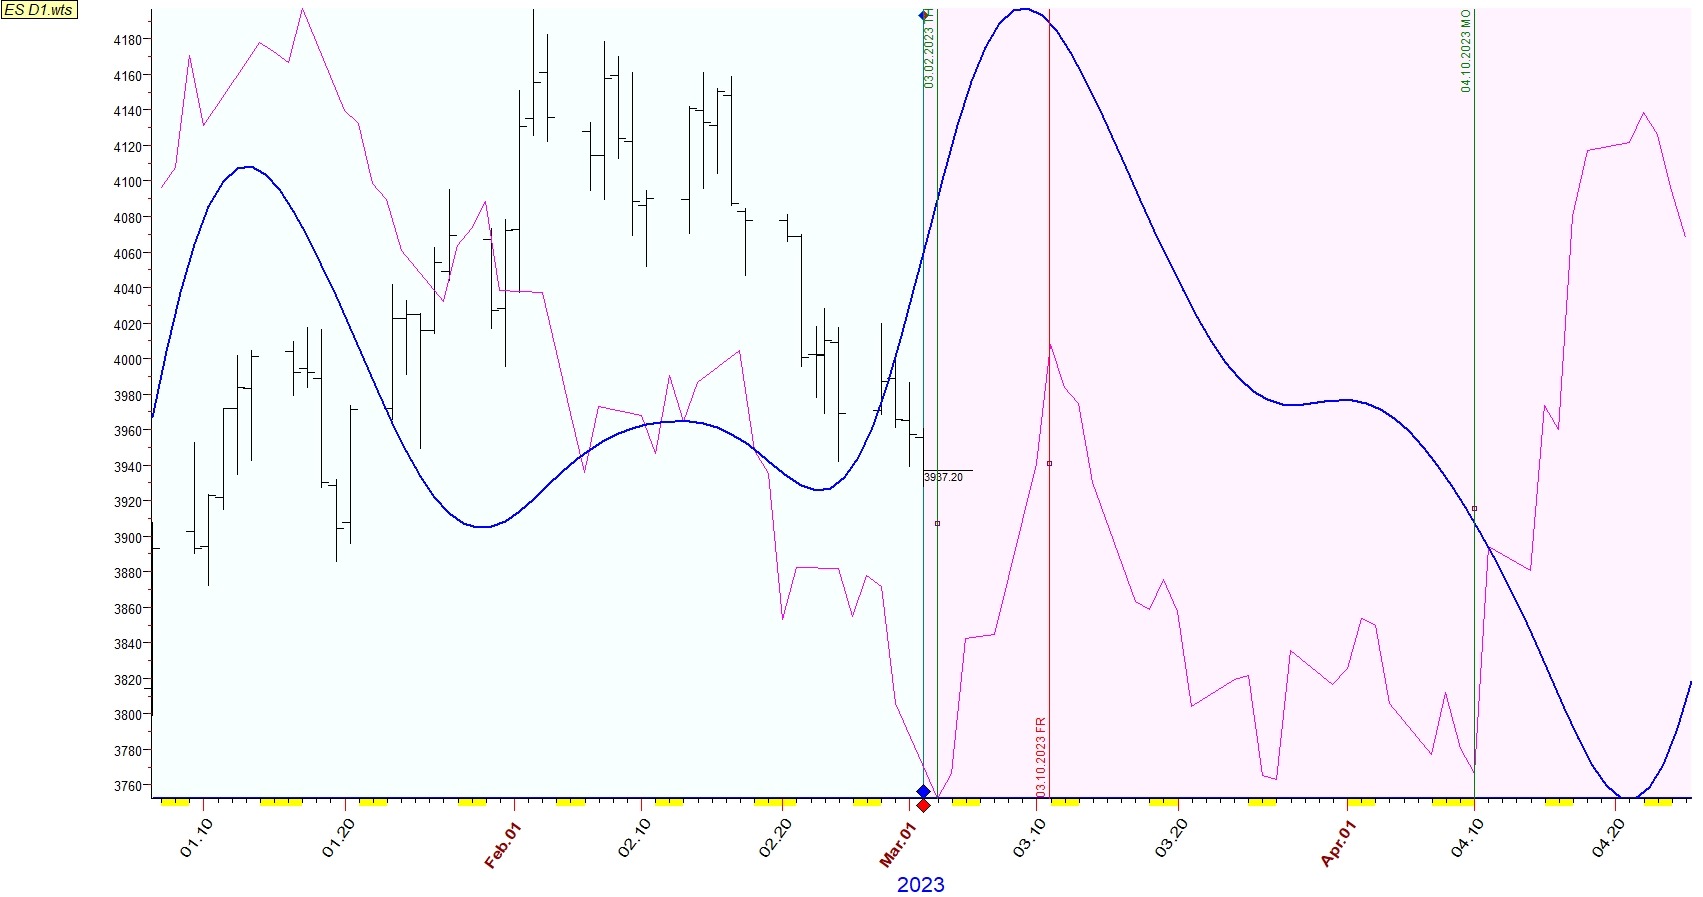
This chart becomes more reliable if wee look at these lines joint work into greater scale.
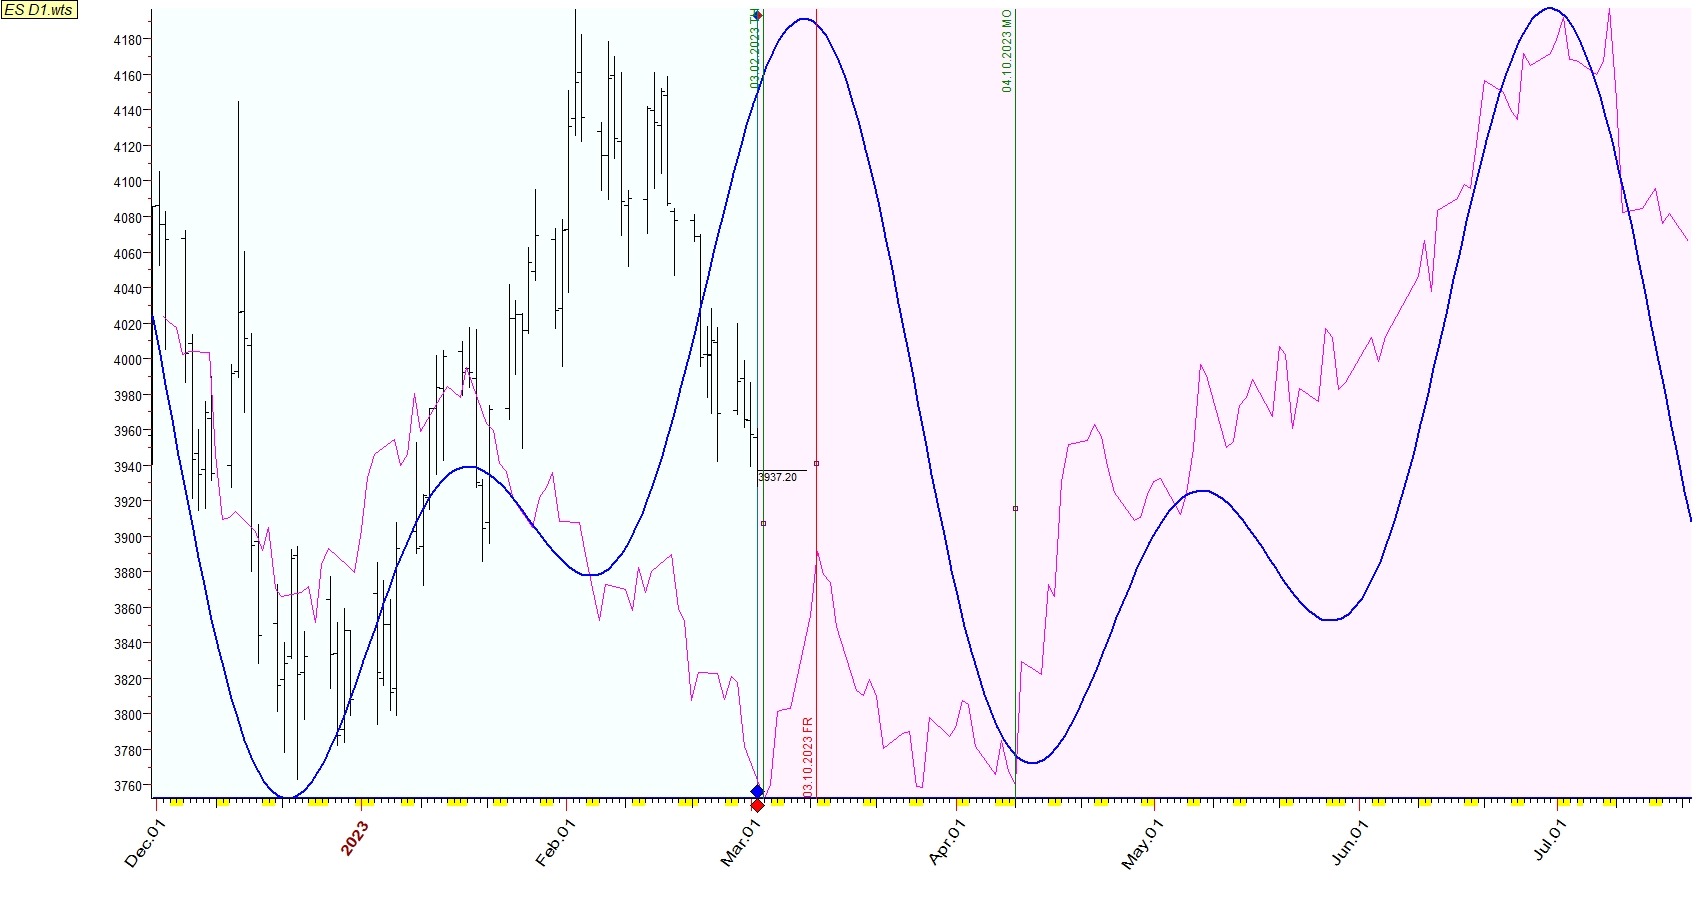
We definitely may state that a single up-n-down stage is left to turn price upwards into stable growth from April till July.
Approximately the same outcome might be obtained from ES weekly chart where fast cycles composite blue line in a couple with astro composite green line suggest bearish turn from the middle of March to turn bullish in April.
