Ripple Price Analysis
Zerononcense
Its been a while since we’ve looked at Ripple, so let’s see what’s going on with those guys underneath the hood.
We’re going to start off with the BTC pairing.
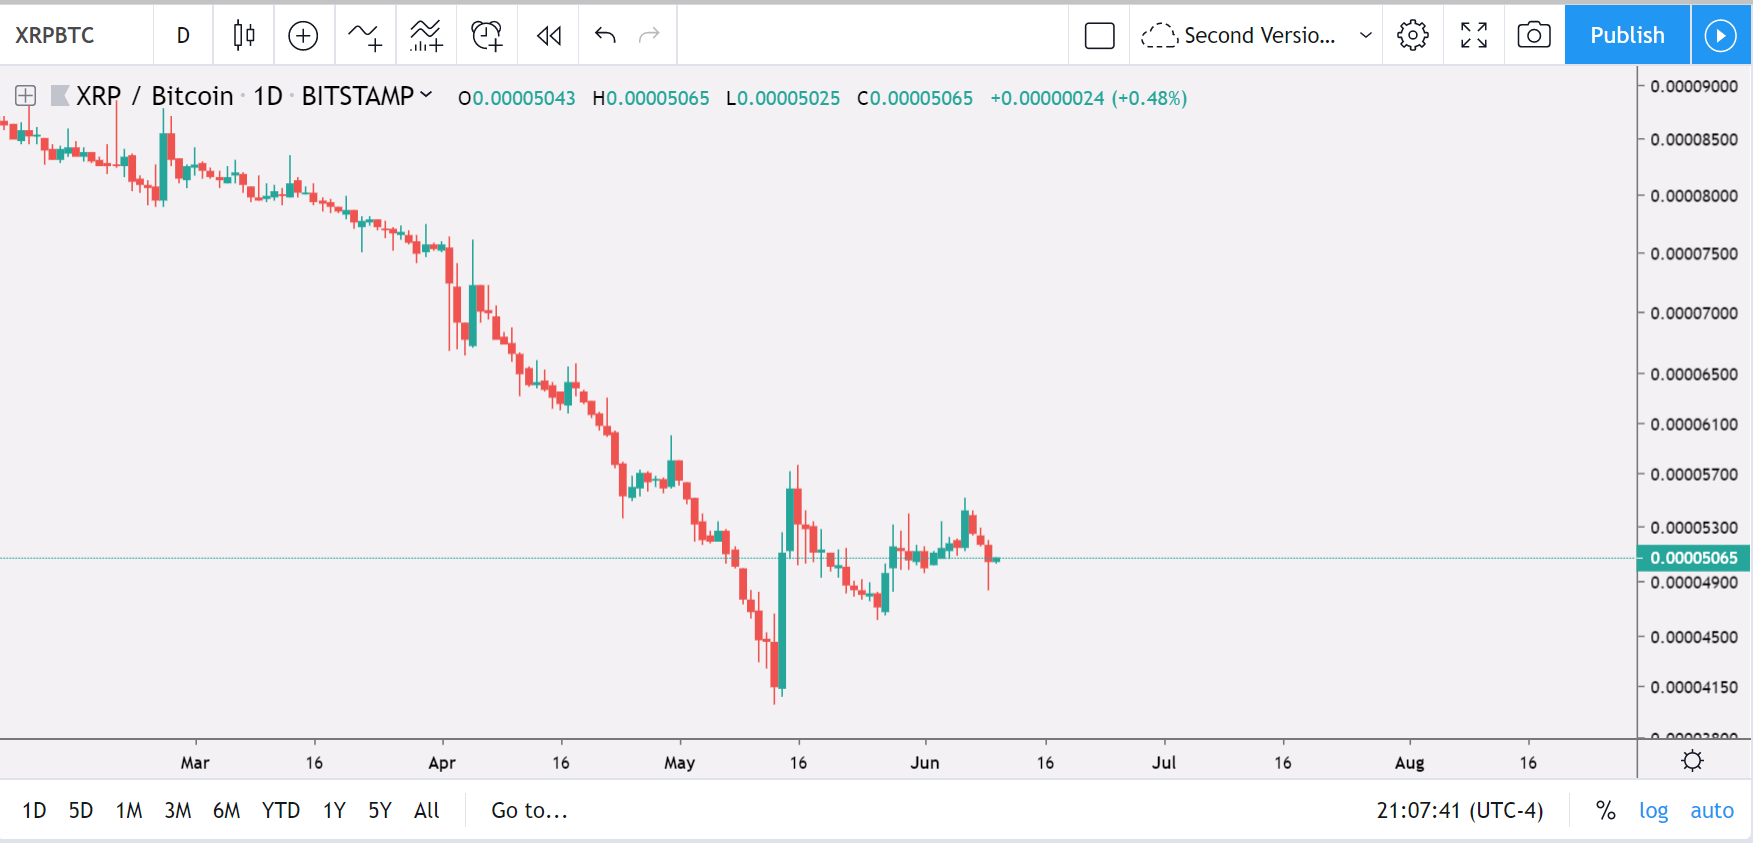
Upon first sight, its far from the prettiest chart that we’ve ever looked at, but it does look like there’s been some positive price action as of late, so let’s take that in stride.

Since May 13th, 2019, XRP/BTC has finally turned things around for a (somewhat) sustained period of time and is up approx. +24% since the low that it hit on that day.
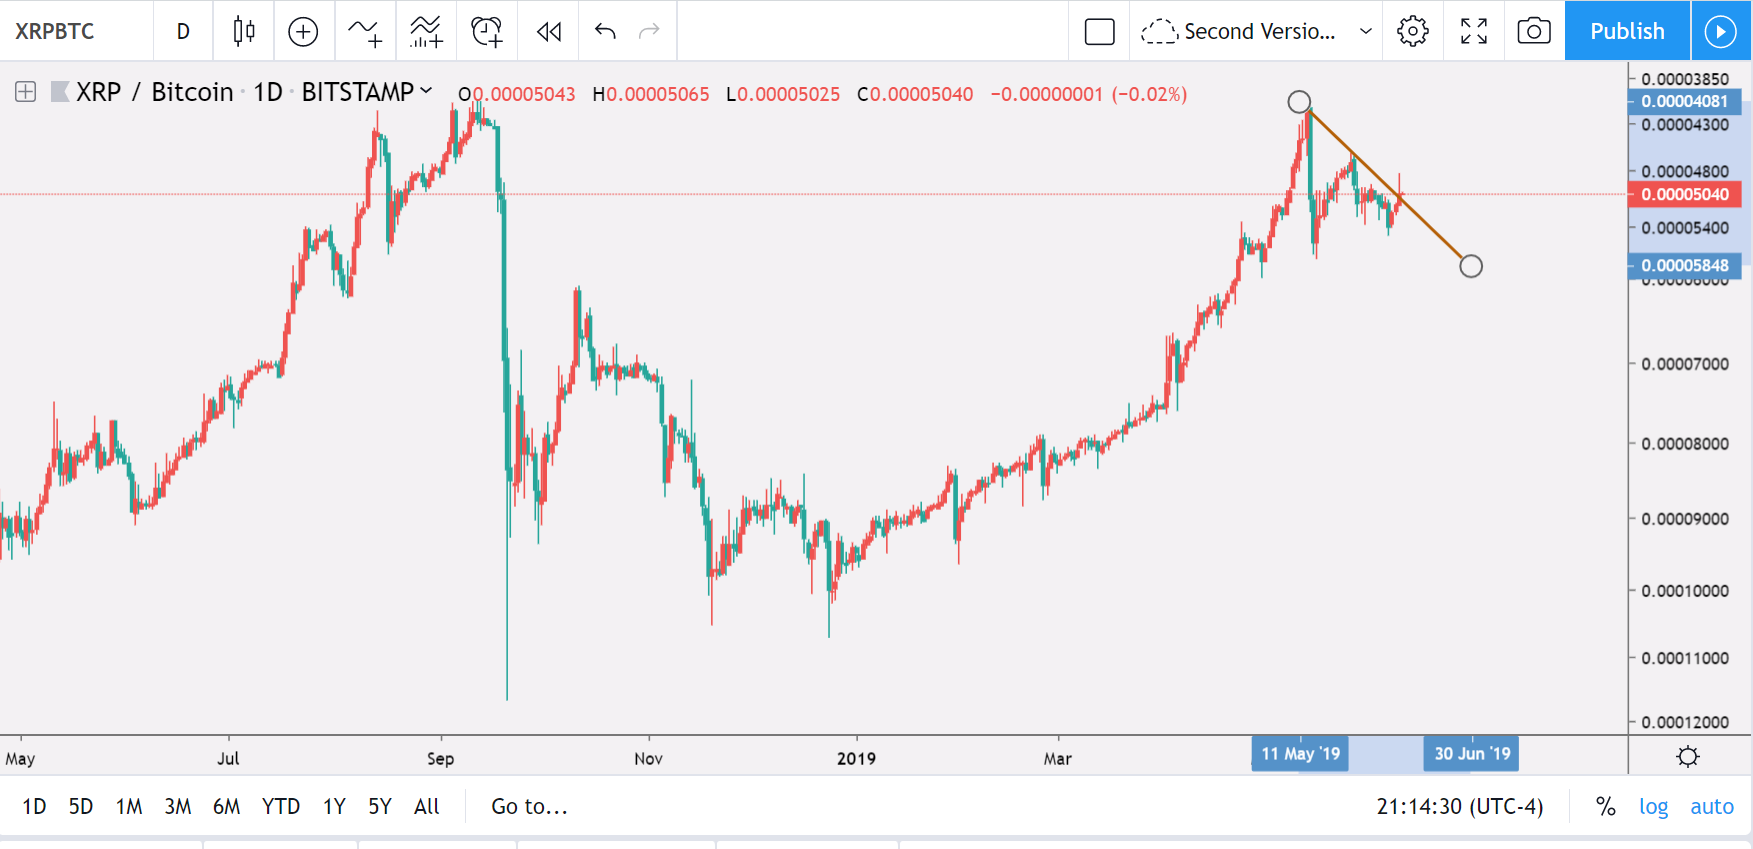
Potential Bear Pennant Forming for XPR/BTC (Daily Resolution)
This obvious potential bear pennant must be noted:


This looks awfully close to a bear pennant of sorts, but it may not be one exactly. Let’s go ahead and see what other things we can deduce from the XRP/BTC chart on the daily resolution.
Inverted Scale
In order to get a better idea for what may happen in the near future, let’s try to remove (or flip) or current biases by inverting the scale (turning it upside down; this is a feature on TradingView).
At face value, it appears that the price is looking to break out beyond the overhead resistance.
Considering the fact that this is an inverted chart, this is essentially akin to saying that it looks like the price is going to break out below (non-inverted; normal).
Two reasons for why this can be suspected are:
- The price has been nudging against that overhead resistance pretty heavily
- We can see a long wick sticking out of the north side of the last daily candle that formed for XRP/BTC. There is no such wick to the south of that candle. This is generally an indicator that the bulls (on the inverse) are winning. So, that means, in reality, the bears are winning in this situation.

Now let’s check out the volume here as well to see if there are any sharp increases that we should be watching for:

From what we can see? Yes, the volume is increasing as well.
We have no idea what’s going to happen on the next daily candle (because it just started as one can see), but placing a long position on the regular XRP/BTC charts would be foolish at this point.
Normal Chart Outlook for XRP/Ripple Again
Relative Strength Index (14)
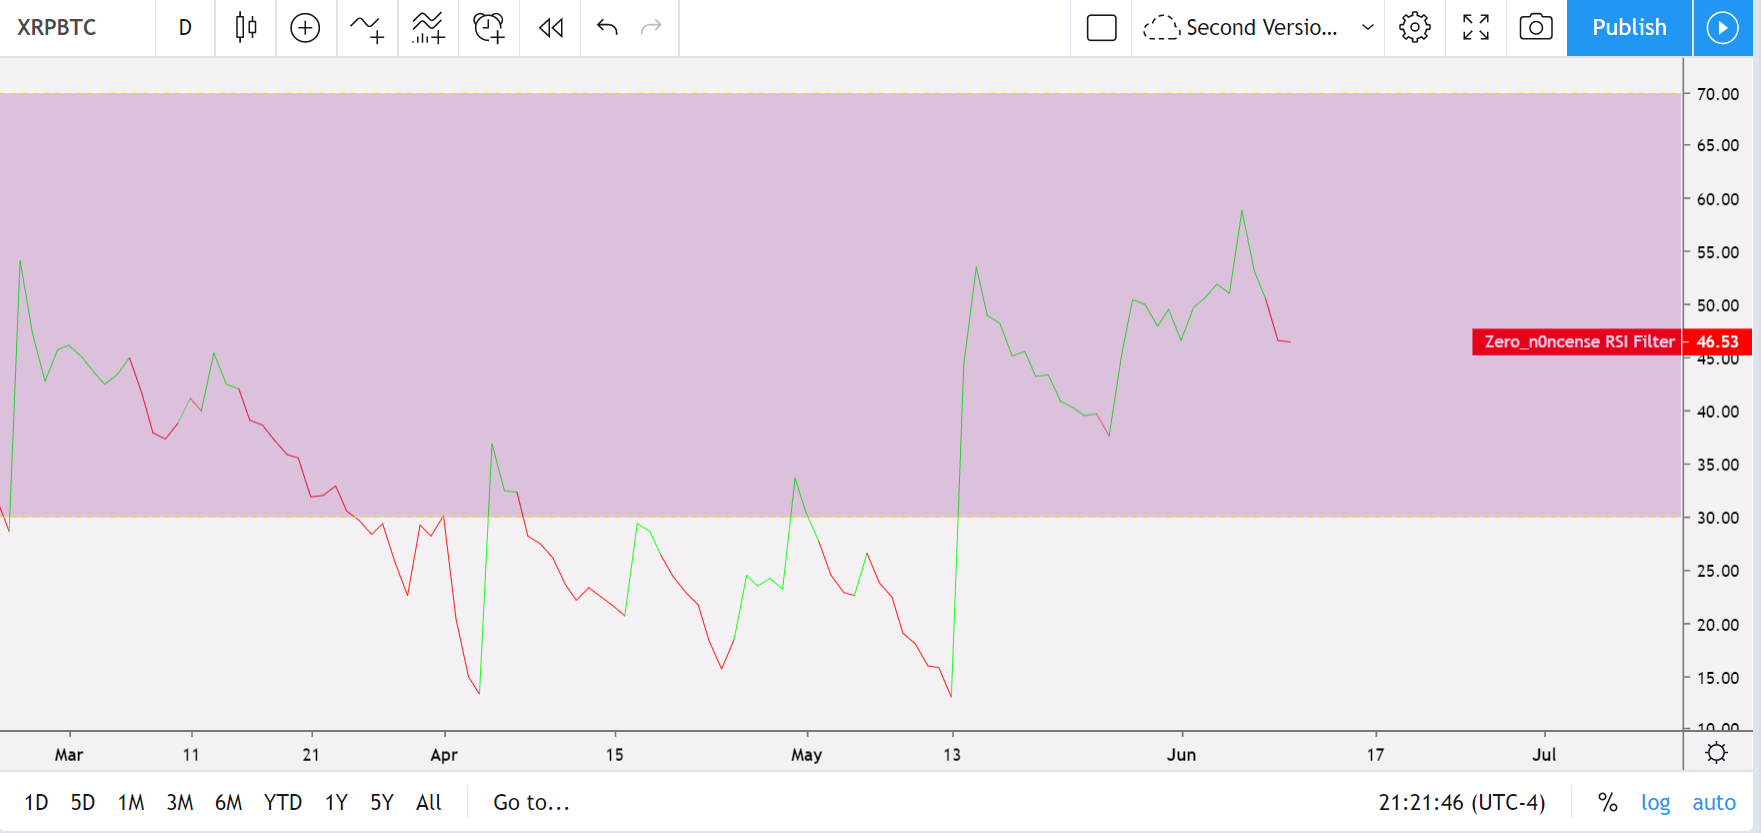
The Zerononcense RSI has signaled a sell for the RSI(14). For whatever reason, XRP/BTC RSI has not adhered to the normal conventions of the RSI indicator (in terms of trend/direction/etc.), so we’re going to take this at face value.
Balance of Power RSI
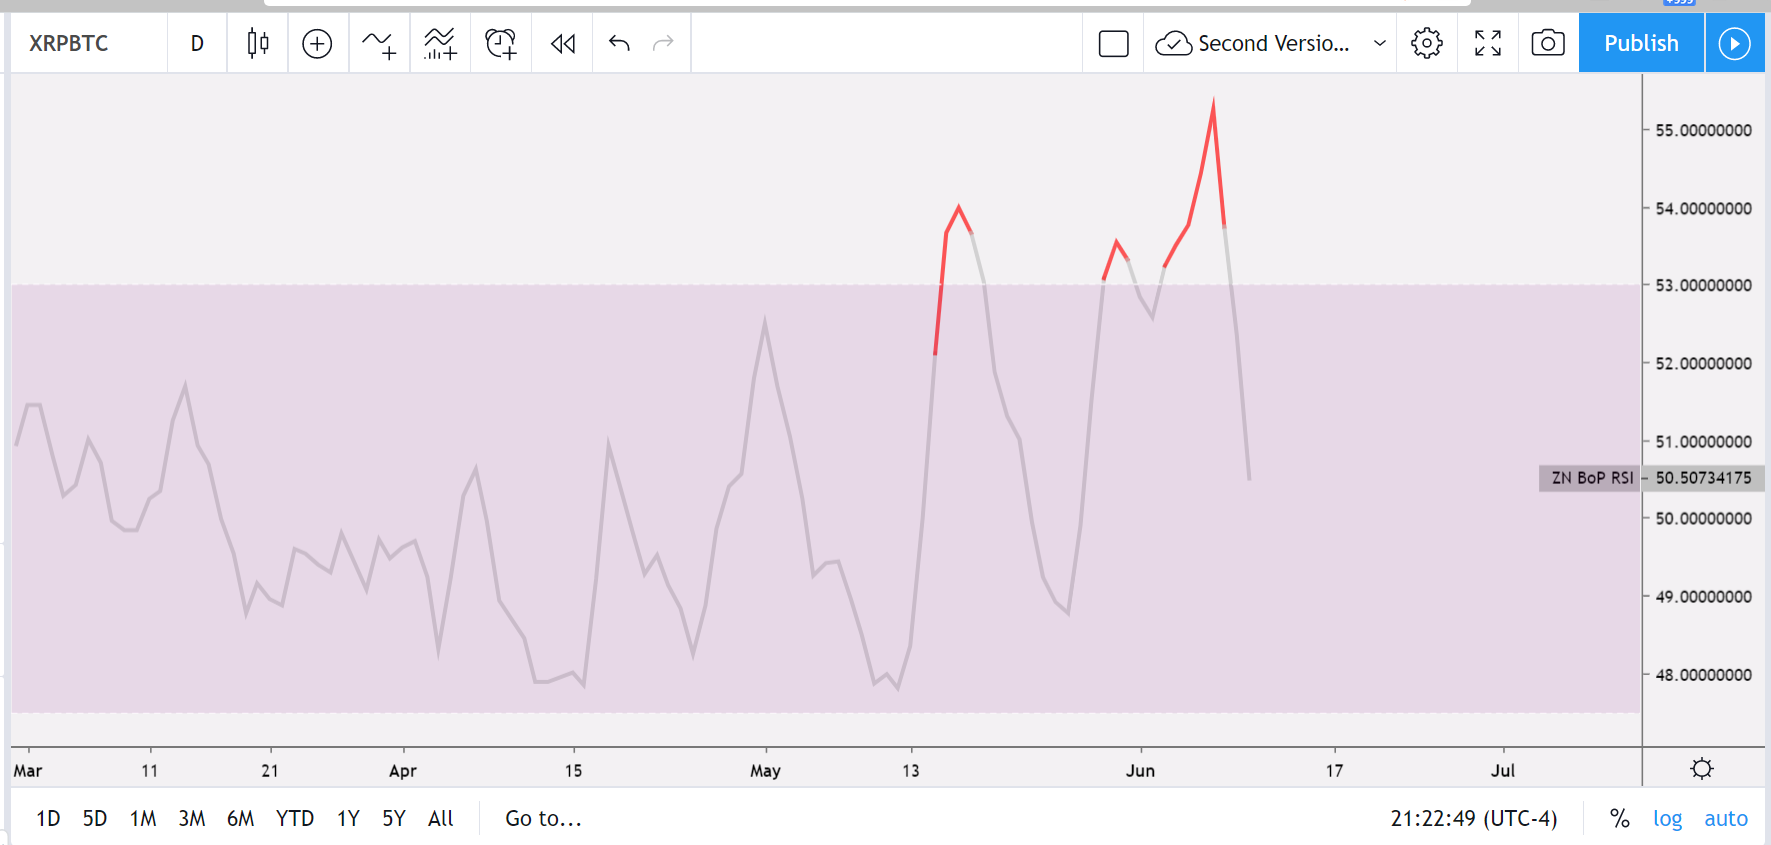
The Balance of Power RSI has plummeted south over the last few periods as well. This indicates heavy sell pressure on XRP/BTC. Not good for bulls, once again.
Cryptomedication Volatility RSI is also headed south and has signaled such as well. Yet another indicator of impending negative price action.
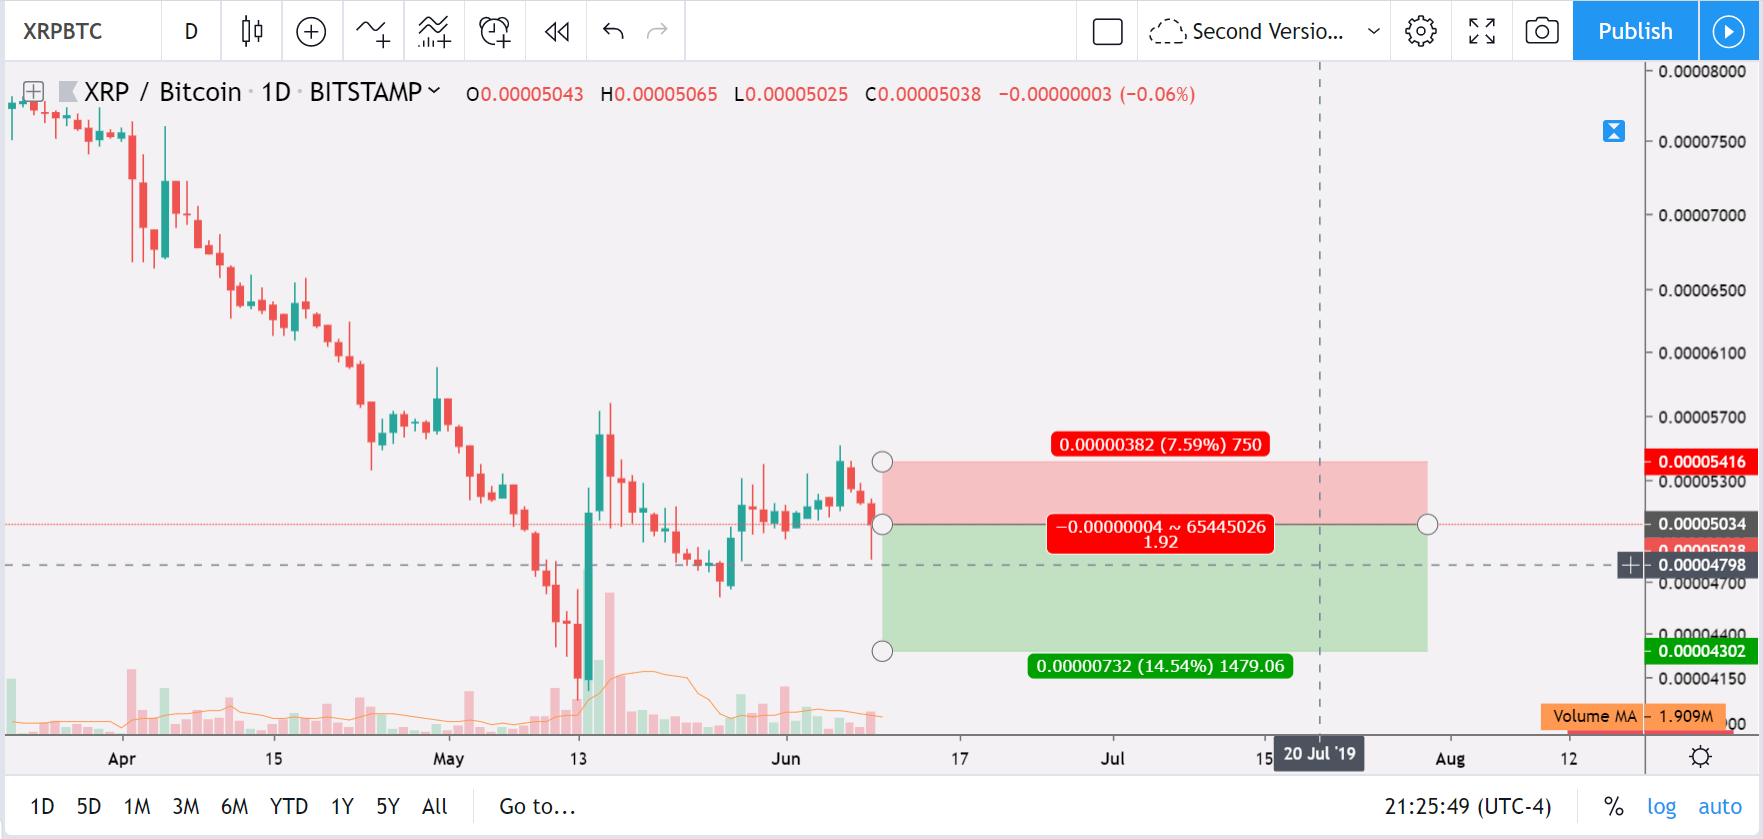
Conclusion
Zerononcense is short on XRP/BTC and perhaps XRP itself as well.
Our first short target = 4300 satoshis.
The price is currently at 5038 satoshis at the time of writing.
The S/L is at the 5400 sats.