Python可视化笔记43篇合集(建议收藏)
zhuanlan.zhihu.com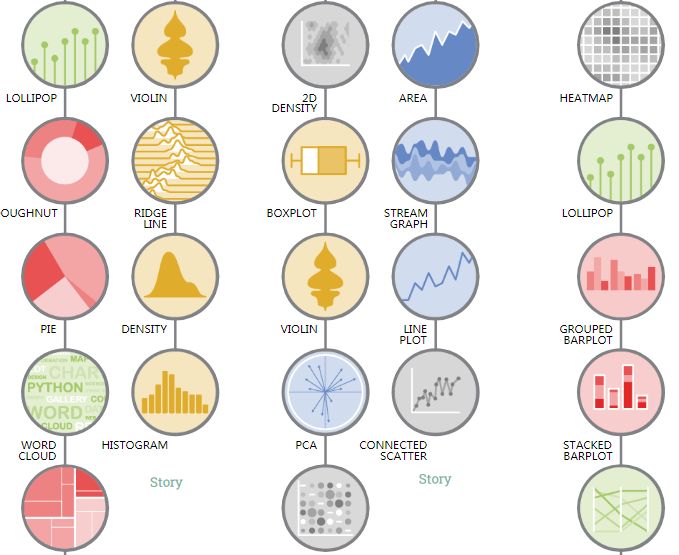
2021年04月14日更新~
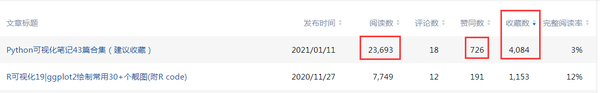
本文现在阅读已经破10W+了,收藏破1.5W,收藏记得点赞哈。python可视化系列现在已经有60+篇了,可前往公众号: pythonic生物人阅读~
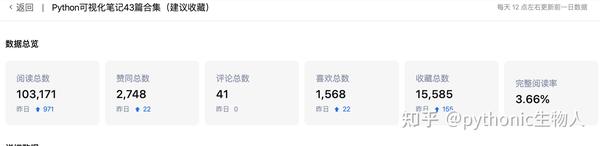
莫名的火了,这可是小编牺牲了大量游戏时间的成果,收藏的同时记得点赞~,更好阅读体验可关注公众号:pythonic生物人,欢迎分享给更多小伙伴~~
❝
本文汇总之前所有的「Python可视化保姆级笔记43篇」,加上简单介绍,方便查询。
为什么我会写这么多篇的Python可视化笔记,起因是年初为了给SCI绘图,尝试了一下Python的Matplotlib,感觉很好用,然后就将「Matplotlib、Seaborn、Pygal、Plotnine」系统梳理了一遍。
详细请点原文,精进请去官网。
❞
更多精彩合集戳~
[Python」数据科学基础笔记27篇合集
「R基础及可视化」笔记25篇全集
「NGS基础」笔记合集~~「更新ing」
「Perl」基础与生物信息学笔记19篇合集
本文目录
各篇简介
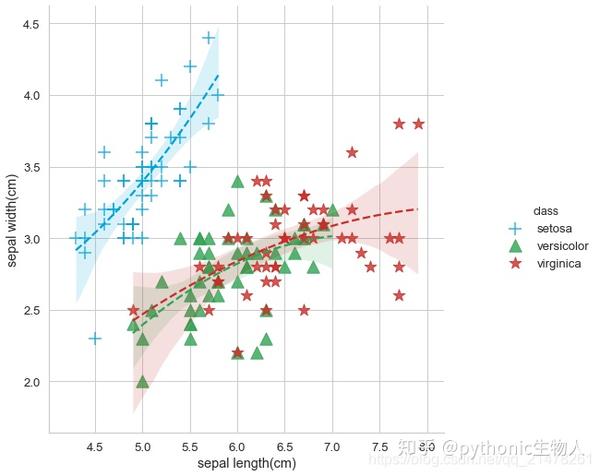
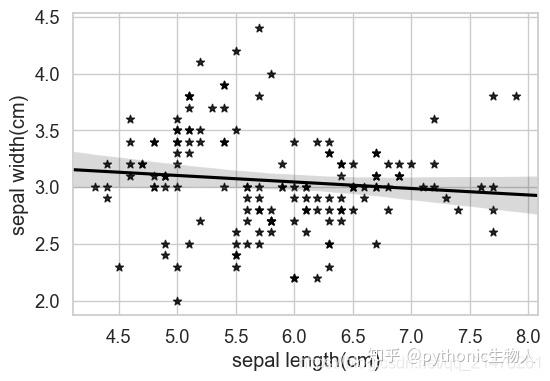
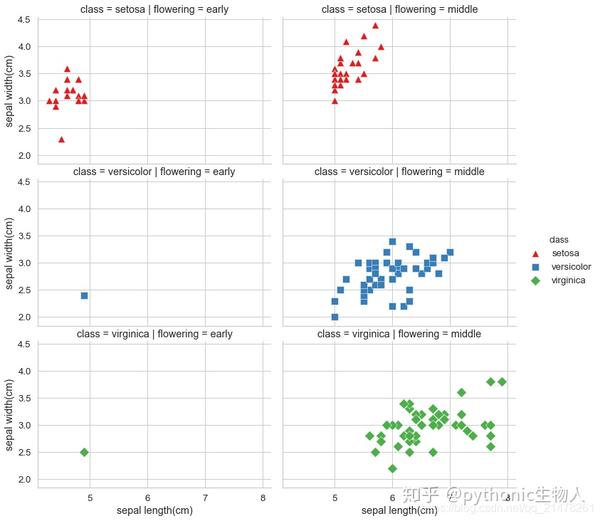
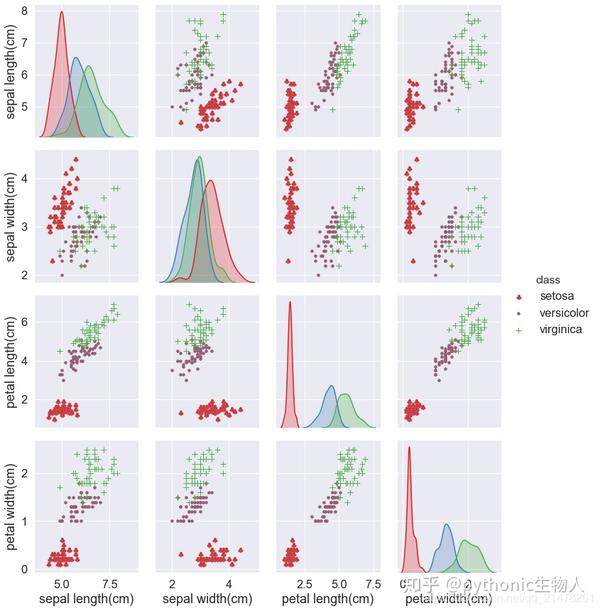
Python可视化43|「plotnine≈Python版ggplot2」
- plotnine是图层图形语法(The Grammar of Graphics)在python中的实现,是ggplot2的python版,使用方法和ggplot2几乎一样。
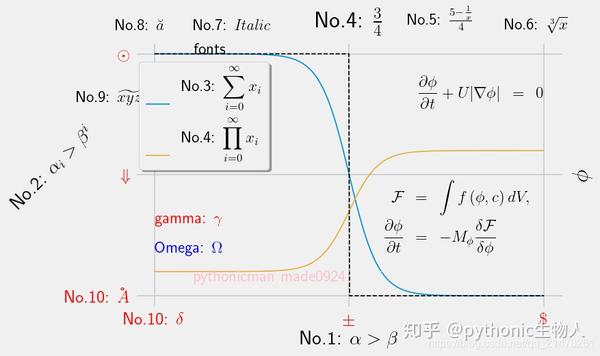
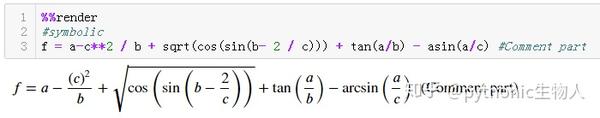
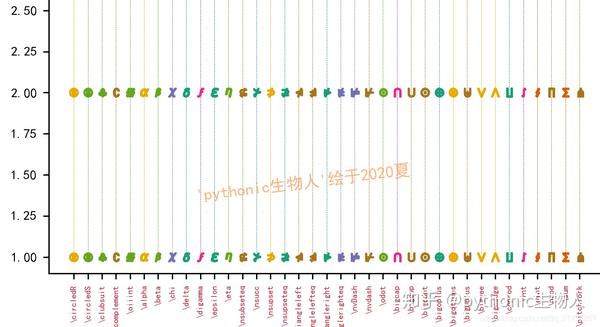
Python可视化|Matplotlib40-「LaTeX」 in Matplotlib和python
- 多种方式实现在图形中添加latex字符、数学公式等。
Python可视化|Matplotlib39-Matplotlib 1.4W+字教程(珍藏版)
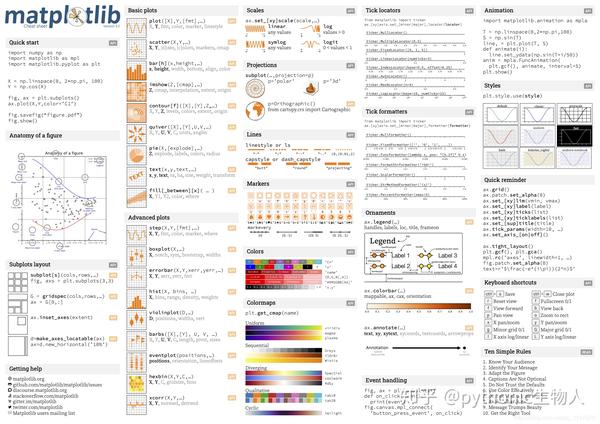
Python可视化|Matplotlib38-Matplotlib官方Cheat sheet(上篇)
- 快速掌握常见图绘制,没啥好说的精华中的精华。
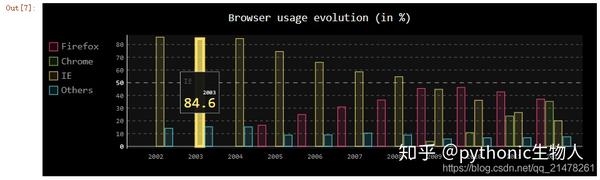
- python的另一个可视化库pygal,专注于SVG图,擅长交互。
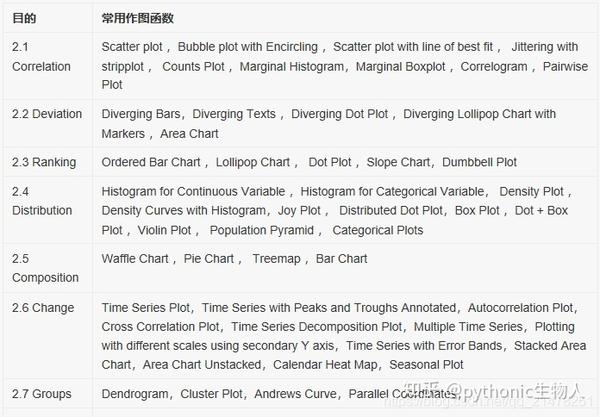
Python可视化35|matplotlib&seaborn-一些有用的图
- 常见50个图形基于Matplotlib和Seaborn实现【含代码】,归为7大类。
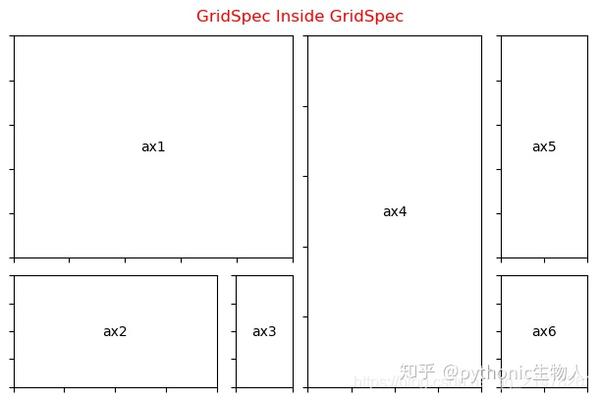
Python可视化34|matplotlib-多子图绘制(为所欲为版)
- 随心所欲的拼图
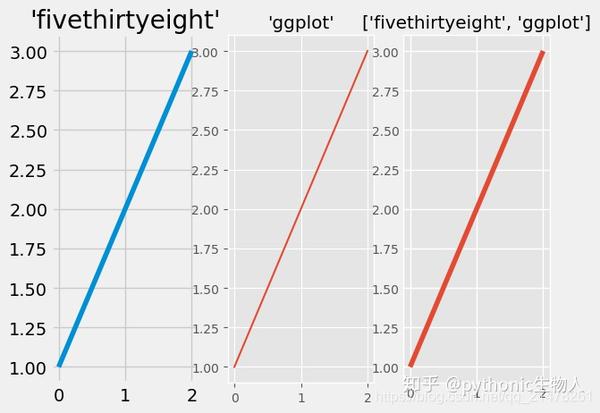
Python可视化33|matplotlib-rcParams及绘图风格(style)设置详解
- 灵活使用「绘图风格(style)「及」rcParams」设置
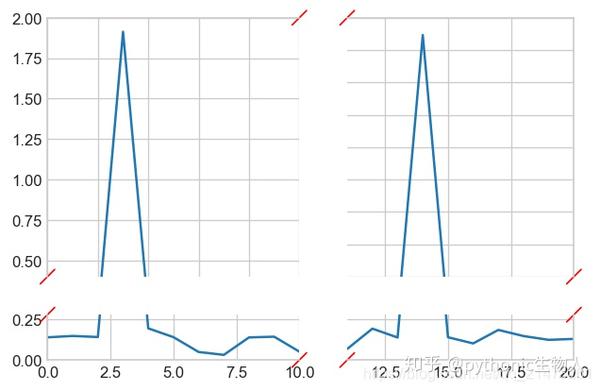
Python可视化32|matplotlib-断裂坐标轴(broken_axis)|图例(legend)详解
- 绘制坐标轴断裂图
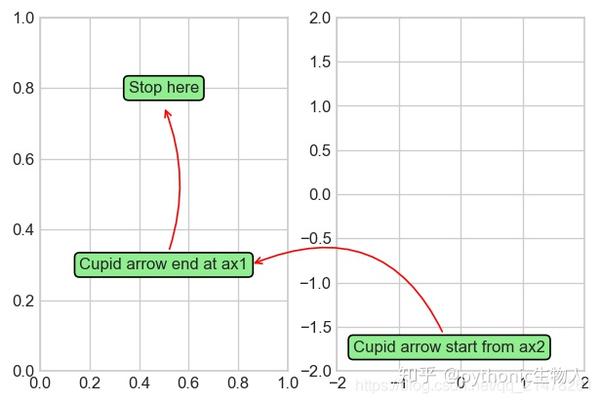
Python可视化31|matplotlib-图添加文本(text)及注释(annotate)
- 自由往一张图添加「注释文字、指引箭头。」
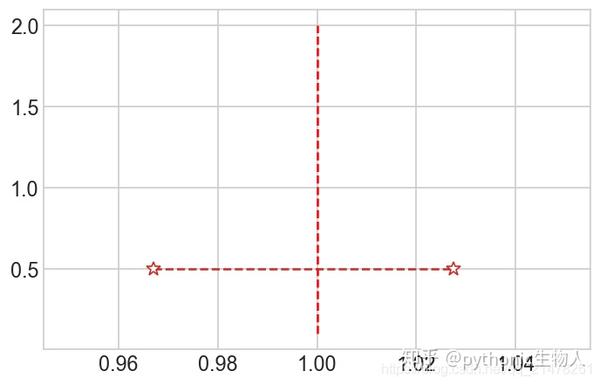
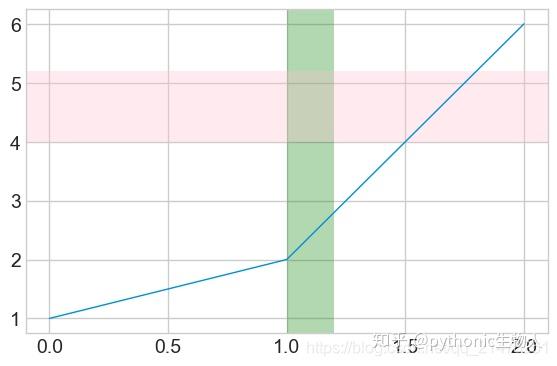
Python可视化30|matplotlib-辅助线(axhline|vlines|axvspa|axhspan)
- 往图形添加辅助线。
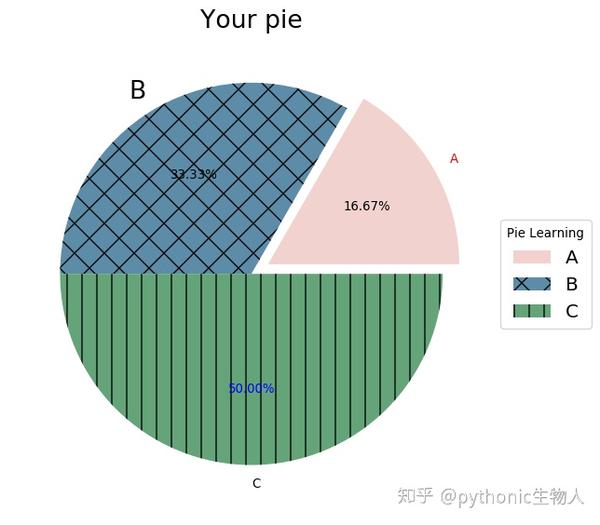
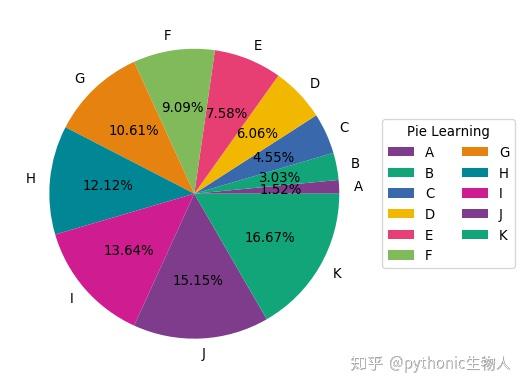
Python可视化29|matplotlib-饼图(pie)
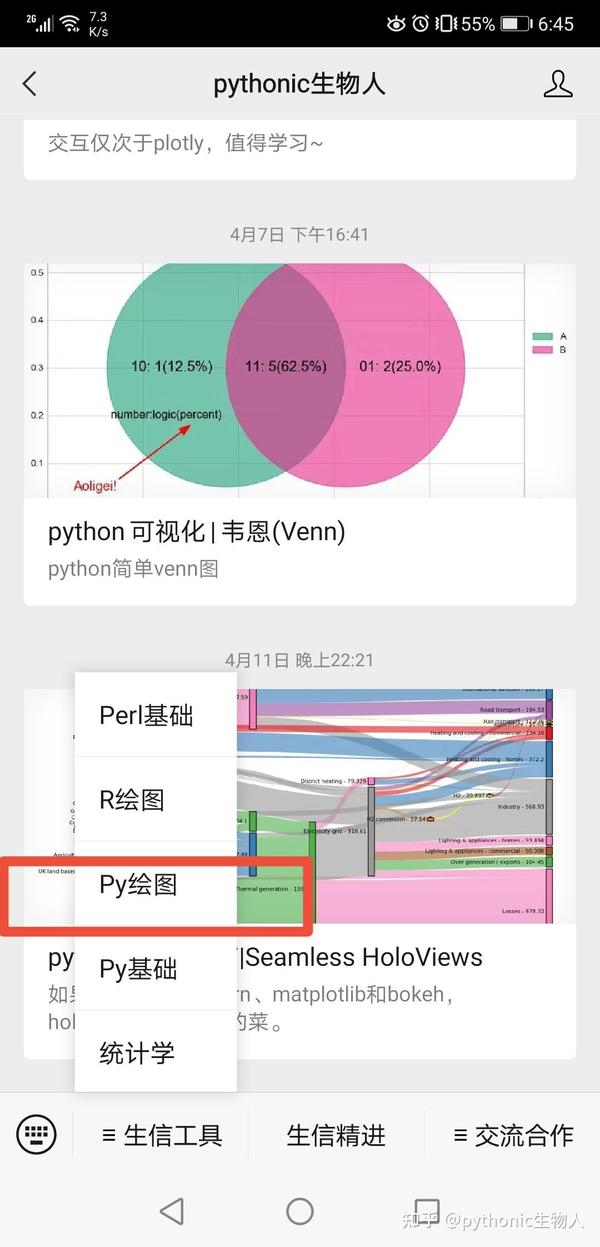
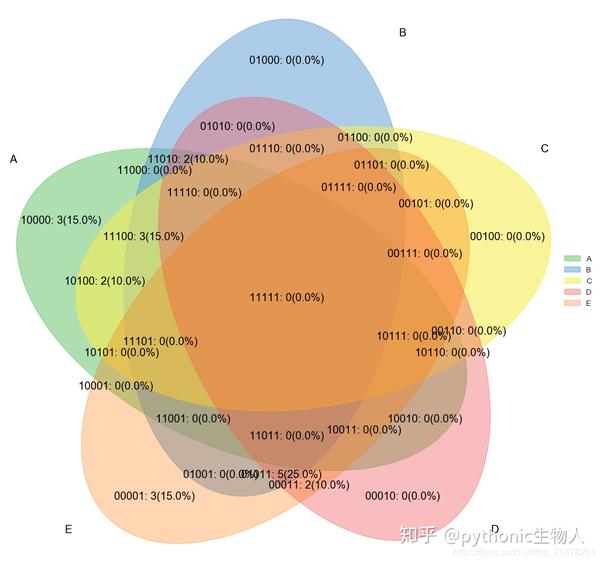
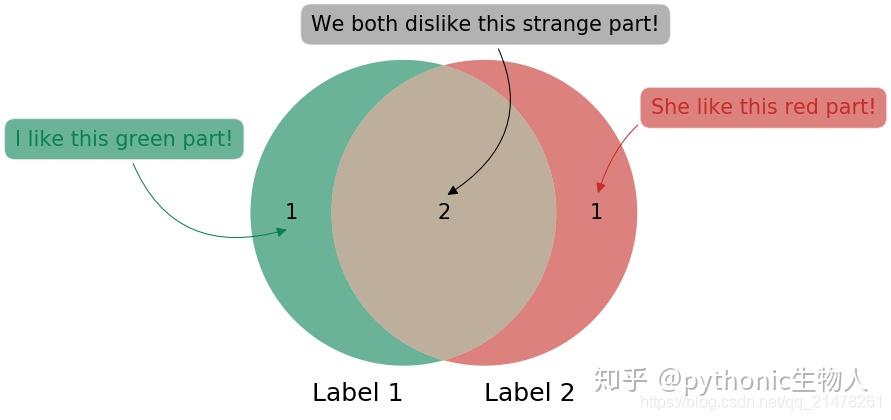
Python可视化28|matplotlib绘制韦恩图(2-6组数据)
Python可视化26|seaborn绘制分面图(seaborn.FacetGrid)
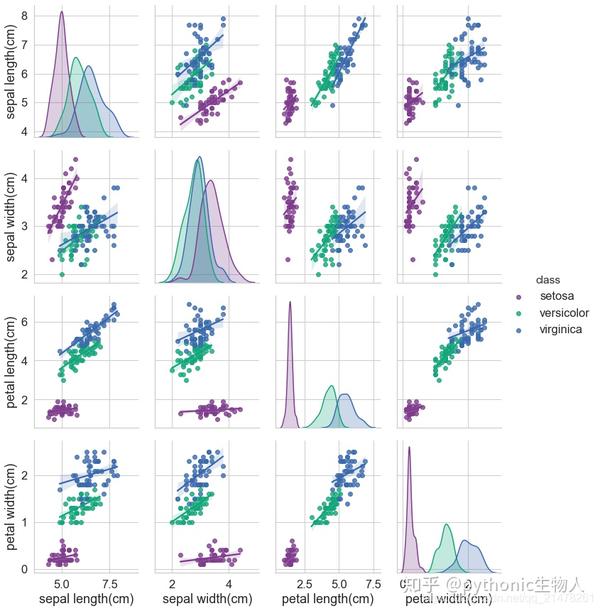
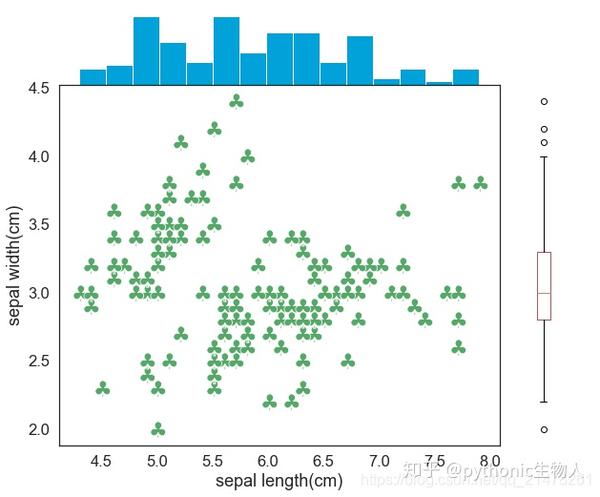
Python可视化24|seaborn绘制多变量分布图(jointplot|JointGrid)
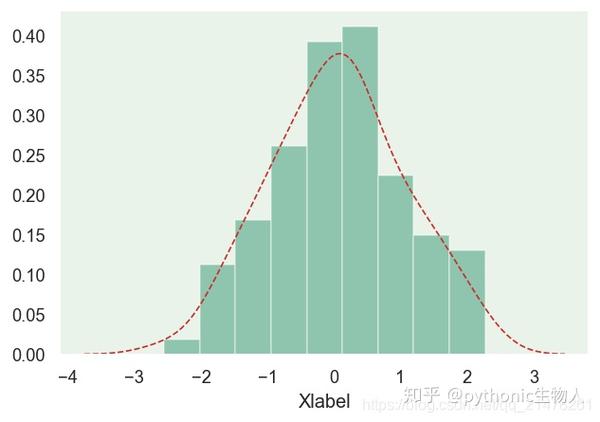
Python可视化23|seaborn.distplot单变量分布图(直方图|核密度图)
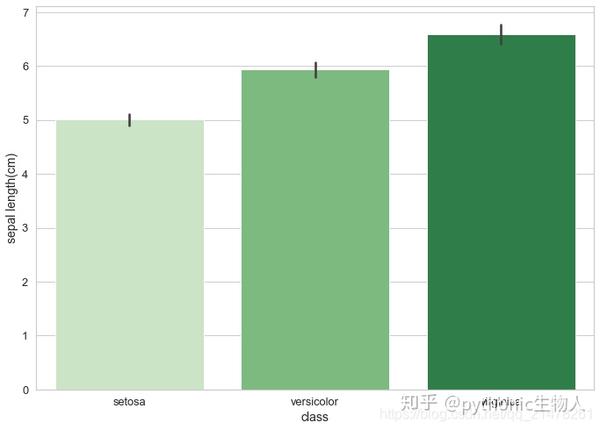
Python可视化22|Seaborn.catplot(下)-boxenplot|barplot|countplot图
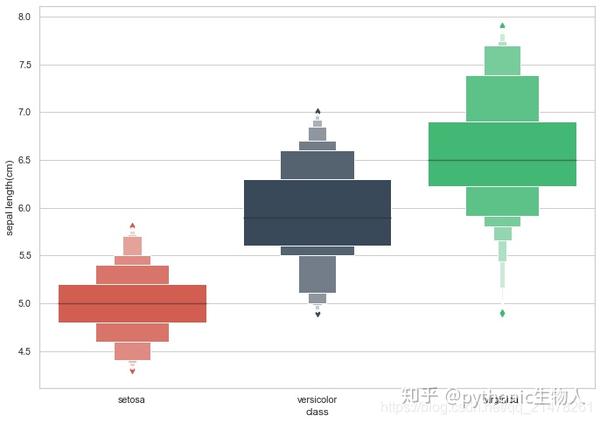
Python可视化21|Seaborn.catplot(上)-小提琴图等四类图
- seaborn「图形外观、图形缩放」设置。
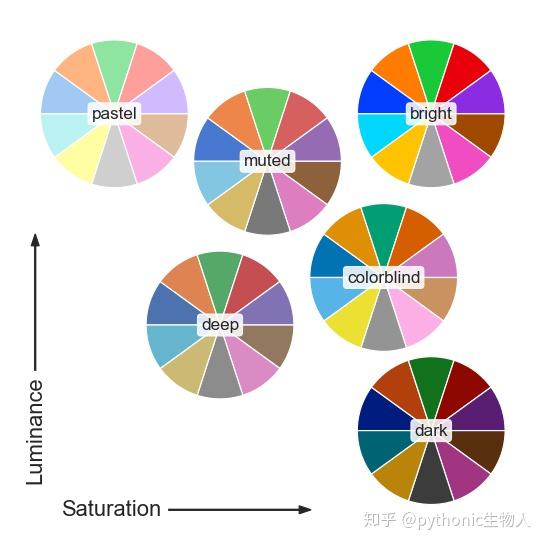
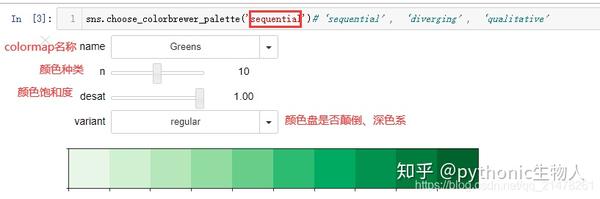
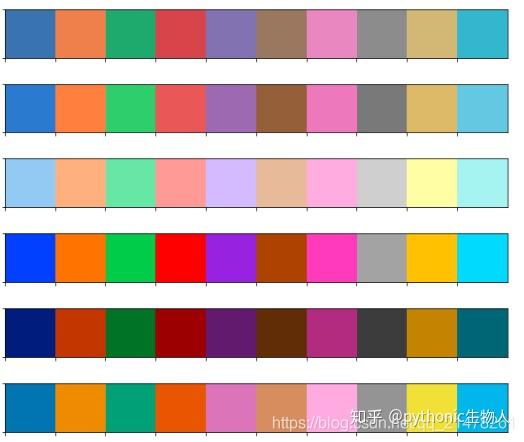
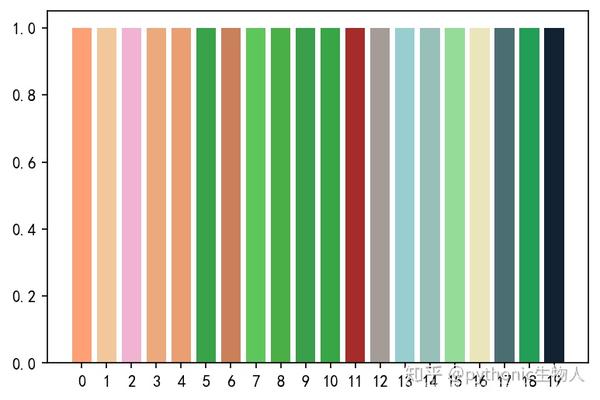
Python可视化18|seborn-seaborn调色盘(六)
- 系统介绍seaborn调色盘

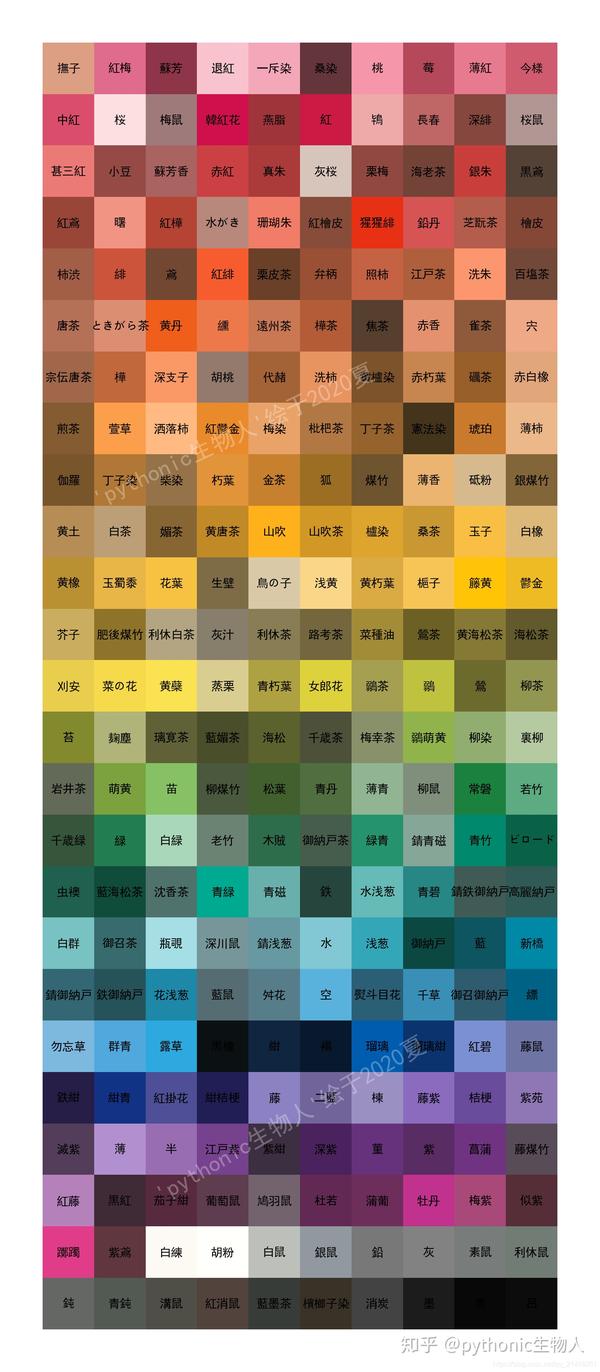
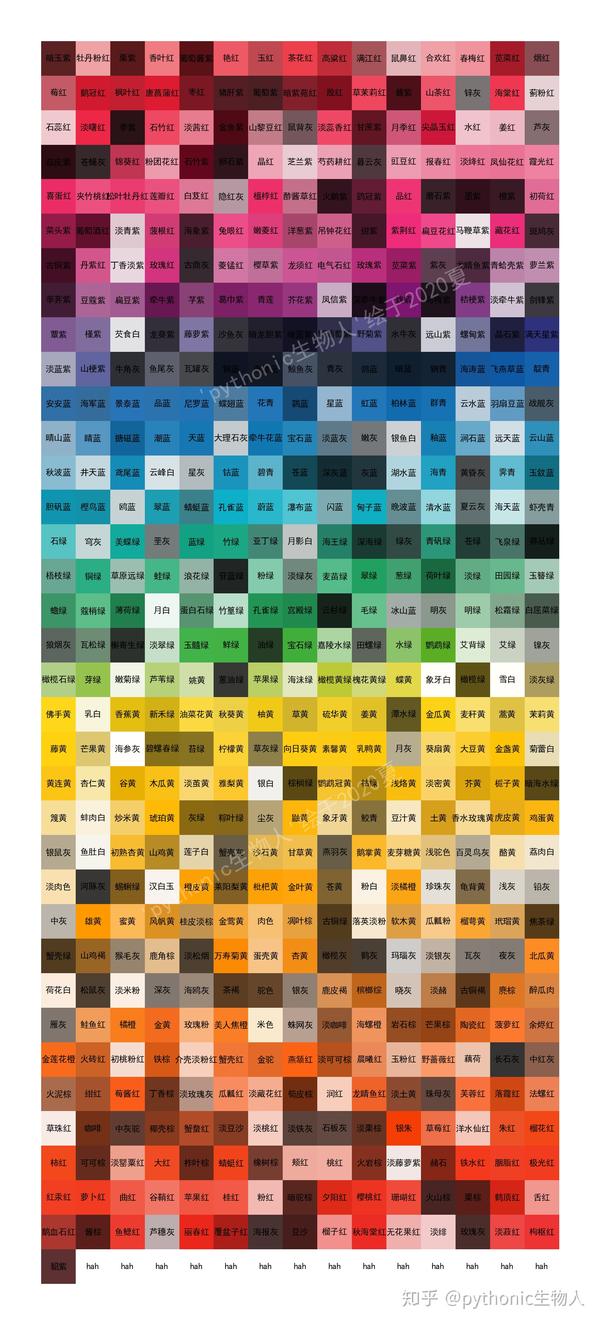
食色性也-颜色小抄免费大放送(二)
食色性也!颜色小抄免费大放送(一) Python|R可视化|09-提取图片颜色绘图(五-颜色使用完结篇)


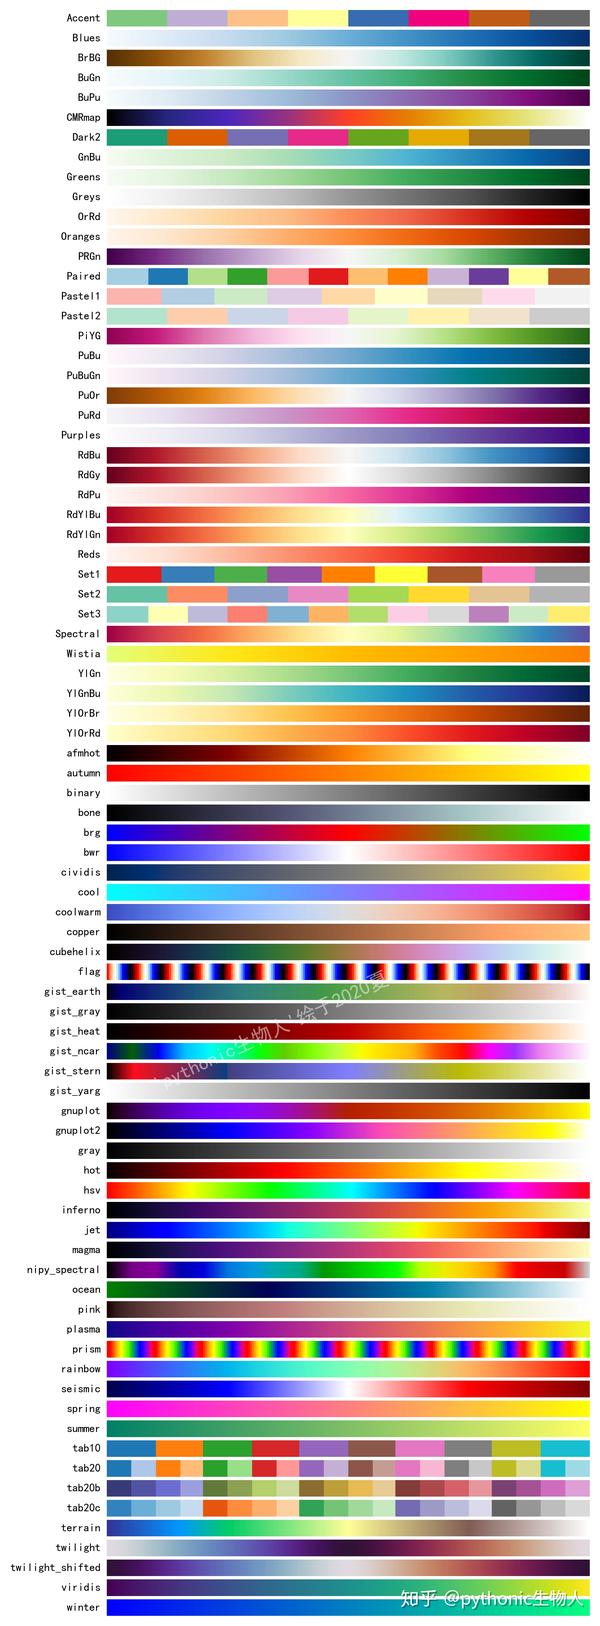
Python可视化|08-Palettable库中颜色条Colormap(四)
- 专业python配色库。
Python可视化|matplotlib07-自带颜色条Colormap(三)
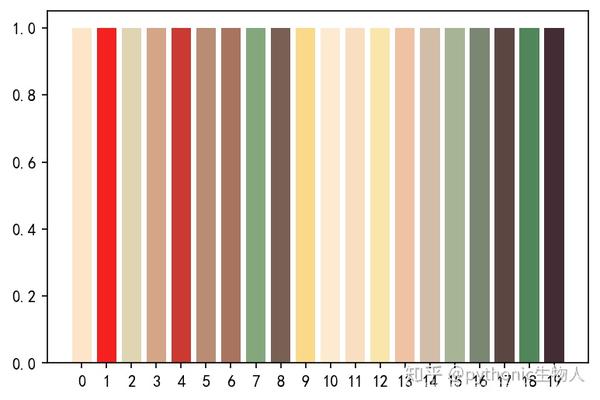
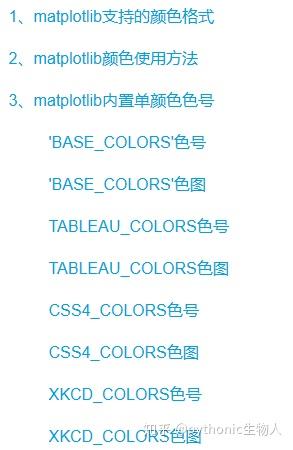
Python可视化|matplotlib06-外部单颜色(二)
Python可视化|matplotlib05-内置单颜色(一)
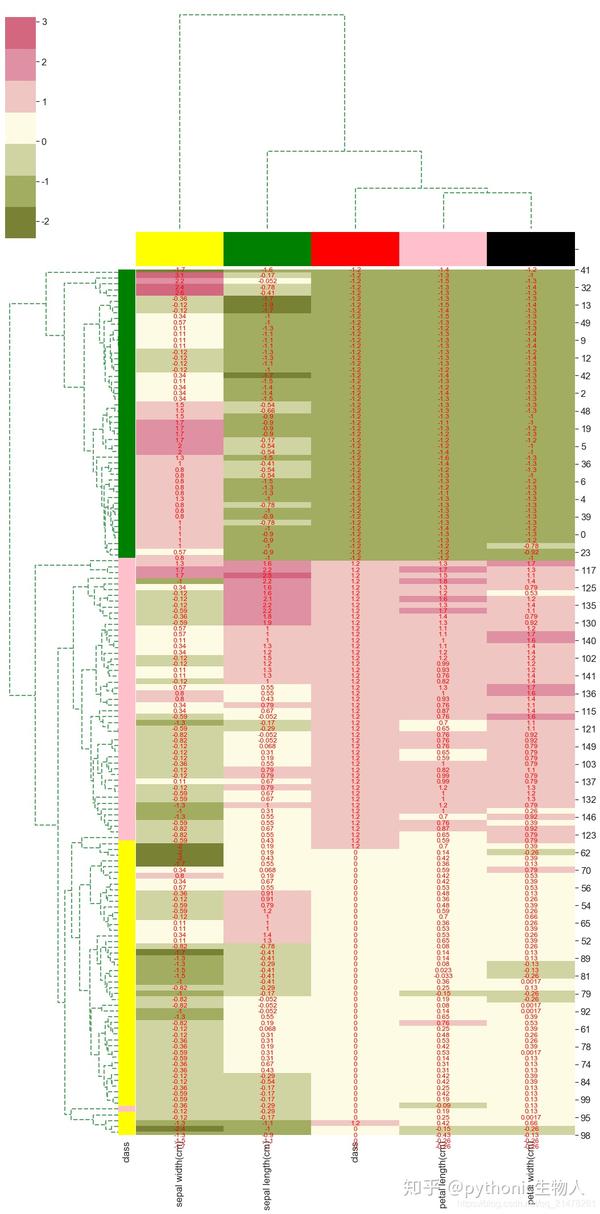
Python可视化matplotlib&seborn15-聚类热图clustermap

Python可视化matplotlib&seborn16-相关性heatmap
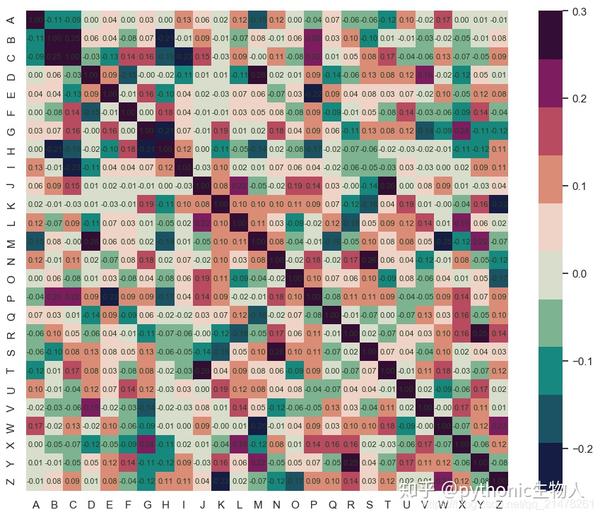
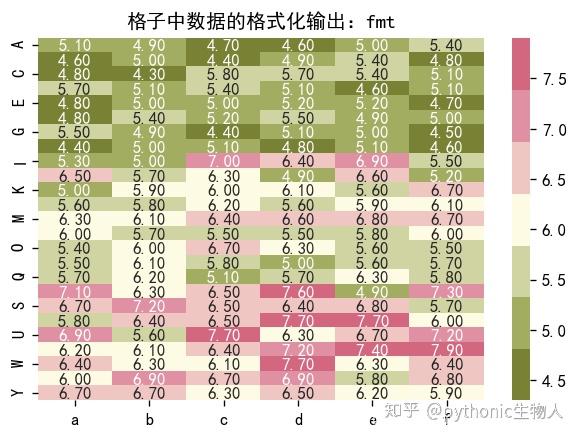
Python可视化matplotlib&seborn14-热图heatmap
Python可视化|matplotlib13-直方图(histogram)详解
Python可视化|matplotlib12-垂直|水平|堆积条形图详解
Python可视化|matplotlib11-绘制折线图matplotlib.pyplot.plot
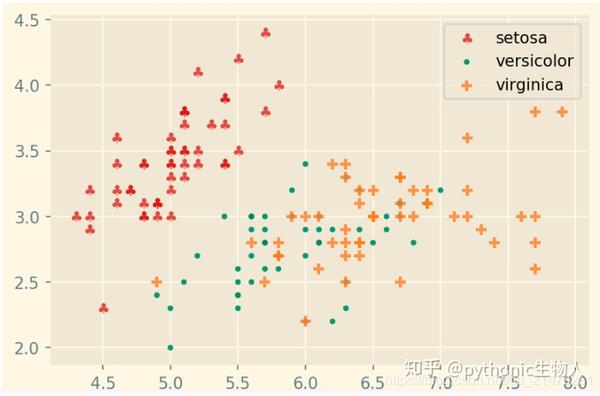
Python可视化|matplotlib10-绘制散点图scatter
Python可视化|matplotlib04-绘图风格(plt.style)大全
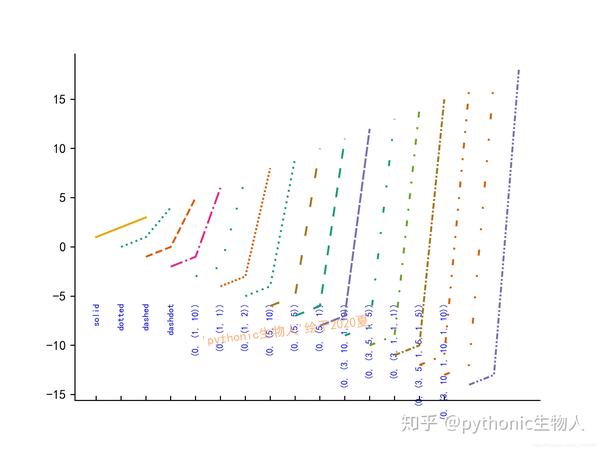
Python可视化|matplotlib03-一文掌握marker和linestyle使用
python可视化|matplotlib02-matplotlib.pyplot坐标轴|刻度值|刻度|标题设置
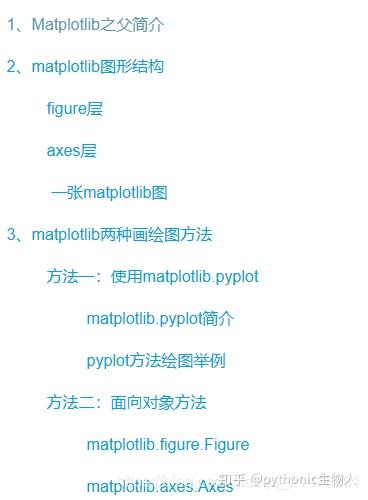
❝ 详细介绍matplotlib.pyplot绘图方式中坐标轴(axis),刻度值(trick label),刻度(tricks),子图标题(title),图标题(suptitle),坐标轴标题(xlabel,ylabel),网格线(grid)等参数的详细设置。
❞
python可视化|matplotlib01-绘图方式|图形结构
欢迎关注公众号:pythonic生物人
Source zhuanlan.zhihu.com