Power BI now integrates with Jupyter Notebooks!
@python_powerbi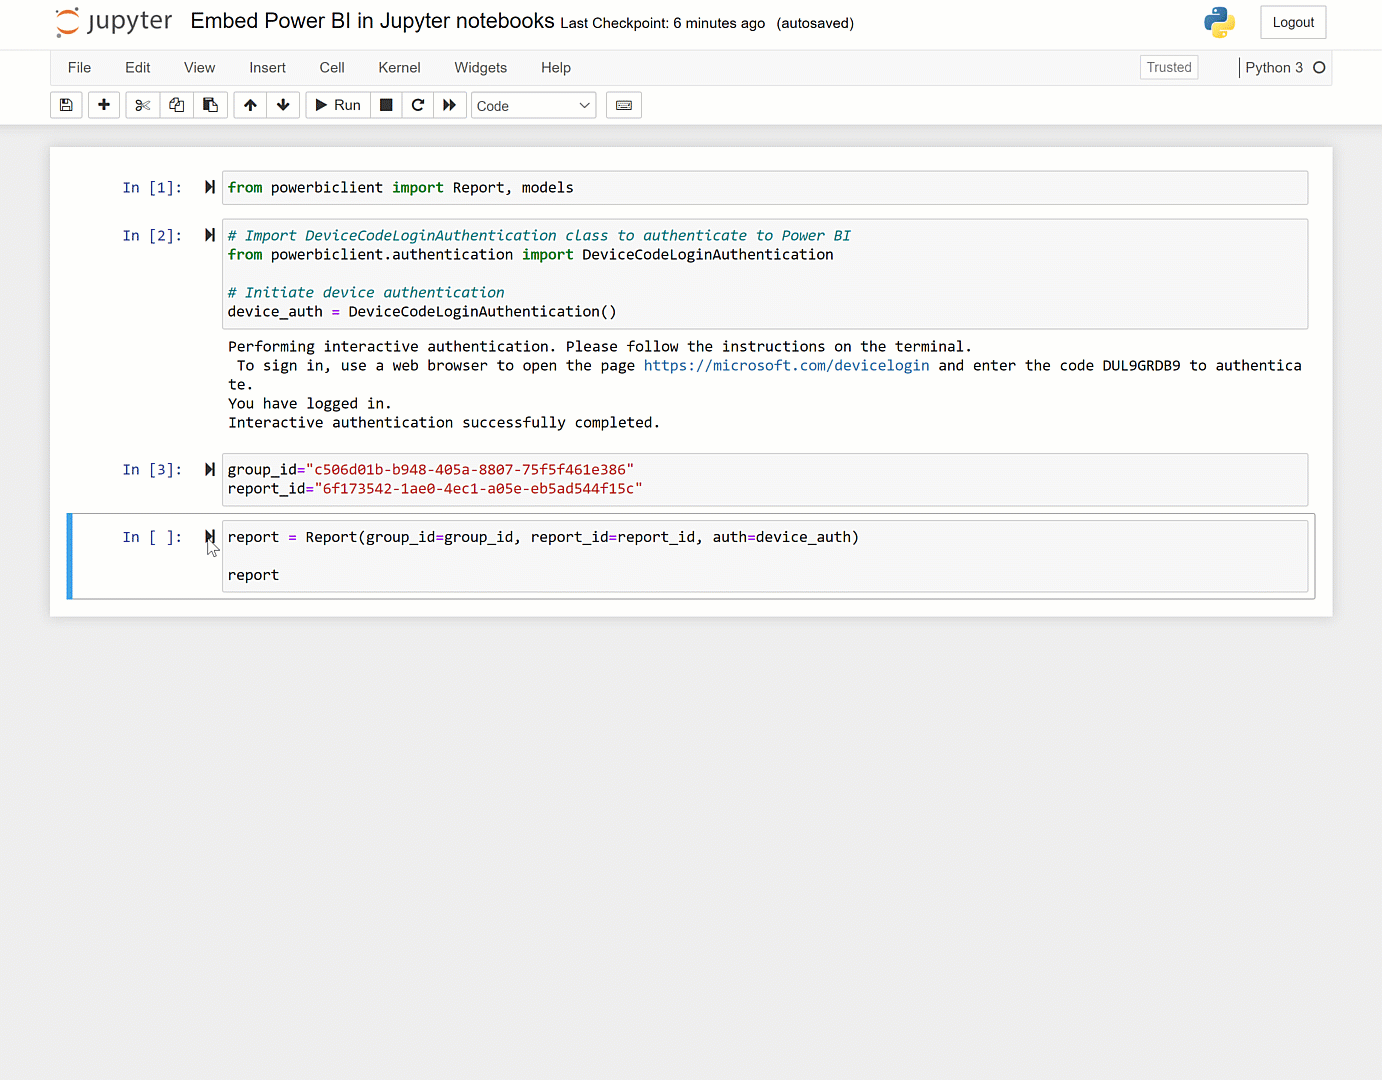
Source: https://medium.datadriveninvestor.com/power-bi-now-integrates-with-jupyter-notebooks-7e258f6fb91d
Hey there! Today, I want to share some exciting news with you: Power BI now integrates with Jupyter Notebooks! 😍📊📈🔥
As someone who loves to work with data, this integration is a game-changer.
In this article, I’ll provide you with a step-by-step guide on how to use this integration and share some example use cases to help you get started.
What is Power BI?
For those who are not familiar, Power BI is a powerful business intelligence tool developed by Microsoft. It allows users to connect to various data sources, transform and clean data, and create insightful visualizations and reports. Power BI is widely used by data analysts, business analysts, and other professionals who work with data on a regular basis.
What are Jupyter Notebooks?
Jupyter Notebooks, on the other hand, are interactive documents that allow users to write and run code, visualize data, and document their work. Jupyter Notebooks are popular among data scientists, machine learning engineers, and researchers who need to explore and experiment with data.
The Integration

So, what does this integration mean for Power BI and Jupyter Notebooks users? Essentially, it means that you can now embed Jupyter Notebooks in Power BI reports and dashboards. This integration allows you to take advantage of the power of Jupyter Notebooks while also leveraging the visualization capabilities of Power BI.
Example Use Cases
Let’s take a look at some example use cases for this integration:
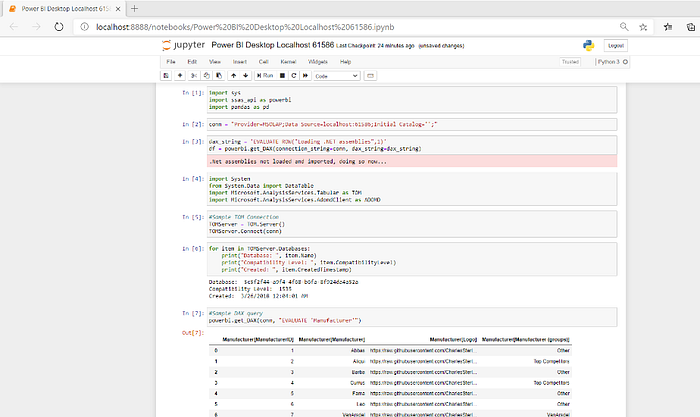
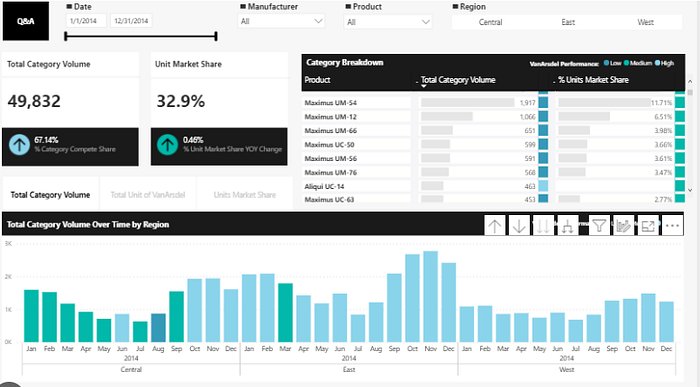
👉 Data Exploration: Suppose you have a large dataset that you want to explore and analyze. You can use Jupyter Notebooks to write code that cleans and transforms the data, then use Power BI to create visualizations based on the cleaned data.
👉 Machine Learning: Suppose you want to build a machine learning model to predict customer churn. You can use Jupyter Notebooks to train and test the model, then use Power BI to create a dashboard that displays the model’s predictions.
🎯 Example use cases
So, what are some examples of how you can use the Power BI and Jupyter Notebooks integration? Here are a few ideas:
Exploratory data analysis — Use Jupyter Notebooks to explore your data, create visualizations, and identify patterns and trends. Then, embed those visualizations into your Power BI report to share your insights with your team.
import pandas as pd
import seaborn as sns

data = pd.read_csv('sales_data.csv')
sns.pairplot(data, hue='region')
Predictive modeling — Use Jupyter Notebooks to create machine learning models that predict future outcomes based on historical data. Then, embed those models into your Power BI report to provide your team with actionable insights.
import pandas as pd
from sklearn.linear_model import LinearRegression

data = pd.read_csv('sales_data.csv')
X = data[['price', 'advertising']]
y = data['sales']
model = LinearRegression()
model.fit(X, y)
predictions = model.predict(X)
data['predictions'] = predictions
sns.scatterplot(x='sales', y='predictions', data=data)
Setting Up the Integration
Now that you have an idea of how this integration can be used, let’s go over the steps to set it up.
Step 1: Install the Power BI Visuals CLI
To get started, you’ll need to install the Power BI Visuals CLI, which is a command-line interface for developing Power BI visuals. Open a terminal window and run the following command:
npm install -g powerbi-visuals-cli
Step 2: Create a New Power BI Visual
Next, you’ll need to create a new Power BI visual. Run the following command to create a new visual template:
pbiviz new jupyter
This will create a new visual template with the name “jupyter”.
Step 3: Install the Required Libraries
To use Jupyter Notebooks in your Power BI visual, you’ll need to install the required libraries. Run the following commands to install the necessary libraries:
cd jupyter
npm install --save @jupyter-widgets/base
npm install --save @jupyter-widgets/controls
npm install --save @jupyter-widgets/jupyterlab-manager
npm install --save jupyter-js-widgets
Step 4: Add the Jupyter Notebook Viewer
Next, you’ll need to add the Jupyter Notebook viewer to your visual. Open the “capabilities.json” file and add the following code under the “dataRoles” section:
{
    "name": "JupyterNotebook",
    "kind": "Grouping
Step 5: Add the Jupyter Notebook Code
Now it’s time to add the Jupyter Notebook code to your visual. Open the “visual.ts” file and add the following code:
import { WidgetManager } from '@jupyter-widgets/jupyterlab-manager';
import * as base from '@jupyter-widgets/base';

export class Visual implements IVisual {
    private host: HTMLElement;
    private widgetManager: WidgetManager;
    constructor(options: VisualConstructorOptions) {
        this.host = options.element;
        // Create the widget manager
        this.widgetManager = new WidgetManager({ el: this.host });
    }
    public update(options: VisualUpdateOptions) {
        // Get the data view
        const dataView = options.dataViews[0];
        // Get the notebook data
        const notebookData = dataView.table.rows[0][0];
        // Create the notebook widget
        const notebookWidget = this.widgetManager.createWidget({
            model_id: 'notebook',
            widget_class: 'jupyter-widgets.Widget',
            options: {
                model_module: '@jupyter-widgets/base',
                model_module_version: '1.0.0',
                model_data: {
                    'widget_manager': this.widgetManager.toJSON(),
                    'notebook': JSON.parse(notebookData),
                },
                view_module: '@jupyter-widgets/base',
                view_module_version: '1.0.0',
                view_name: 'WidgetView',
            },
        });
        // Render the notebook widget
        notebookWidget.render();
    }
    public destroy(): void {
        // Clean up the widget manager
        this.widgetManager.dispose();
    }
}
This code creates a new Jupyter Notebook widget and renders it in the Power BI visual.
Step 6: Build and Test the Visual
Finally, you’ll need to build and test your visual. Run the following commands to build and package your visual:
pbiviz package
pbiviz start
This will start a local server where you can test your visual. Open a web browser and navigate to “http://localhost:8080/". You should see your new Power BI visual with the Jupyter Notebook embedded inside it.
Comparison Table
To help you decide whether this integration is right for you, here’s a comparison table of the features and limitations of using Jupyter Notebooks in Power BI:
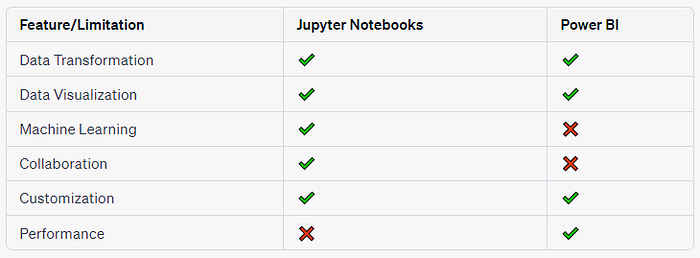
As you can see, using Jupyter Notebooks in Power BI has many benefits, but there are also some limitations to keep in mind, such as the performance of the Jupyter Notebook code.
Here’s an example of how you could use the Python Visual to optimize your code for the customer churn prediction use case:
- Create a new Python script in Jupyter Notebook that contains the code for cleaning and preprocessing the data, creating the machine learning model, and evaluating its performance.
- Replace any interactive widgets or plots with static visualizations.
- Save the Python script to a .py file.
- In Power BI Desktop, click on the “Import” button in the “Visualizations” pane.
- Select the “Python Visual” from the “Power BI visuals” category.
- Once you’ve added the visual to your report, click on it to open the “Visualizations” pane.
- In the “Visualizations” pane, click on the “Python script” tab.
- Here, you can enter the code from your Jupyter Notebook script, or you can upload the .py file.
- Click on the “Run” button to run the script.
- You should now see the output of your script displayed as a visualization in your Power BI report!
💻 Code Comparison Table 💻
To help illustrate the differences between the Jupyter Notebook visual and the Python Visual, here’s a comparison table:

🔌 Integrating Jupyter Notebooks with Power BI 🔌
Before we dive into the example, let’s first talk about how to integrate Jupyter Notebooks with Power BI.
There are a few prerequisites:
- You’ll need to have a Power BI account, as well as an account with a Jupyter Notebook hosting service such as Azure Notebooks or Anaconda Cloud.
- You’ll need to install the Power BI Visuals Tools, which can be downloaded from the Microsoft website.
- You’ll need to install the “Jupyter Notebook” visual from the Power BI marketplace.
Once you have these prerequisites in place, you’re ready to get started.
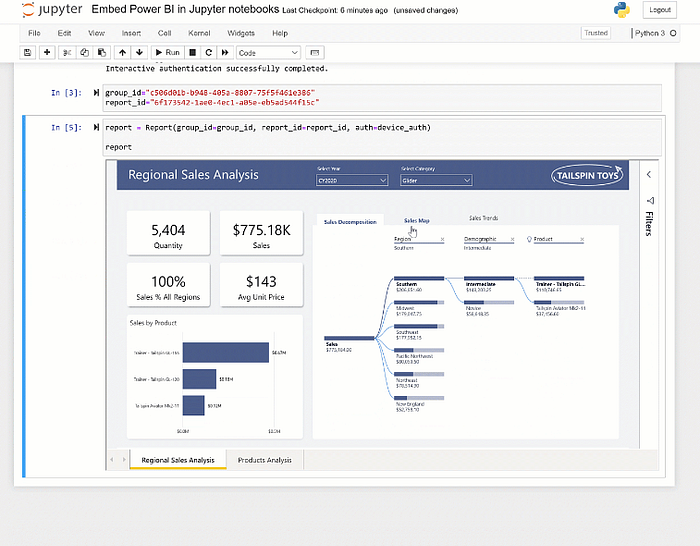
Here’s a step-by-step guide to integrating Jupyter Notebooks with Power BI:

- In Power BI Desktop, click on the “Import” button in the “Visualizations” pane on the right-hand side of the screen.
- In the “Import” pane, select the “Jupyter Notebook” visual from the “Power BI visuals” category.
- Once you’ve added the visual to your report, click on it to open the “Visualizations” pane on the right-hand side of the screen.
- In the “Visualizations” pane, you’ll see a section called “Notebook settings.” Here, you can enter the URL of your Jupyter Notebook and choose whether to display the entire notebook or just a specific cell.
- Click on the “Apply” button to apply your changes.
- You should now see your Jupyter Notebook embedded in your Power BI report!
The integration of Power BI with Jupyter Notebooks is a powerful tool for anyone who works with data on a regular basis.
By embedding Jupyter Notebooks in Power BI reports and dashboards, you can take advantage of the power of Jupyter Notebooks while also leveraging the visualization capabilities of Power BI. By following the steps I provided in this article, you can easily set up this integration and start exploring your data in new and exciting ways.
Whether you’re using this integration for data exploration, machine learning, or storytelling, there are endless possibilities for what you can accomplish with this powerful tool.
So why not give it a try? 🤔👍 Start exploring the integration between Power BI and Jupyter Notebooks today and see what insights you can uncover! And remember, if you have any questions or need any help, feel free to reach out to the Power BI or Jupyter Notebooks community for support. Happy coding! 😊👨💻
Source: https://medium.datadriveninvestor.com/power-bi-now-integrates-with-jupyter-notebooks-7e258f6fb91d