Ocean TA Indicator & RSI
Ocean TAShort Description
This indicator is a technical analysis tool used to determine buy and sell opportunities based on data on the price chart. It takes into account activity, volatility and trend direction to provide signals for making trading decisions. The indicator is suitable for various trading styles, including scalping, intraday trading, swing trading and holding. It can be applied to any financial asset and timeframe. Also includes "Standard Pivot Points" for entering and exiting trades. In the settings, users can adjust the parameters according to their trading preferences.
Structure
1. Data Collection: Historical Market Data collection from the price of the selected asset.
2. Calculation of moving averages: calculating exponential moving averages (EMAs) of the asset price over different time periods, such as 21-day, 55-day 89-day, 144-day and 233-day EMAs.
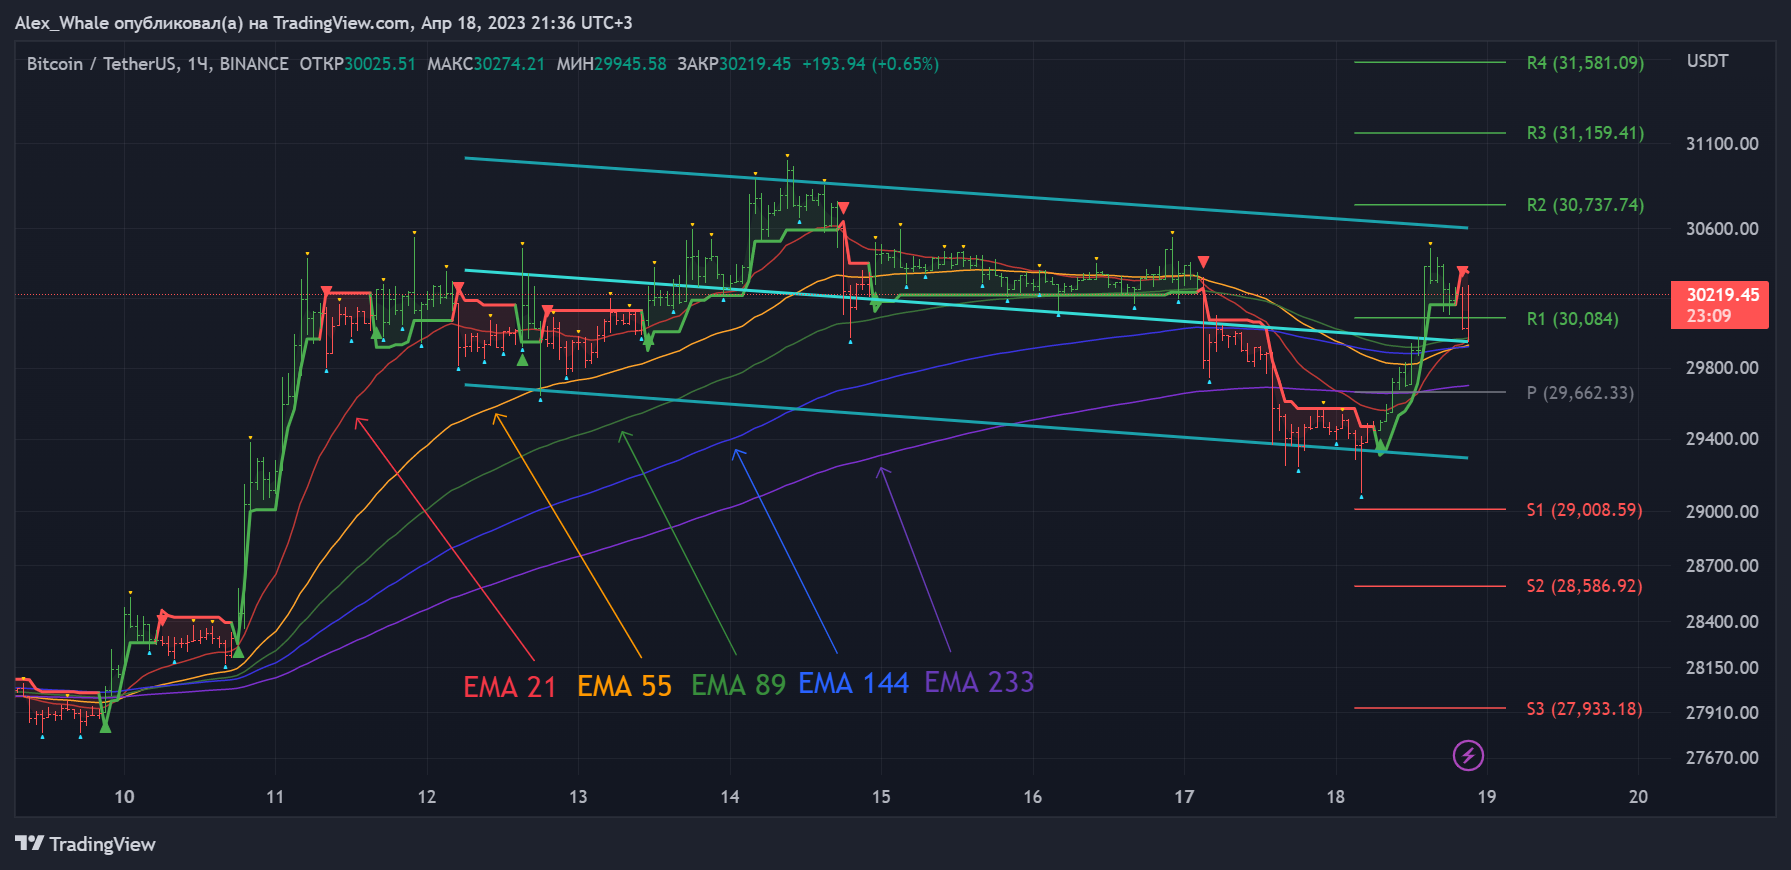
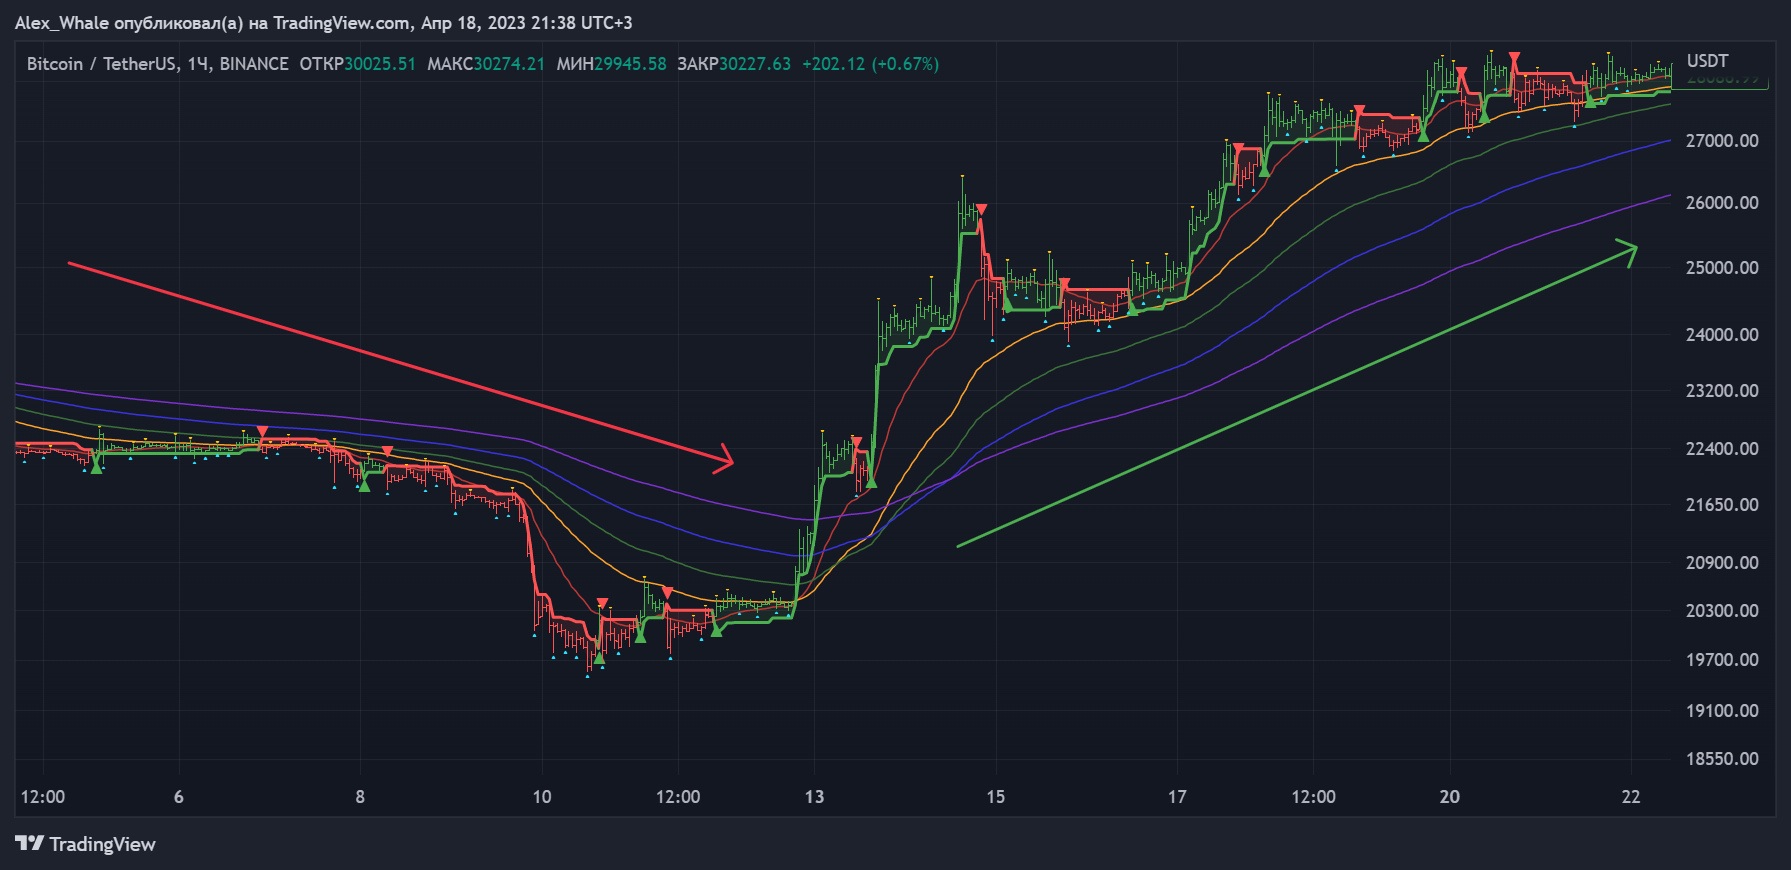
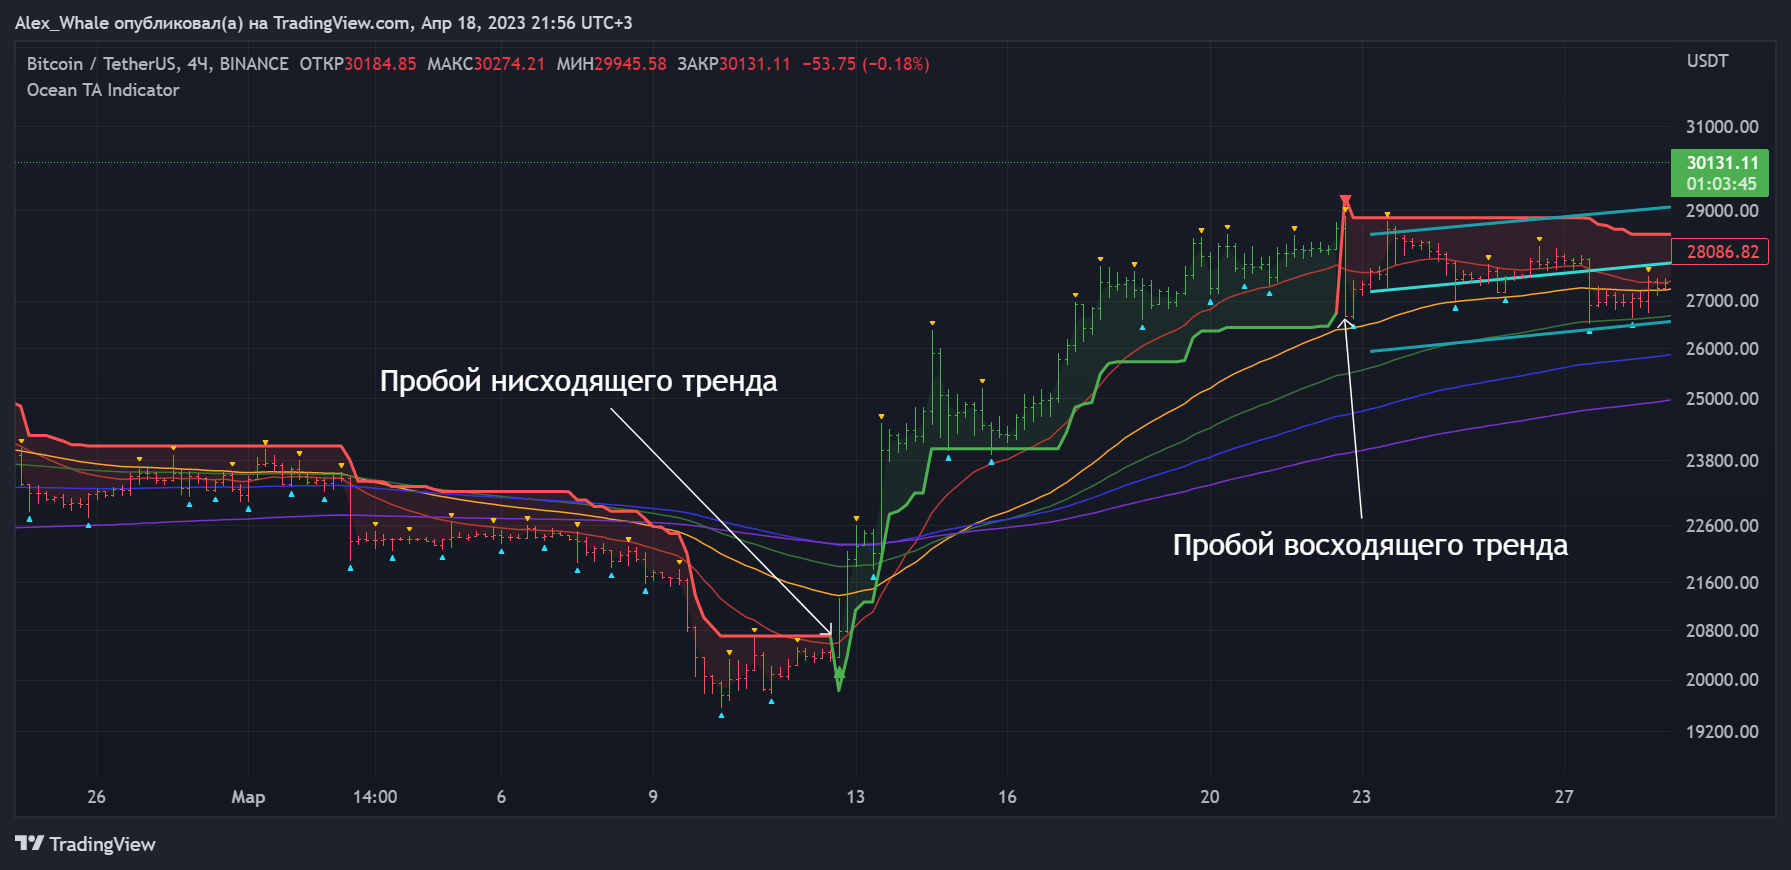
3. Trend identification: comparison of the different EMAs to determine the trend of the asset's price. If the short term EMA is above the long term EMA it indicates an uptrend, if they are opposite it indicates a downtrend.
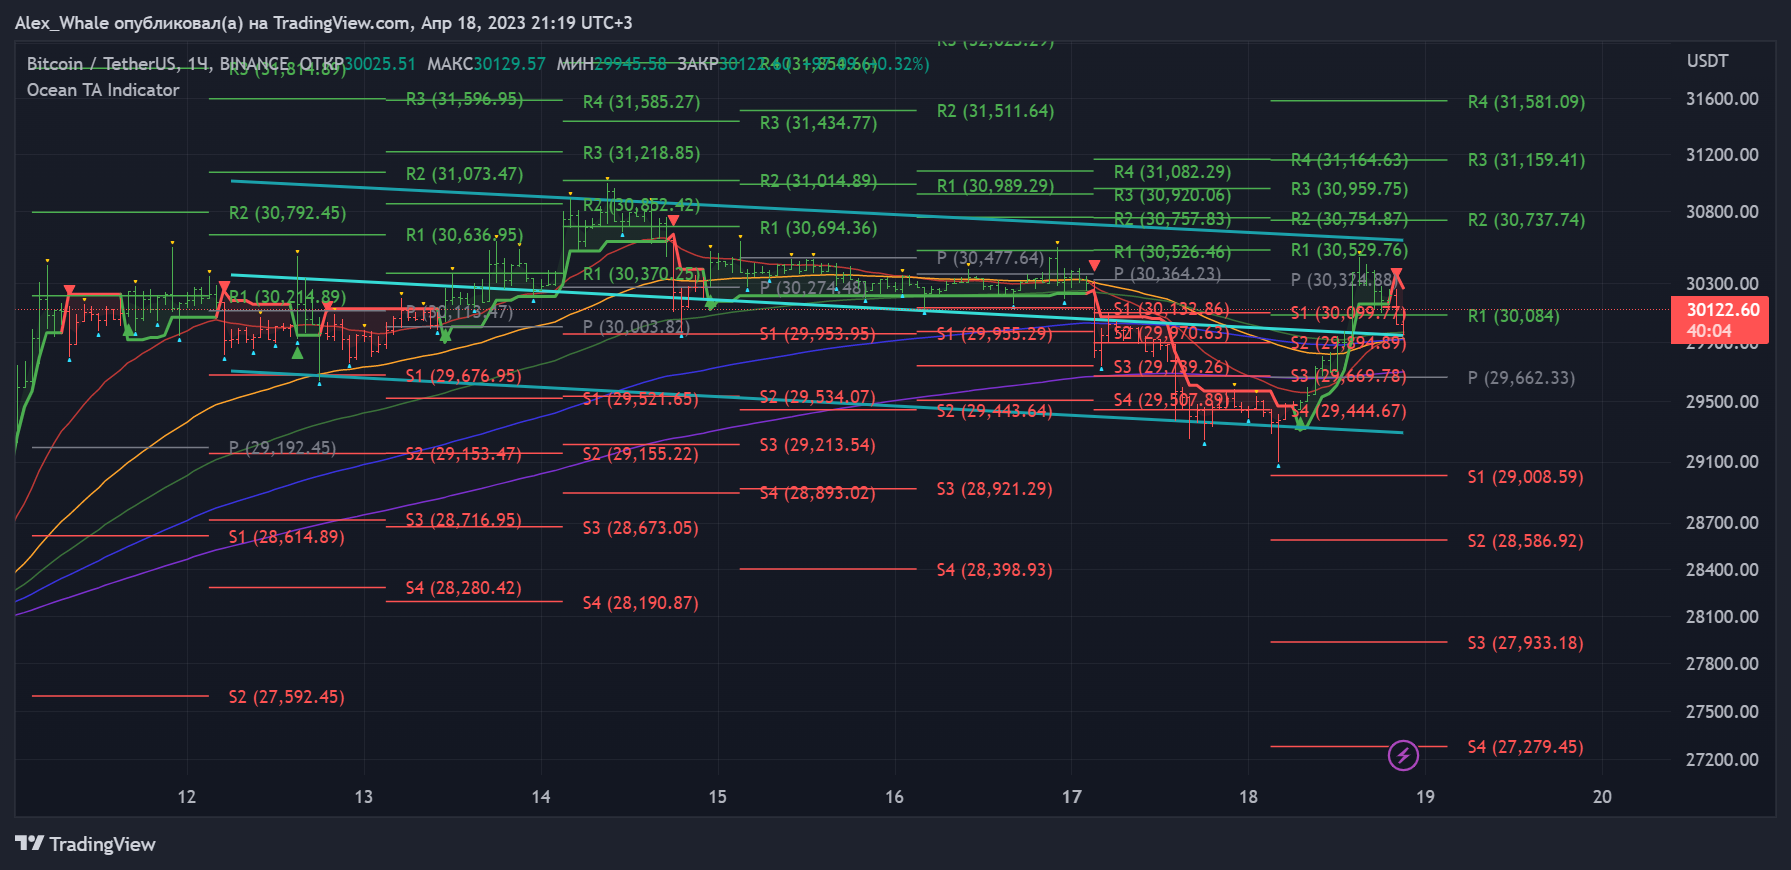
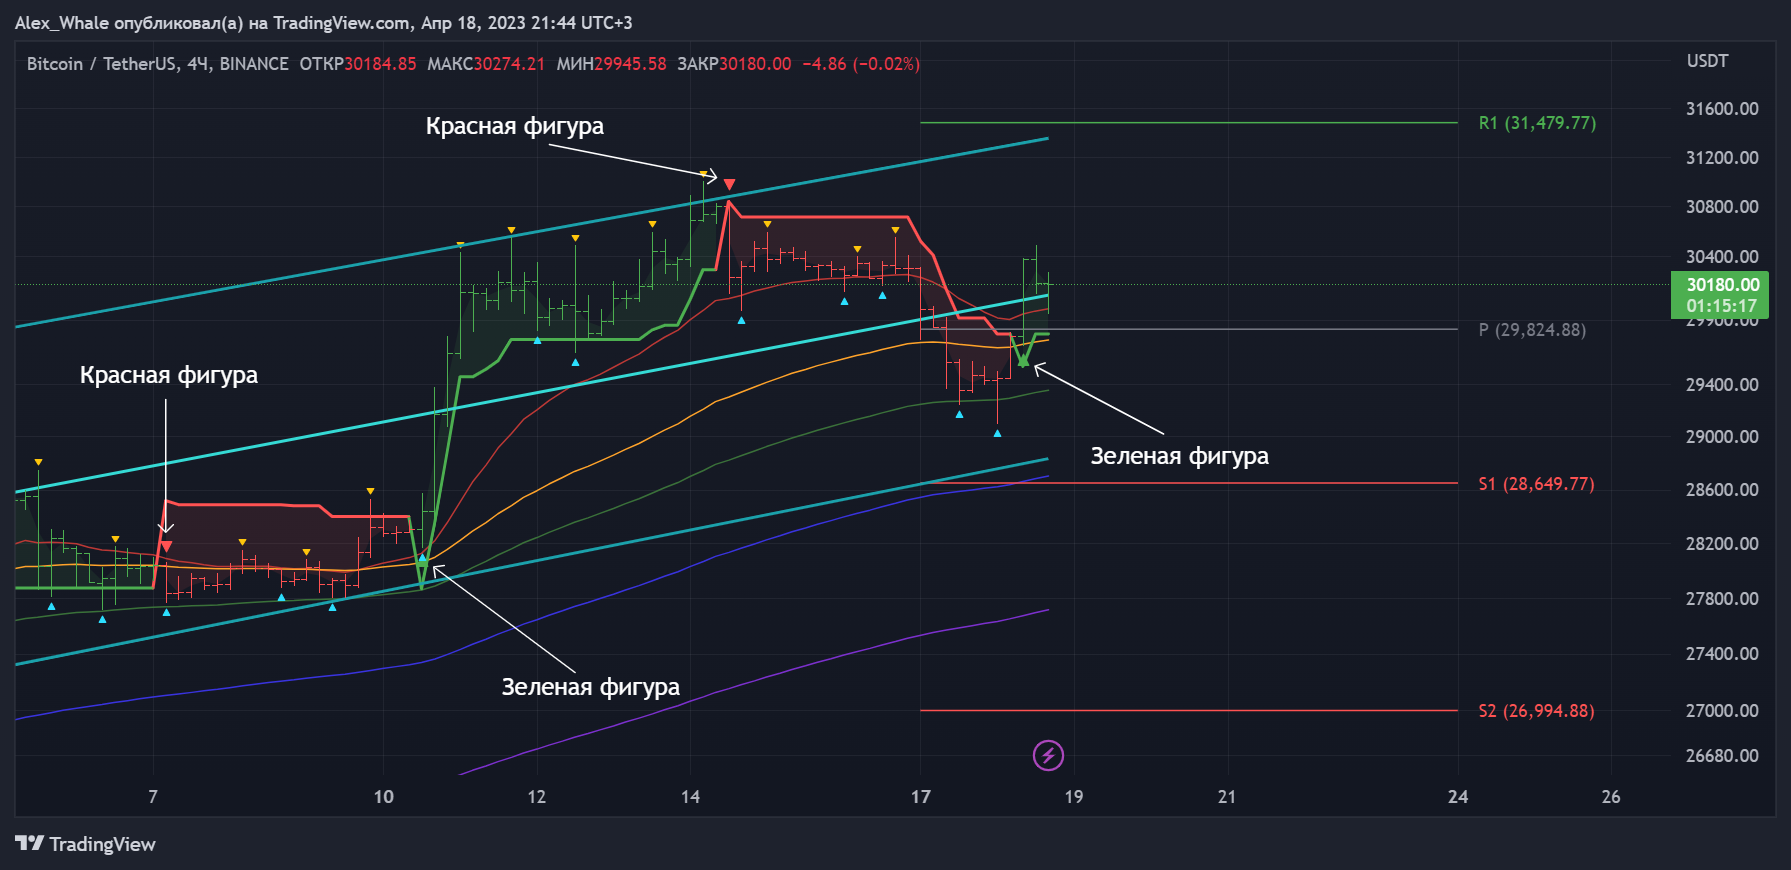
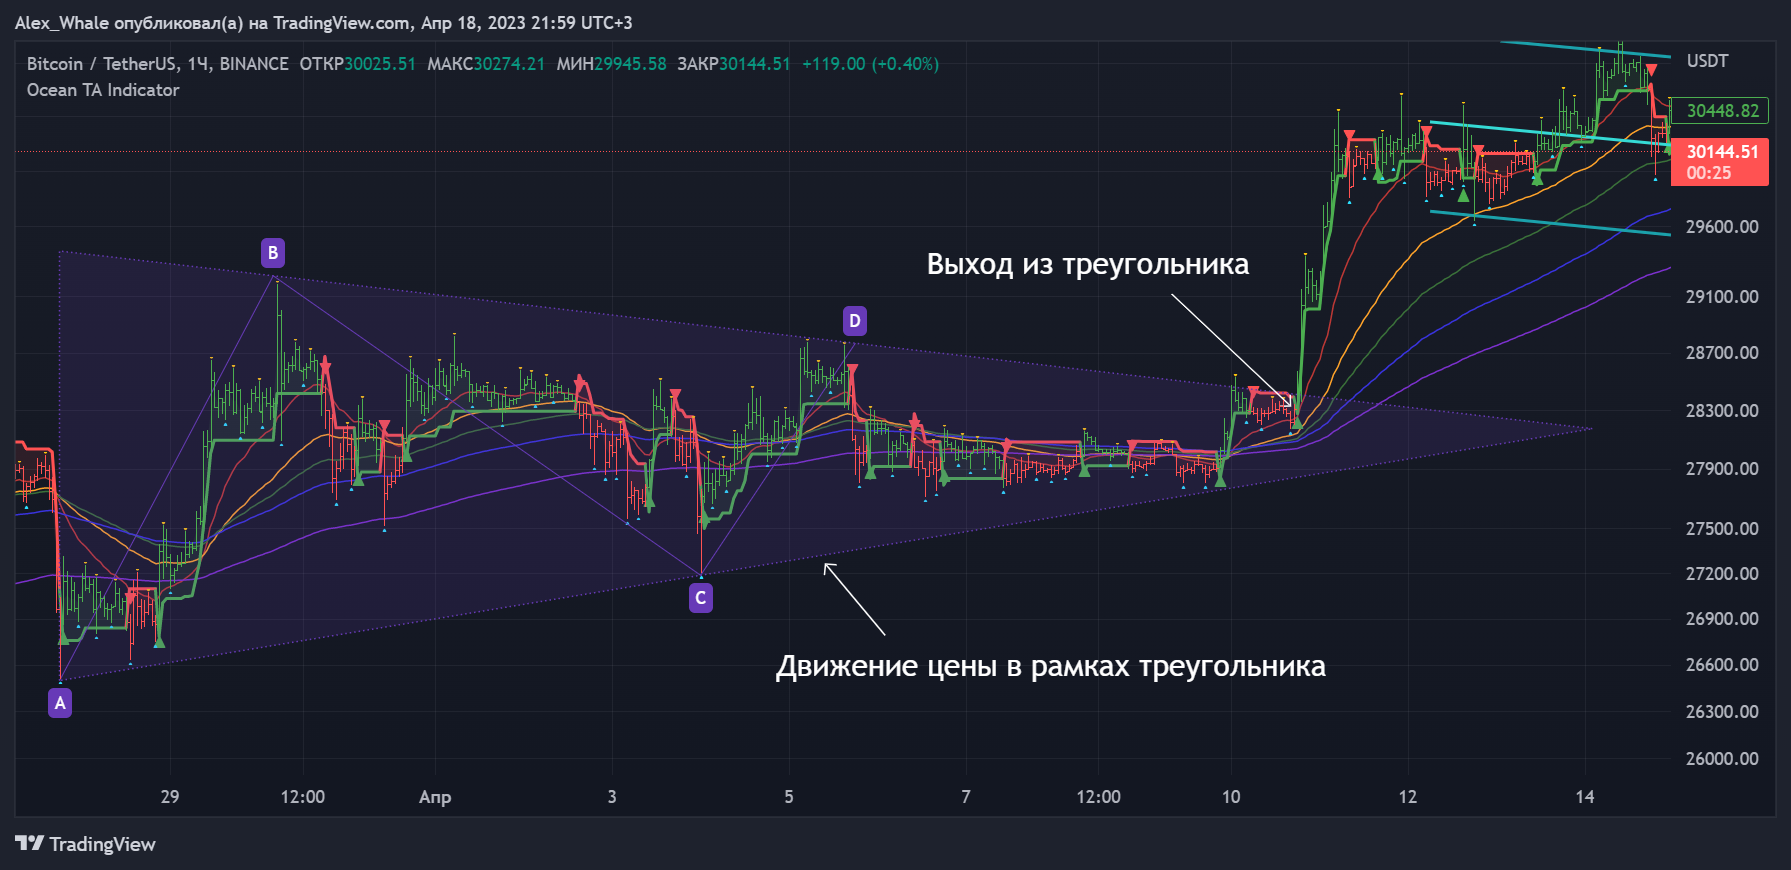
4. Calculation of Support and Resistance levels: determining levels for the price of the selected asset based on historical price data. The difference from the "Standard Pivot Points" is the presence of the one-hour levels, added specially for working on smaller timeframes.
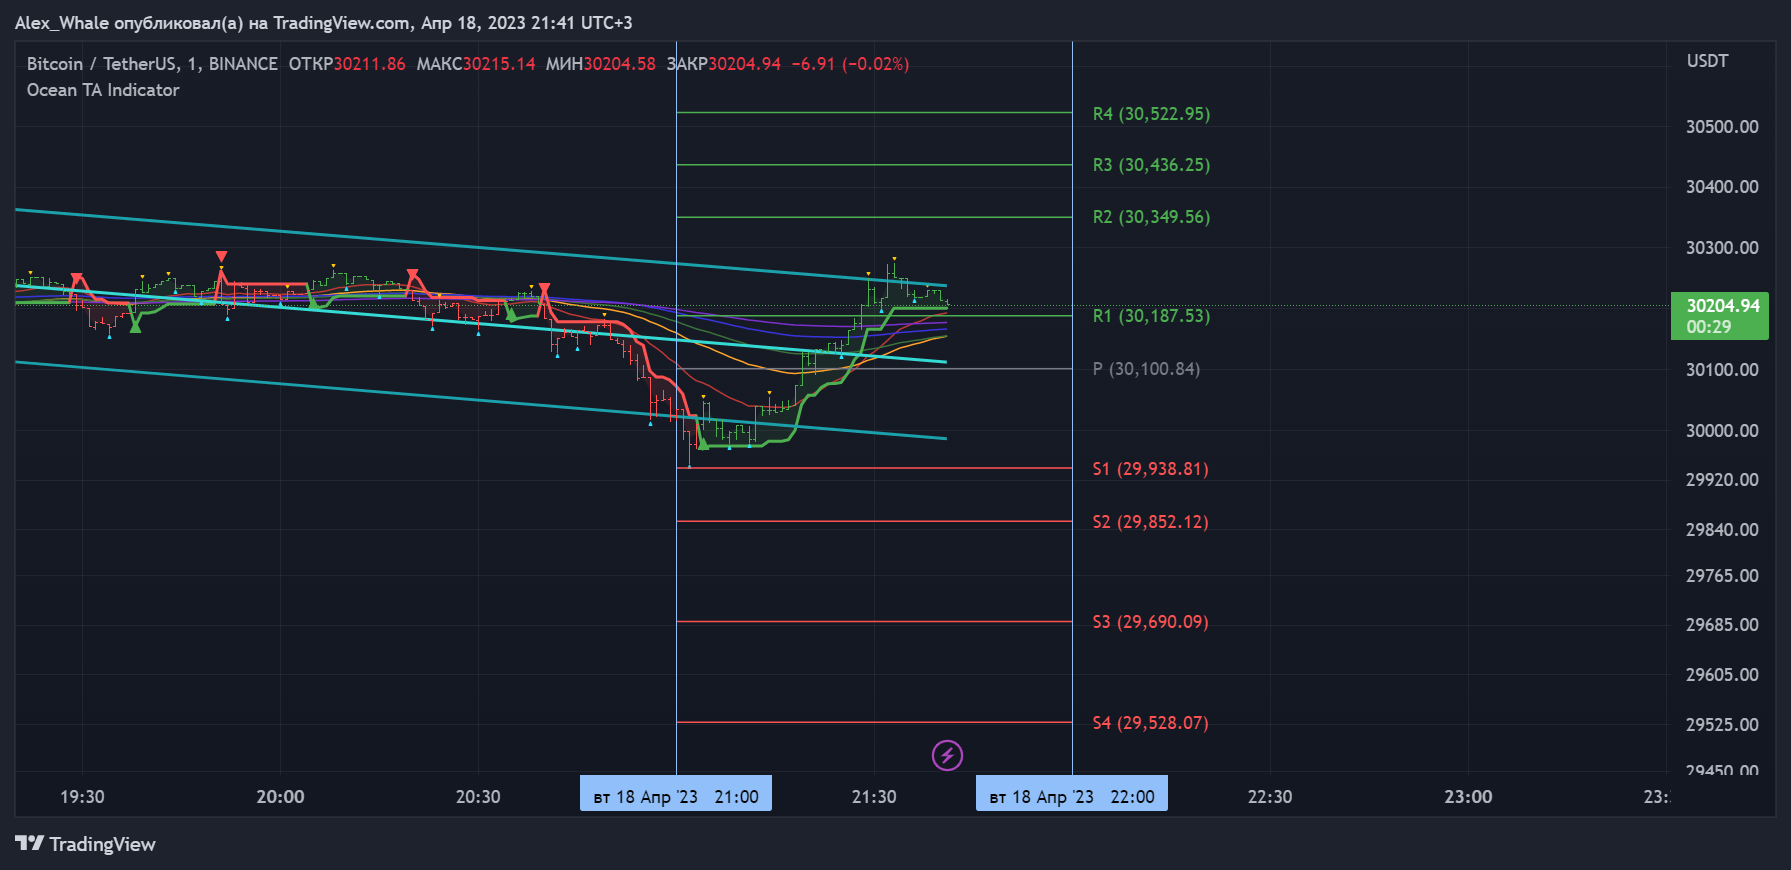
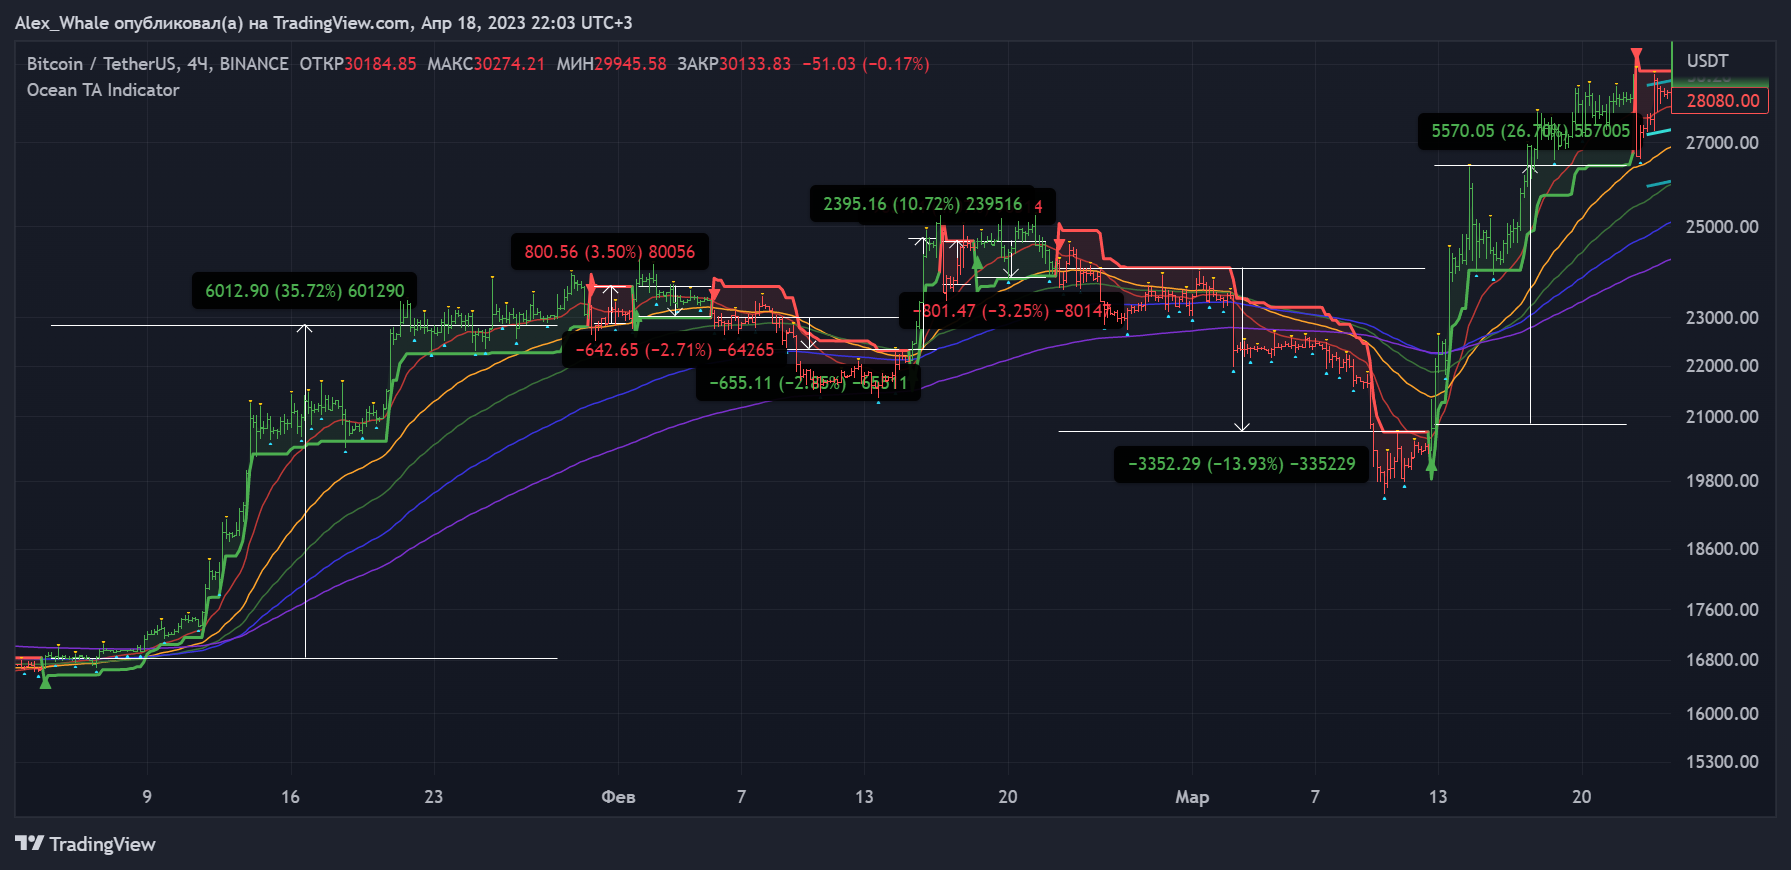
5. Generation of buy and sell signals: based on the price crossing the supertrend line. For example, if the price crosses the supertrend line, breaking it upwards, we obtain a buy signal. And vice versa, if the price crosses the supertrend line downwards, we obtain a sell signal.
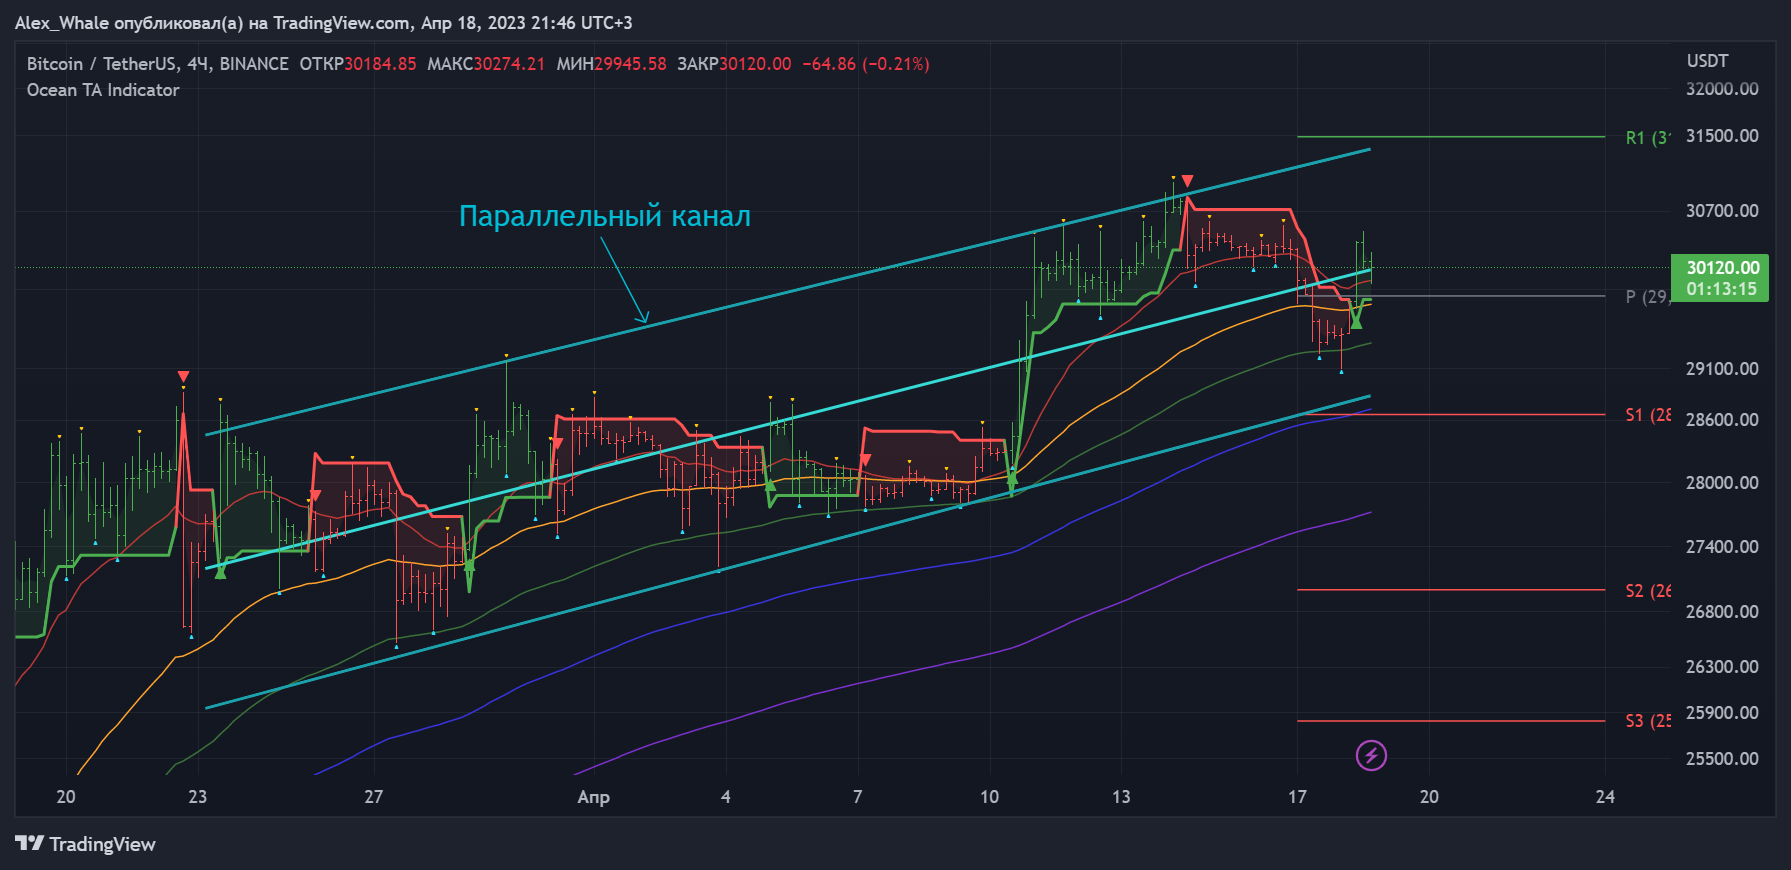
6. A parallel channel consisting of 3 lines. It is updated automatically after the close of a new bar or candlestick. It can be removed or readjusted at any time.
Functions
1. Trend Analysis: The indicator analyzes the trend of a particular asset by examining its price movement over a certain period of time.
2. Support and Resistance levels: the indicator identifies key levels that can help traders make buy and sell decisions.
3. Analysis of impulse: the indicator analyzes the momentum of an asset by looking at the speed of its price movement.
4. Volatility analysis: this indicator helps traders estimate the level of volatility of an asset by examining the range of price movements over a specific time frame.
5. The bars/candlesticks redrawing feature helps to quickly recognize trend changes.
6. Displaying exclusions of highs and lows, which will be useful for building various patterns or for more correct work on the minute timeframe.
Application to Assets
The indicator can be applied to various assets, such as: cryptocurrencies, stocks, commodities and forex. Its main function is to provide traders with guidance on when to buy or sell an asset based on market trends. For example, when the indicator shows that the market is in an uptrend, traders may think about buying the asset, while a downtrend may signal a sell-off. In addition, the indicator can be used to identify potential price levels for an asset by identifying key support and resistance levels. Using the indicator in combination with other technical indicators and fundamental analysis, traders can make more informed decisions and increase their chances of success!
Instructions for use
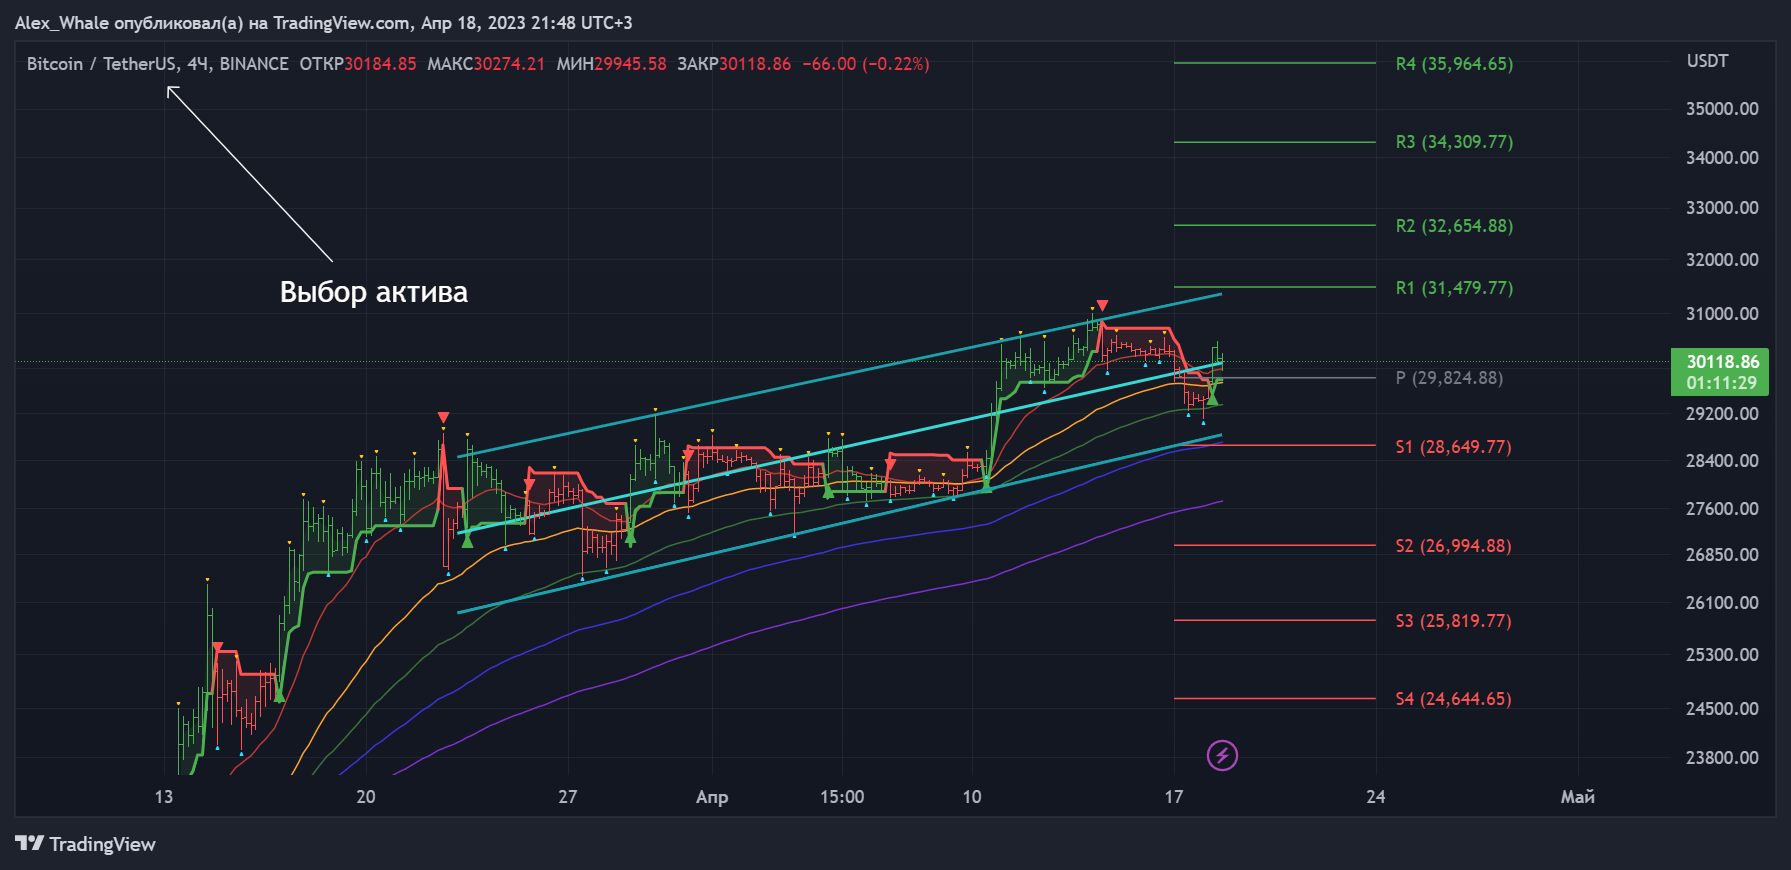
1. Choose an asset for analysis: the indicator can be applied to a wide range of assets, including stocks, cryptocurrencies and commodities. Select the asset you are interested in that you want to analyze.
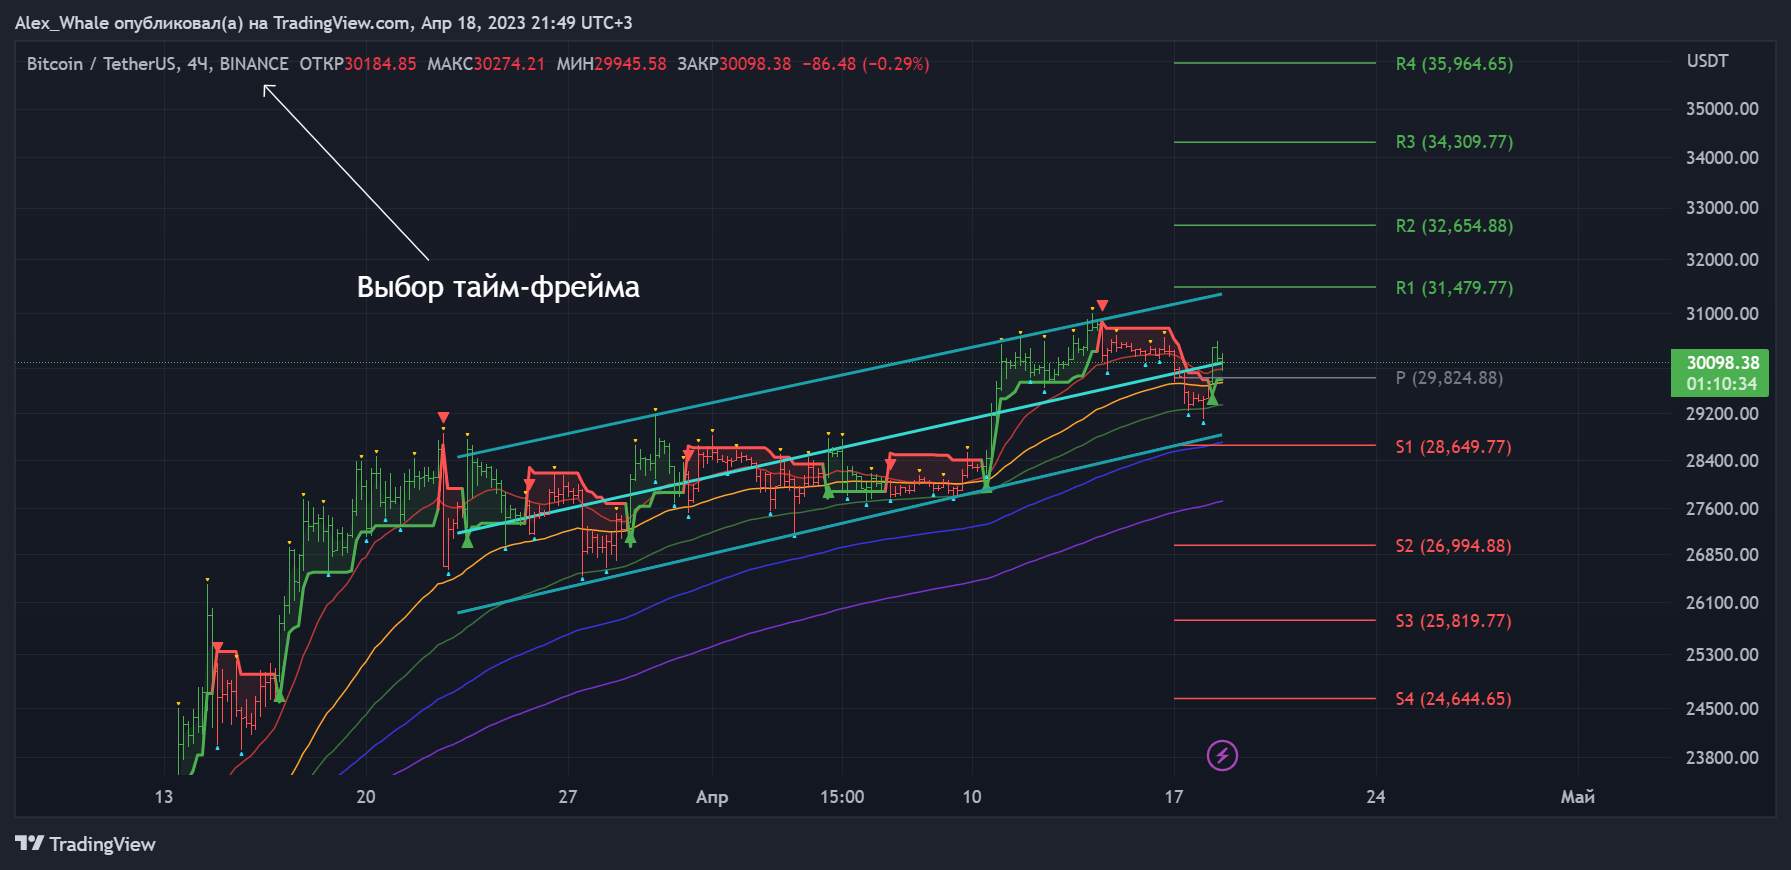
2. Set the time frame: select the timeframe to analyze. It can vary from a minute to a month, depending on your investment strategy.
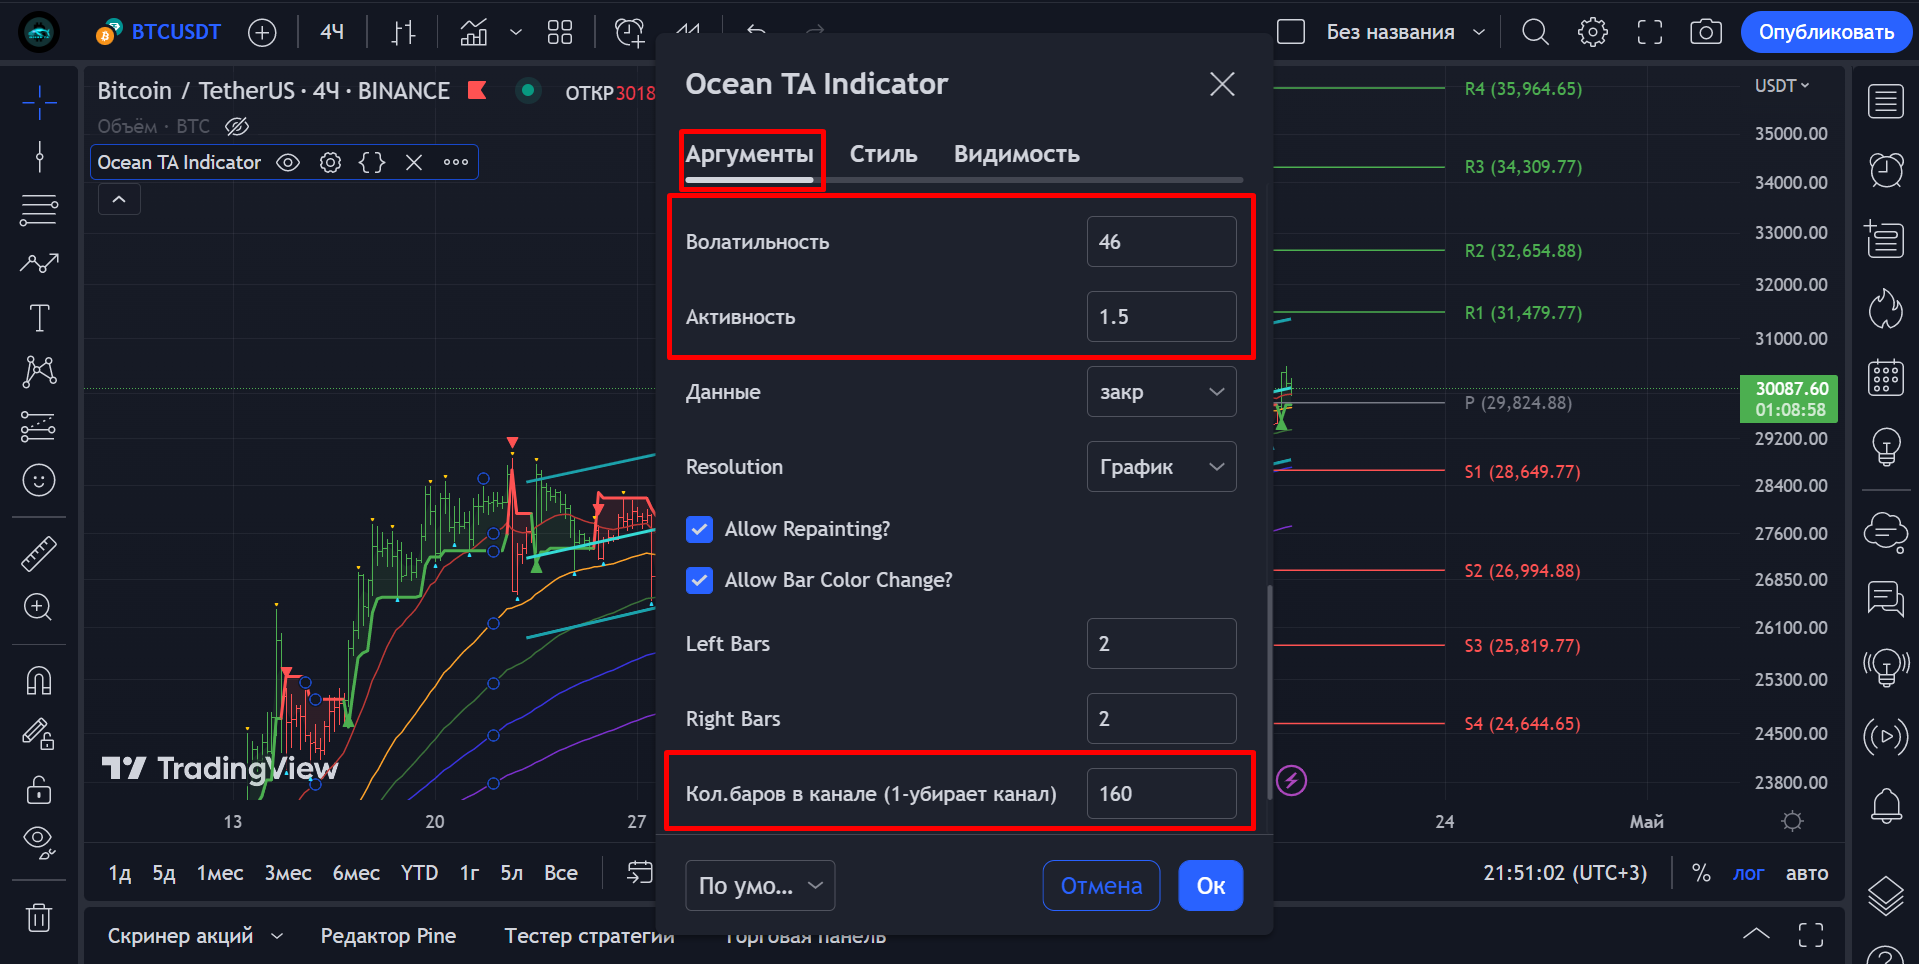
3. Set up the indicator once you have chosen a timeframe according to your preferences. This may include changing activity, volatility, choosing a moving average type and setting threshold levels.
4. Signal Display: The indicator generates buy and sell signals based on the analysis of the asset's price movement. A buy signal is generated when the price crosses the upper threshold, and a sell signal is generated when the price crosses the lower threshold.
5. Use additional analysis. While an indicator can be a useful tool for asset analysis, it is important to use additional analysis to confirm the signals generated by the indicator. This can include fundamental analysis, technical analysis or other indicators and tools on the platform.
6. Tune in to your trading strategy: Once you have analyzed the asset and you have been shown the signals generated by the indicator, you can implement your trading strategy. This may include buying or selling the asset, depending on your investment objectives and risk tolerance.
Timeframe
Based on the information provided earlier, the indicator works on any timeframe. However, it is recommended to use it on higher timeframes such as 4 hours, daily, weekly and monthly to get a clearer picture of the trend. It is important to note that the indicator can give different signals on different timeframes, so it is important to consider the timeframe when analyzing.
Indicator Features and Benefits
The indicator offers a number of opportunities and benefits, including:
1. Trend analysis: the indicator can help identify trends and trend reversals in the market, making it easier for traders to make informed decisions about when to buy or sell an asset.
2. Momentum analysis: the indicator can also be used to identify momentum changes, which can help traders determine when an asset, will continue to move in a certain direction.
3. Support and Resistance levels: the indicator can be used to identify key levels that are important areas where price can significantly change direction.
4. Entry and Exit Signals: based on the signals generated by the indicator, traders can use it to make buy or sell decisions, helping them open and close positions at the right time.
5. Trend Signals: Allert signals can be set up to alert you to any changes in the indicator's trend.
6. Risk management: the indicator can help traders to manage their risk by providing them with valuable information about market conditions which allows them to make more informed decisions about stop-loss levels and position size.
Overall, the Ocean TA indicator is a useful tool for traders looking to gain an edge in the market by making more informed decisions based on market trends and price movements.
Access
Telegram channel with detailed description and instructions: https://t.me/OceanTA_Indicator
This channel was created for the Ocean TA Indicator, in addition to the additional description and instructions for working, trading systems have been added to the channel, created specifically for working with the indicator (in case you don't have a personal trading system).
All updates and new reports on trading strategies will be published in the telegram channel for the indicator.
Indicator link: https://ru.tradingview.com/script/q9H88Irc-ocean-ta-indicator/
To get access to the indicator, write in private messages: https://t.me/Alexandr_Whale
Our telegram channels: https://t.me/Ocean_TA_ENG , https://t.me/Ocean_TA
Ocean TA RSI
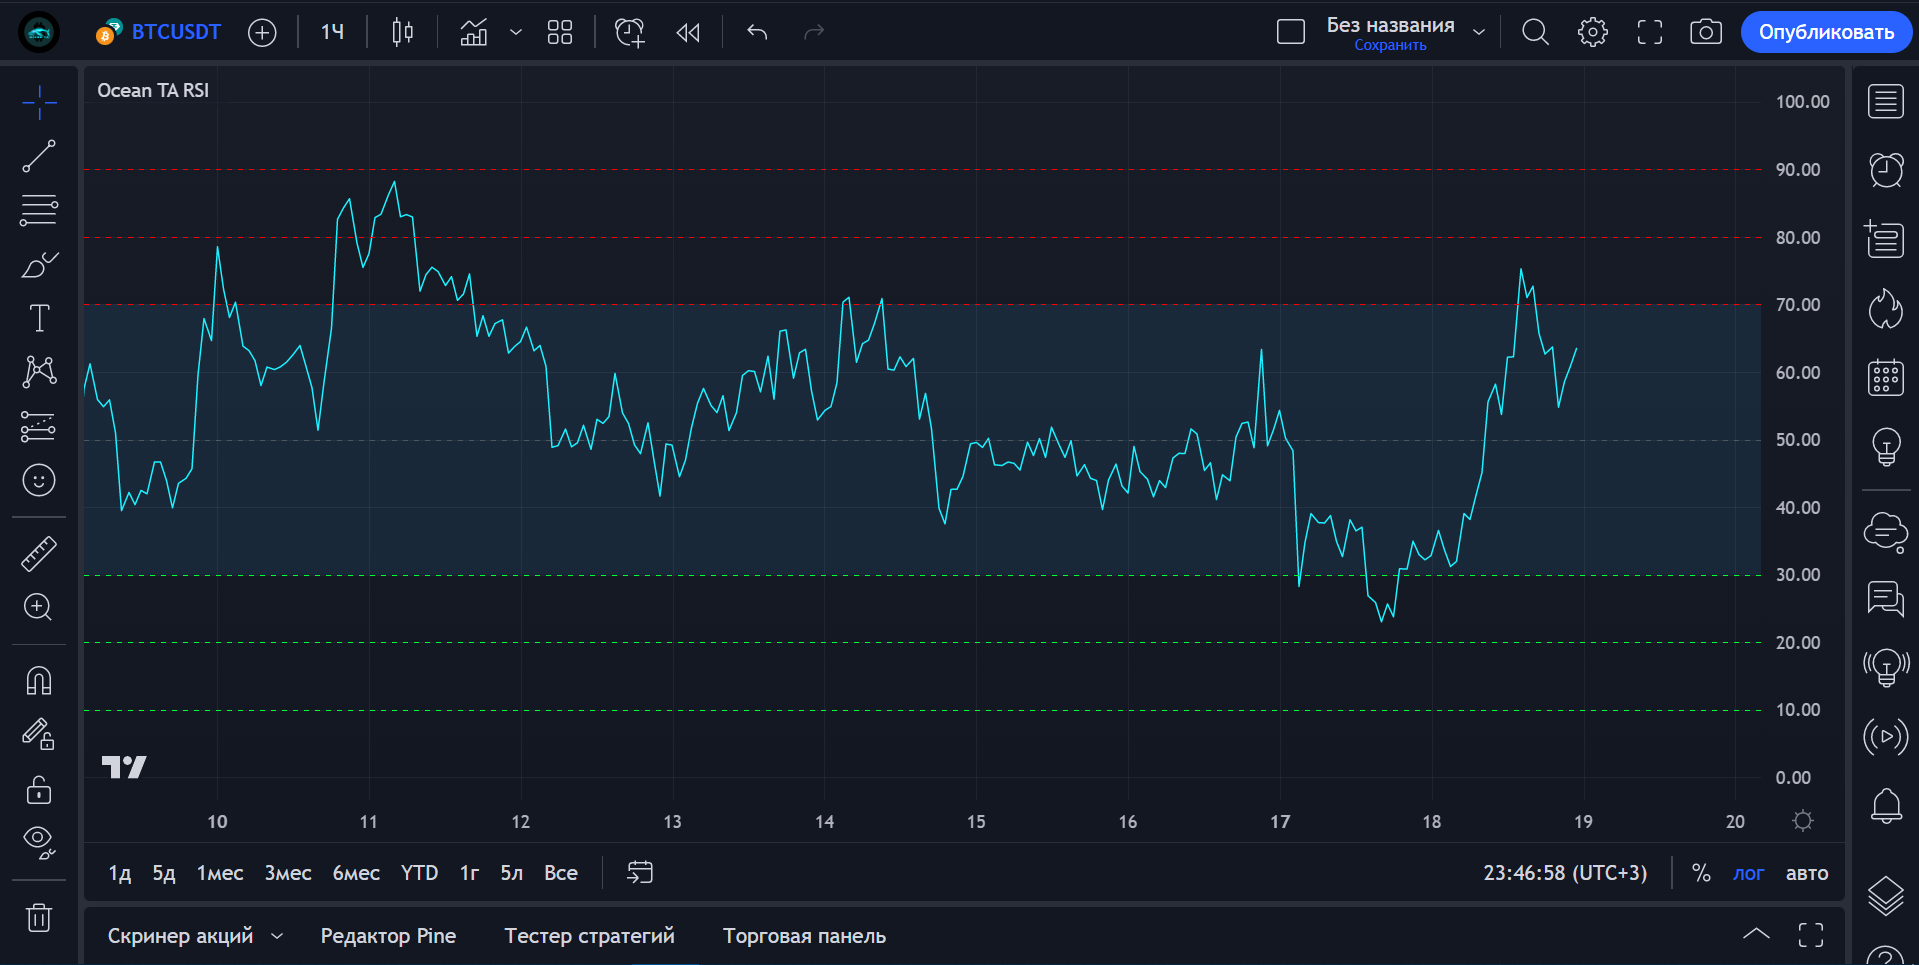
Description of the free indicator
Our free indicator is a classic improved RSI, with a convenient appearance for more accurate work on the chart.
The technical analysis indicator determines the strength of the trend and the probability of its change.
The universal scale of the oscillator value from 0 to 100 allows us to evaluate the overall strength of the trend, as well as the current oversold or overbought level of the asset. For example, if the RSI value is 50, it means that the average price growth has equaled the average price decline.
If the RSI fluctuation range of, say, 35-65 shifts to 20-60, it will indicate a downtrend.
The Relative Strength Index can give a buy or sell signal in several ways, which can be grouped as follows:
- 50-crossing;
- divergence;
- overbought and oversold;
- trend lines.
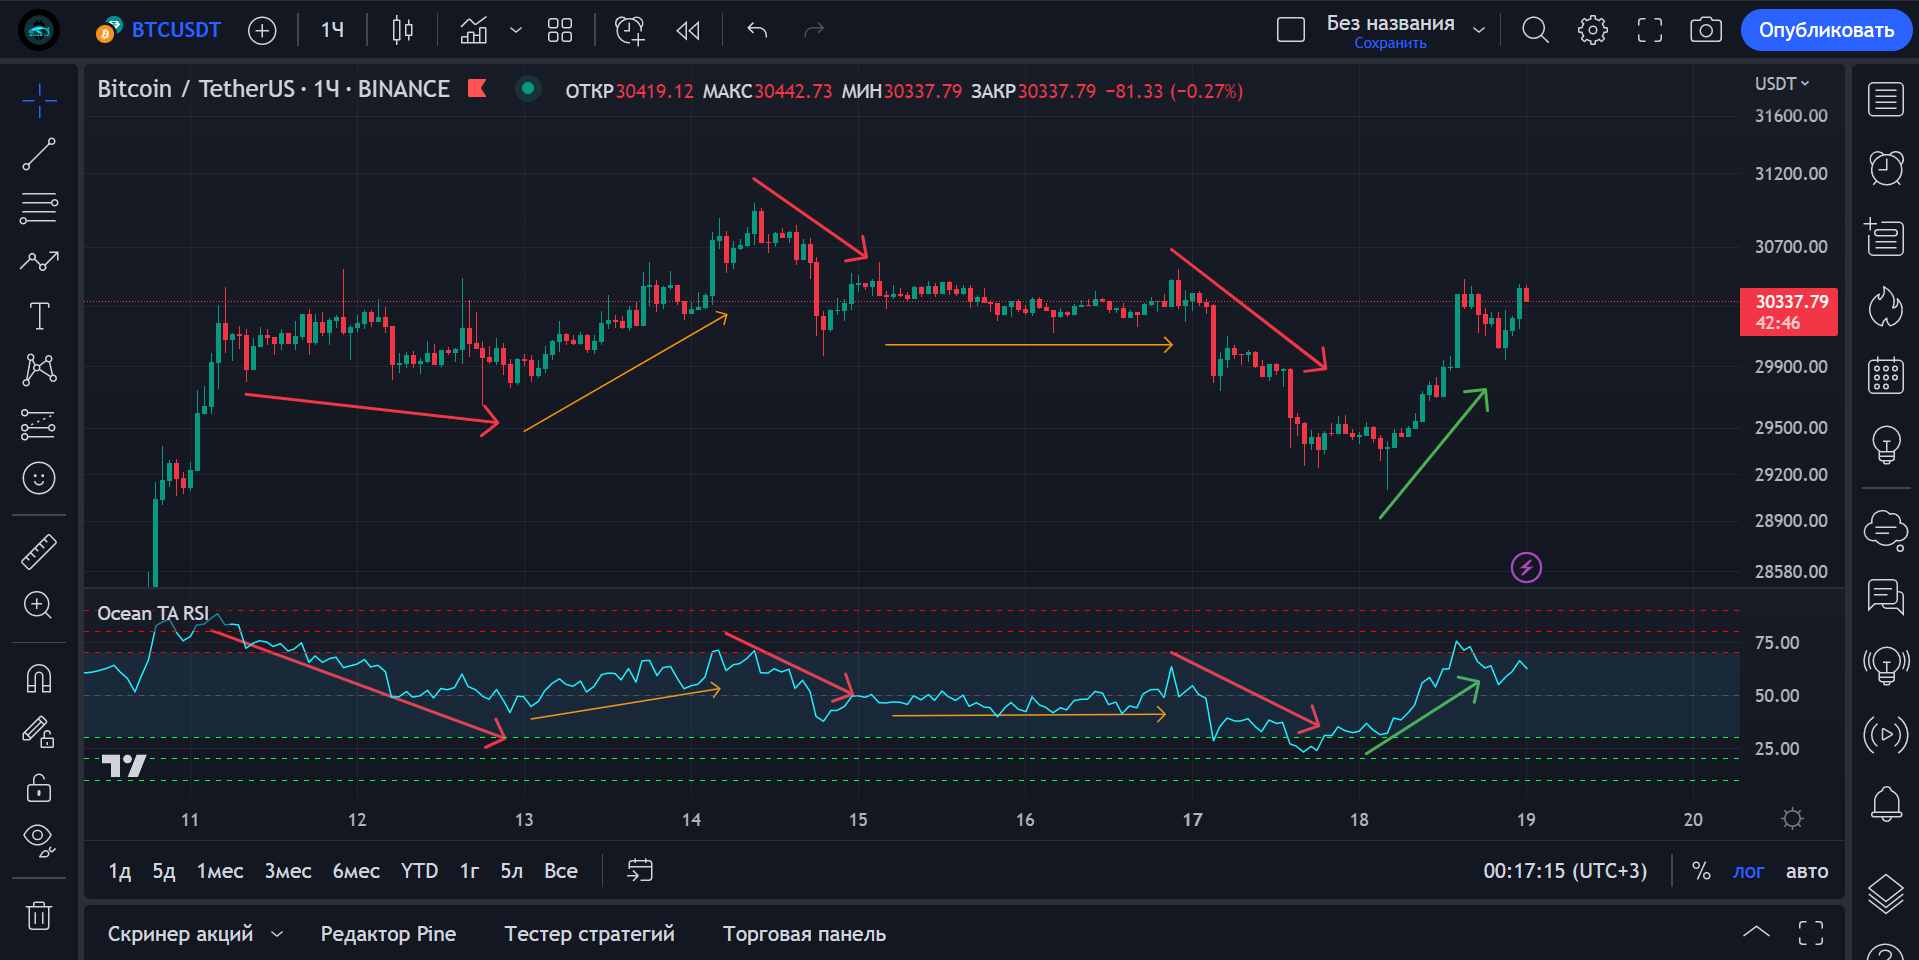
For convenience, we plotted the levels of strong overbought (red dashed lines); when the price reaches these levels, we should get ready to sell. Similarly with the oversold levels (green dashed lines), which warn of further buying.
Access
Follow the link to use the indicator: https://ru.tradingview.com/script/cTyntc3v-ocean-ta-rsi/ and add it to your favorites, then go to the price chart and click on the top left "Indicators, Indicators and Strategies", find and click on it.
Happy trading!