Memory Management & Memory Leaks in Flutter
FlutterPulseThis article was translated specially for the channel FlutterPulseYou'll find lots of interesting things related to Flutter on this channel. Don't hesitate to subscribe!🚀

At some point of application development you must have come across the words like memory leak or memory management and you might scramble…
At some point of application development you must have come across the words like memory leak or memory management and you might scramble upon some of the questions related to these topics in interviews. So lets breakdown these words together for simple understanding.
Table of content;
1. What is memory management?
2. How it works in Android and iOS devices?
3. What are memory leaks and how to deal with it?
So without further a-do let's get started….. 🚗
All applications runs within a fixed memory space allocated by the operating system (i.e. by Android OS or iPhone OS). Once the application starts by triggering MainActivity() in Android and AppDelegate didFinishLaunchingWithOptions() in iOS, the runtime begins allocating memory for application components as an example, UI elements, variables, objects, threads, network operations and cached resources that help the application function smoothly.
Memory Management
- Memory management is a critical aspect of operating systems that ensures efficient use of the computer's memory resources.
- It controls how memory is
allocatedandde-allocatedto processes, which is key to both performance and stability. To understand this in detail let's go back in time.
In school, we learned that computer memory is broadly classified into two types, Primary memory and Secondary memory.
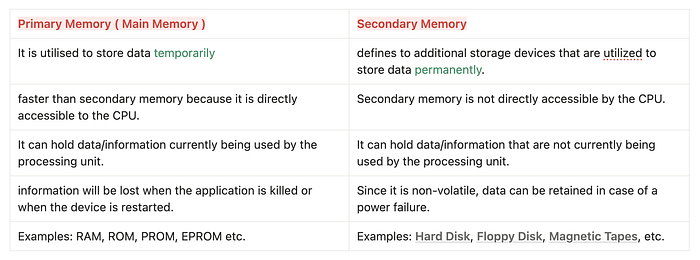
Primary memory (RAM) is where apps actually executes code and store objects while running. Secondary memory is only for permanent storage like APKs, app data, images, documents and databases.
The moment an app launches, its code and objects are copied into primary memory. All allocations you see during runtime Stack, Heap, threads, UI objects exist inside primary memory only. Finally…
Memory Allocation
Memory allocation is the process of assigning blocks of memory on request. The memory allocator is responsible for handling this process.
Memory De-allocation
When a program no longer requires some memory, it can either be freed for reuse automatically or manually, where a programmer defines where, when, and what should be deallocated.
Now let us understand how memory management takes place inside Android and iOS runtimes.

The process of managing memory is handled by the Android Runtime(ART) in Android, whereas iOS manages memory through Automatic Reference Counting (ARC), built into the Objective C and Swift runtime.
Once the runtime takes control of memory management, the next step lies in how that memory is actually divided and utilised while the app is running. Every variable, object and function call must occupy some part of RAM. This allocation happens in two major areas that decide performance, lifetime of objects and even the possibility of memory leaks.
🔍 Types of memory Allocation
1. Stack memory
- Stack memory allocation refers to the process of assigning memory for local variables and function calls WITHIN the call stack.
- The size of memory required is already known before execution.
- Since memory is managed by the system, it is fast and efficient but has limited space compared to heap allocation.
2. Heap memory
- Heap memory is allocated dynamically during program execution.
- Unlike stack memory, heap memory is not freed automatically when a function ends. Instead, it must be released either manually in low level languages like C or C++, or by an automatic system.
- In Android, this cleanup is done through Garbage Collection (GC), while in iOS the same job is again handled by Automatic Reference Counting (ARC), which frees objects when they are no longer referenced.
You must have come across the words single/multi threaded programming languages. So can we connect that concept here anywhere? 🤔
- Yes, When an app launches, the system creates a new process(executes the application code) for it.
- This process receives its own private isolated memory space within RAM & thread runs inside that boundary and consumes resources.
If you are coming from background of cross-platform application framework like Flutter or React Native, then note that the heap memory is usually managed by the framework itself.

Memory Leaks
Now that we understand Stack and Heap memory, we can move ahead to what a Memory Leak is and how it actually happens.
Definition: A memory leak occurs when a program dynamically allocates memory but does not release it after it's no longer needed.
Both Android and iOS allocate objects on the heap. As the application runs, every object such as UI components, images, network responses, data models, background processes and more occupies heap space.
Even though Android and iOS use different cleanup systems, the leak pattern is the same at core:
- Android relies on Garbage Collection (GC) to look for unused objects and free them automatically.
- iOS uses Automatic Reference Counting (ARC) which frees memory when an object's reference count drops to zero.
A leak occurs when an object is still being referenced by something in the heap even though it should have been released. GC or ARC cannot remove it because, as far as the runtime knows, that object might still be needed. The heap continues to grow silently. If enough leaked objects accumulate, memory pressure increases, leading to UI lag and eventually an out-of-memory crash.

One example of benefits of Memory Managements can be consider while creating Game applications, as it contains large sizes of images and have to render each frames efficiently and hence the managing proper heap memory management becomes crucial.
Now let's explore some practical examples of how your Flutter application can leak memory.
Before going further, firstly know that,
- Garbage collector cannot prevent all types of memory leaks, and Flutter developers still need to watch objects to have leak-free lifecycle.
- While the garbage collector takes care of most of it but, it is the responsibility of the application to ensure that unneeded objects are no longer reachable (referenced from the root) such as controllers.
- Dart Virtual Machine(VM) allocates memory for the object at the moment of the object creation, and releases (or deallocates) the memory when the object is no longer used
Why BuildContext can cause memory leak easily?
In Flutter, BuildContext is a short living object that belongs to a specific widget in the widget tree. It gives access to inherited data such as Theme, MediaQuery or Navigator. Because it is tightly coupled to the lifecycle of a widget, keeping a reference to a BuildContext longer than the widget itself, can easily lead to memory leaks.
Consider this leak prone example:
@override
Widget build(BuildContext context) {
  final handler = () => apply(Theme.of(context));
  useHandler(handler);
  ...
}
What is happening here? 🤔
• The closure handler captures context.
• If useHandler stores this closure in a long living place for example a singleton, service or global field then the captured context also lives longer than intended.
• As a result, the widget and everything above that context in the tree can stay in memory even after the widget is disposed.
• The garbage collector cannot reclaim this memory because a live reference chain still exists through the stored closure.
To fix this pattern, avoid capturing BuildContext in long living closures. Instead, extract only the data you need from the context inside build and capture that data in the closure.
Correct version:
@override
Widget build(BuildContext context) {
 final theme = Theme.of(context);
 final handler = () => apply(theme);
 useHandler(handler);
 …
}
- The closure no longer captures
context, only thethemeobject. ThemeDatais designed to be shared and is not tied to the lifetime of a singleBuildContextinstance in the same way.- When the widget is removed from the tree, there is no stored reference to its context, so the framework is free to collect it.
- The handler can still be stored and used later without pinning an entire widget subtree in memory.
Apart from BuildContext related leaks, a very common source of memory leaks in Flutter is forgetting to dispose controllers and nodes that internally register listeners or hold native resources.
These objects live on the heap and will stay there until you explicitly call dispose(). Common examples are,
- TextEditingController: Holds text state and selection
- AnimationController: Ticks every frame using
Tickerunder the hood - ScrollController: Listens to scroll position changes
- TabController and PageController: Manage tab index or page position
- FocusNode : Manages keyboard focus
- These controllers are long living objects compared to individual widget builds.
- If you do not dispose them, their internal listeners and references keep parts of the widget tree alive on the heap.
- Explicit
dispose()breaks these links, allowing GC to reclaim memory and prevent slow leaks that show up as jank or out of memory crashes later.
Flutter DevTool : Memory
- Flutter DevTools → Memory Tabis one of the most important tools for detecting memory growth, leaks and heap pressure inside a running Flutter application.- It visually shows how much memory your app is consuming in real time and how objects inside the Dart heap grow or shrink as the app runs.
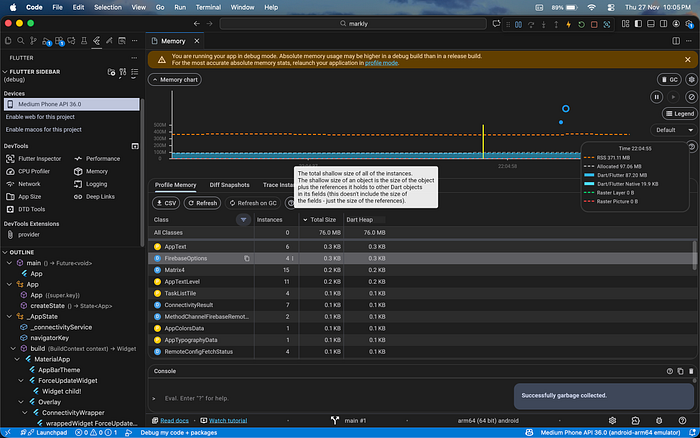
From this image we can observe these things mentioned below.
Memory chart (top graph)
The graph shows memory consumption over time. Each line represents a different memory component:
- RSS shows actual memory taken from the OS
- Allocated memory is what the Dart VM has reserved
- Dart Heap usage shows memory used by active Dart objects
- Markers show GC (Garbage Collection) events
- A stable app will show memory rising and falling smoothly. If memory climbs continuously and never drops even after GC, that signals a possible memory leak.
Object table (bottom section)
The table displays all Dart objects currently alive in heap along with:
- Number of instances in memory 😲
- Total shallow size (immediate size of objects)
- How much space they occupy in heap
- You can click any class and inspect whether object count increases and decreases over time. For example, if
TextEditingControllerinstances increase every time you open a page and never go down, it means they were never disposed and are leaking.
The GC button in the top right triggers garbage collection manually.
This is extremely useful while debugging leaks.
So that's it for this article, remember that Memory leaks are silent, sneaky and easy to miss, but once they pile up they can slow down even the most beautifully built app.
I hope you learned something new from this blog. If you didn't understand any of this part or have any doubts, then you can ask me in the comments, or on my LinkedIn and Twitter.
If this was helpful and you'd like to support my work, you can do so via Buy Me A Coffee. 💛 Every bit of support truly means a lot.

Keep clapping 👏 (you can appreciate it by clapping 50 times)