Market structure
AcademianModule outline
1. Terminology.
2. Phases of the market. Formation of accumulation and distribution. Trend movement.
3. Swings. Strong High/Low. Weak High/Low.
4. Market trend break/update break of a market trend.
5. Identification of structural movement break/renewal.
6. Conclusions.
1. Terminology
Trend is a market tendency, which is formed due to purchases/sales of a sufficiently large volume of an asset that can affect the price movement
Uptrend - an upward price movement that is formed due to the consecutive purchases of a large volume.
A downtrend is a downward price movement, which is formed due to successive large volume sales consecutive.
Accumulation - a narrow price range at which large participants accumulate (buy) a position with the purpose of selling it. In order to sell the asset at higher prices in this case, an uptrend.
Allocation - a narrow price range, in which large participants allocate (sell) a position in order to obtain an upward trend (sell) a position in order to gain profit. In this case, a downtrend occurs.
Market cycle - a chain of market phases in which large participants accumulate/distribute a position, initiating an upward/downward movement.
HH (Higher High)
HL (Higher Low)
LH (Lower High)
LL (Lower Low)
Impulsive movement - movement directed along the main trend.
Correctional movement - movement directed against the main trend.
Strong Swing - a price maximum/minimum, which is the key one within a particular structural movement within a particular structural movement. Renewal of this point leads to the change of the structural movement.
Weak Swing - a price maximum/minimum that has no influence on the structural movement influence.
Market Structure (MS) - market structure.
BoS (Break of Structure) - break of structure.
Conf (Confirmation) - continuation (update) of the structure.
Fake BoS - formation of manipulation in the zone of the key structural maximum/minimum.
2. Phases of the market. Formation of accumulation and
distribution. Trend movement
Formation of upward/downward movement by means of accumulation/distribution of large volume
Price is always in a certain phase of movement. In order for us to observe an increase in price, namely the display of bullish candles, there must be a purchase involving large volume.
“Large participant”, and he is not alone in the market, accumulates his position by holding the price in a small range (accumulation). price in a small range (accumulation). Once the position is fully built up, we see bullish candlesticks forming, indicating the potential birth of a potential upward trend.
To make a profit, the accumulated asset (position) should be sold. When reaching acceptable for the “large participant” price for partial or full fixation of the position distribution is formed.
Distribution is a small price range at which a large player fixes a position in order to gain profit. After a distribution is formed in the market distribution, the price goes into the phase of downward movement. This is how a downtrend movement.
If we summarize the above written, we will get the following: accumulation phase - trend upward movement - distribution phase - trend downward movement. This whole chainis called a market cycle.
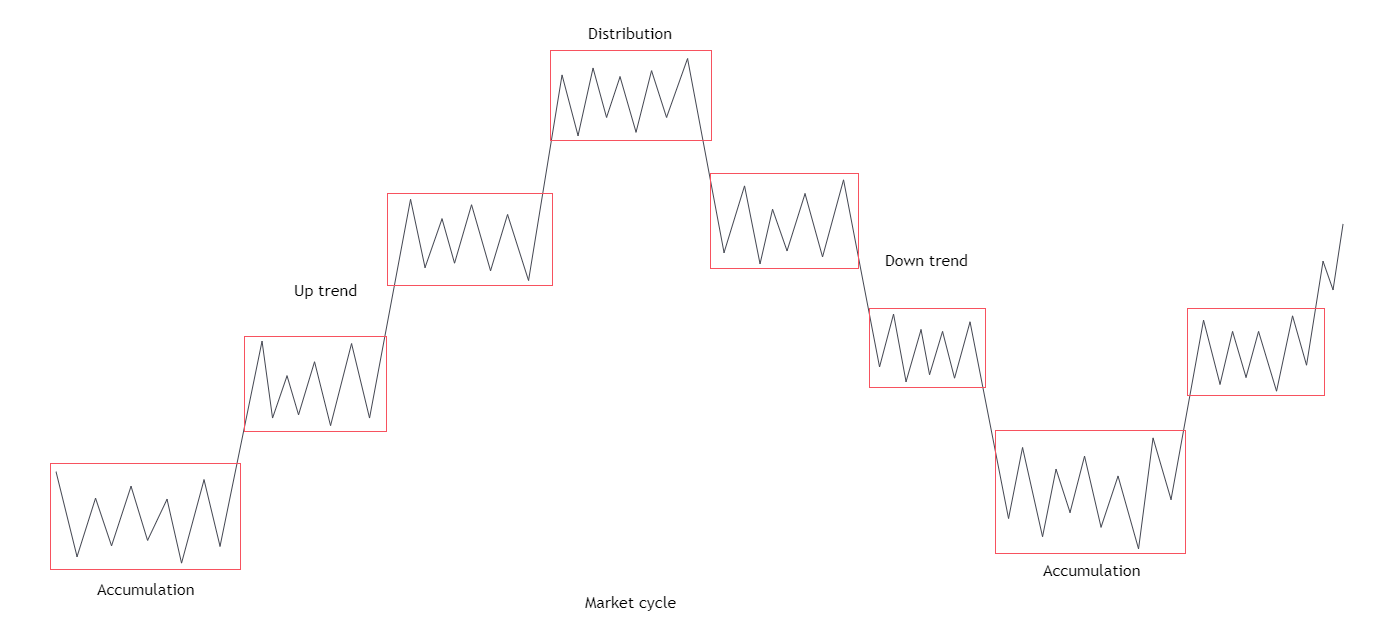
You must realize that this is only one of the patterns. Price always moves relative to the priority of buying and selling.
Graphic example
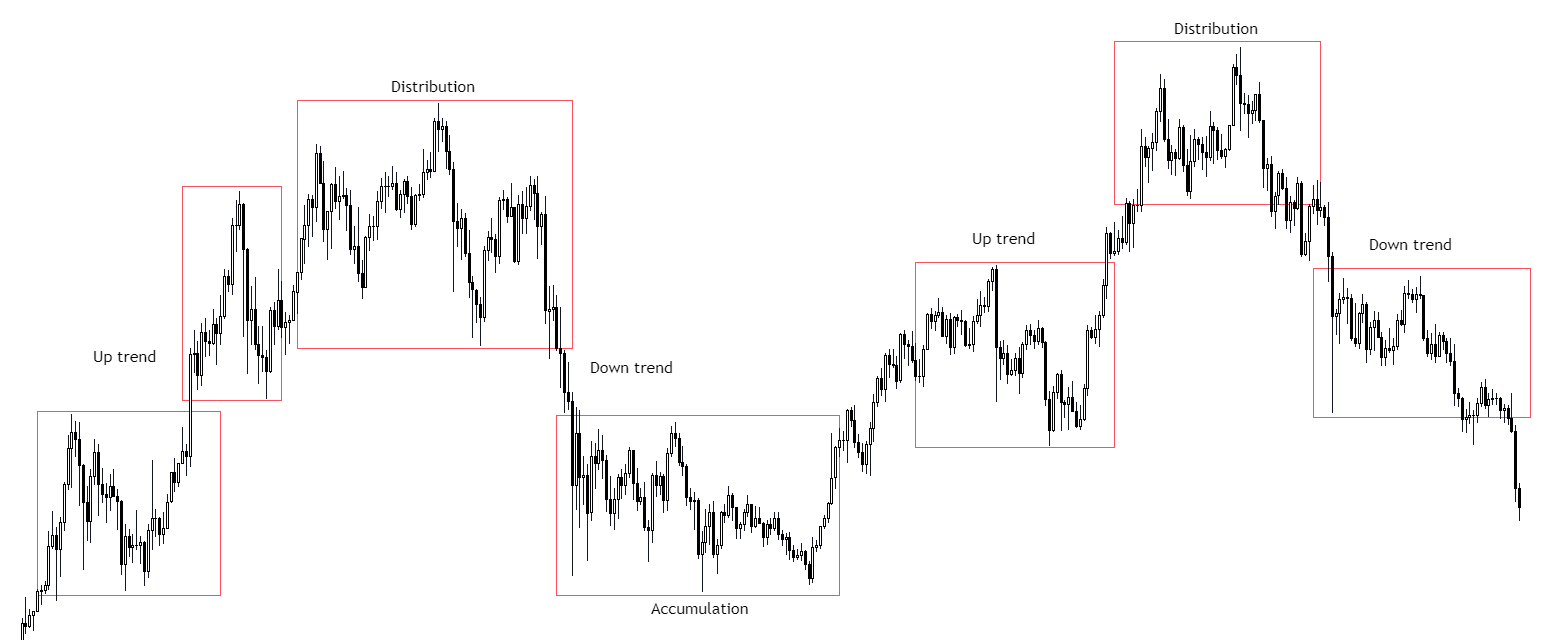
Trend movement formation - impulse and correction
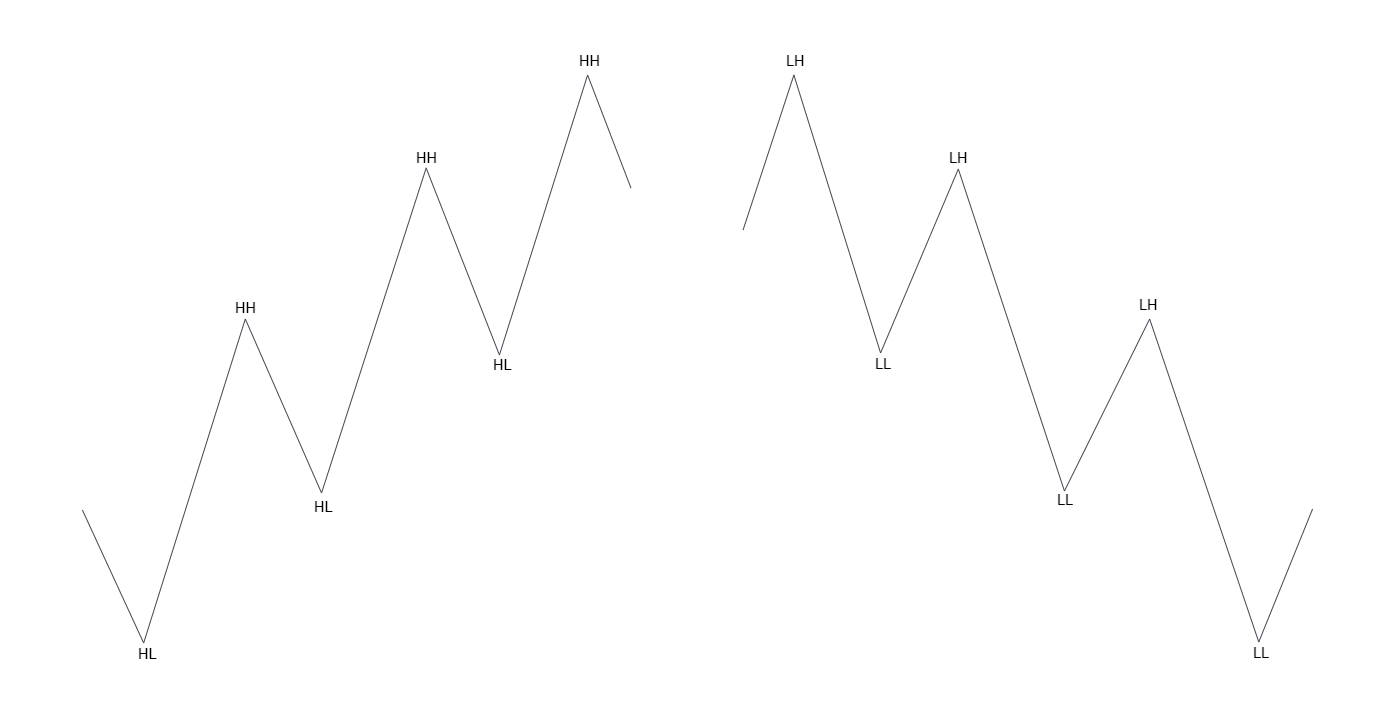
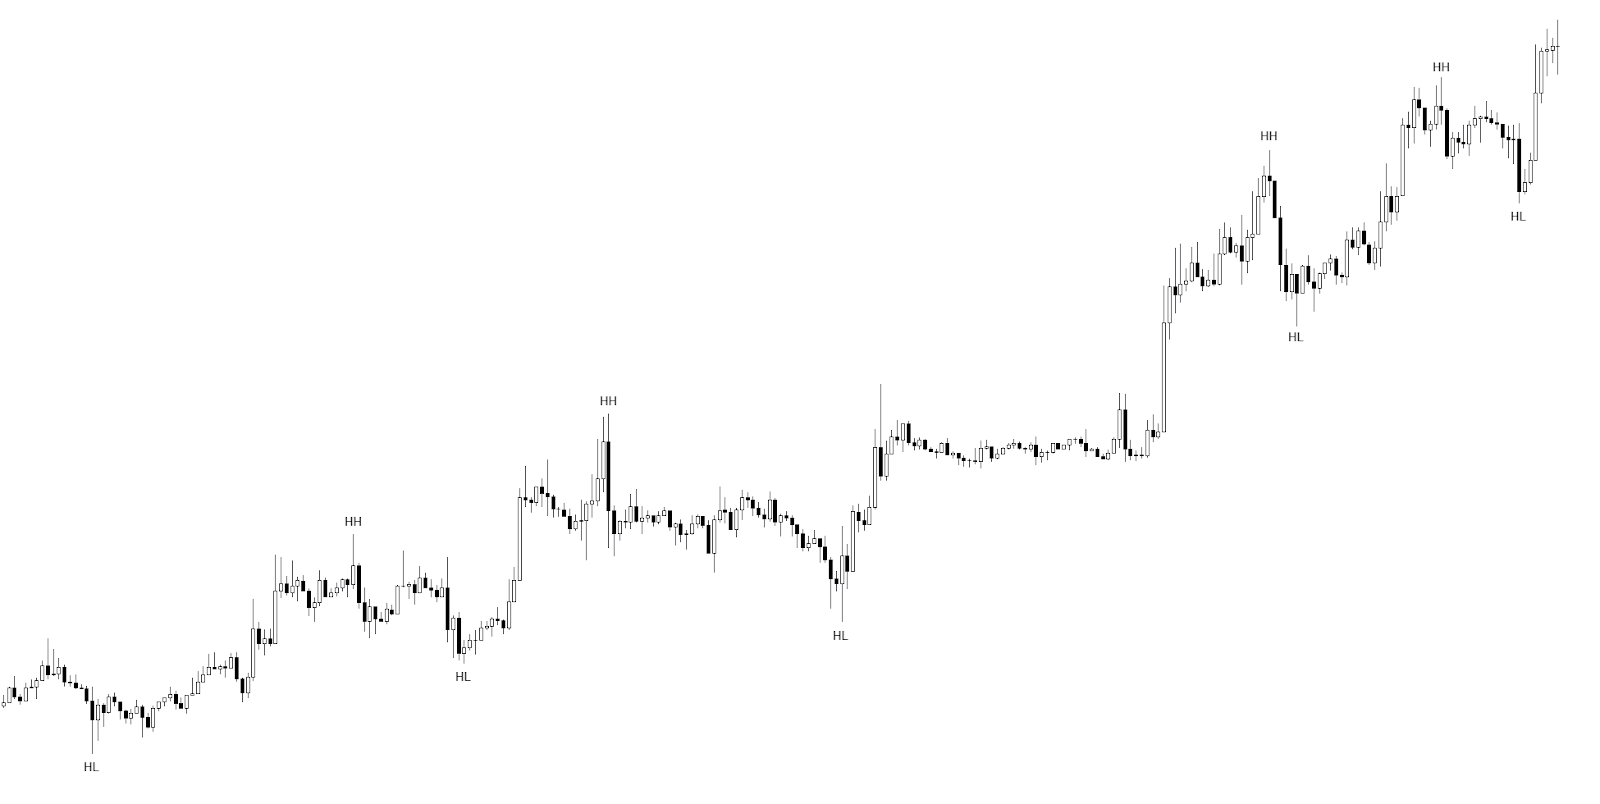
A trend movement is formed due to a significant amount of buying/selling. That is why the trend is characterized by the increase/decrease of price highs and lows. Uptrend - rising highs and lows we denote as HH/HL.
Descending trend - we denote decreasing highs and lows as LH/LL.
Schematic example
Graphical example
Uptrend
Downtrend
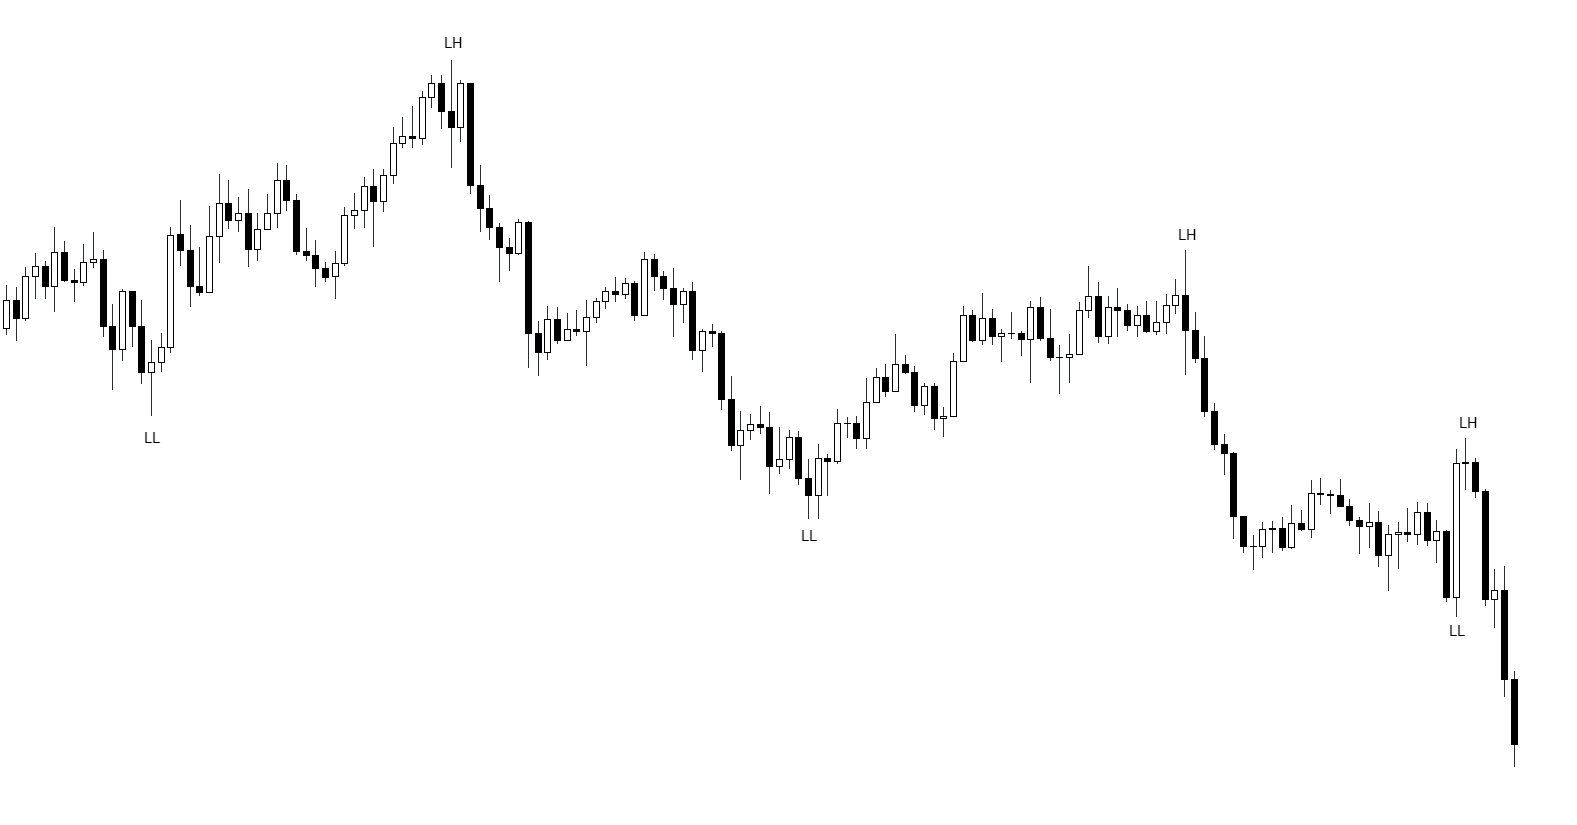
To define a valid trend movement, we divide it into two parts: momentum and correction.
Schematic example

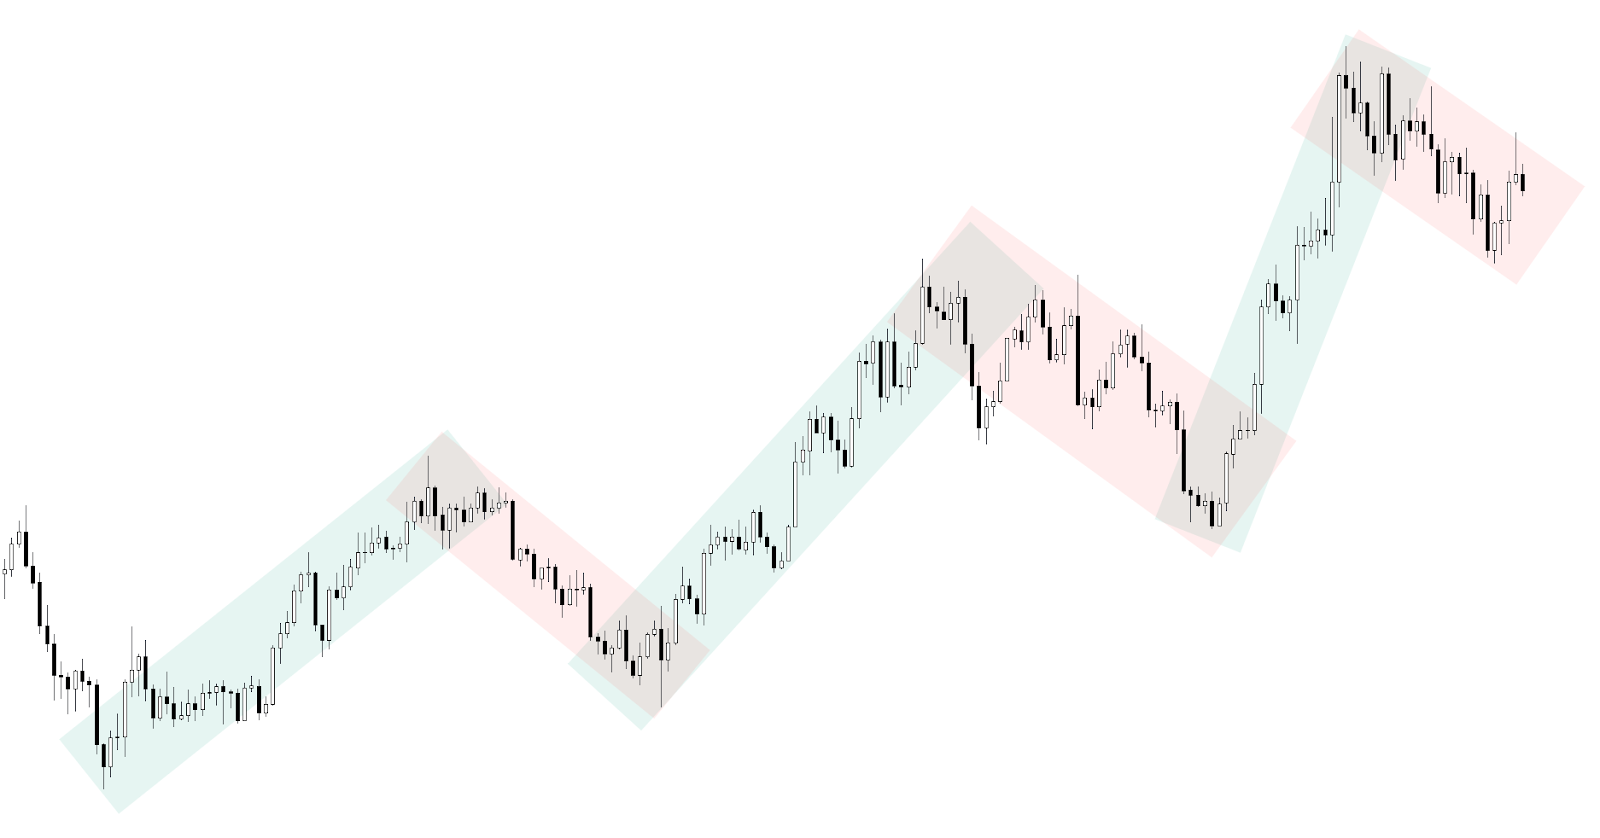
The nature of the market is that any movement in a trend is followed by a with a correction. The market balances itself. As with any process, a sharp spike in the market is always followed by a pullback. The bigger the jump, the bigger the pullback. To understand the situation in the market, you need to know what is an impulse and correctional movement.
Impulse movement is a movement directed along the main trend.
Correctional movement is a movement directed against the main trend.
Graphical example
3. Swings. Strong High/Low. Weak High/Low
Swings are structural points that are formed according to a trend movement. If we emphasize a downtrend, the swings are LH/LL, if an uptrend - HL/HH. HL/HH.
We can designate that Swing High is a higher maximum relative to the trend movement and Swing Low is the lowest maximum relative to the trend movement.
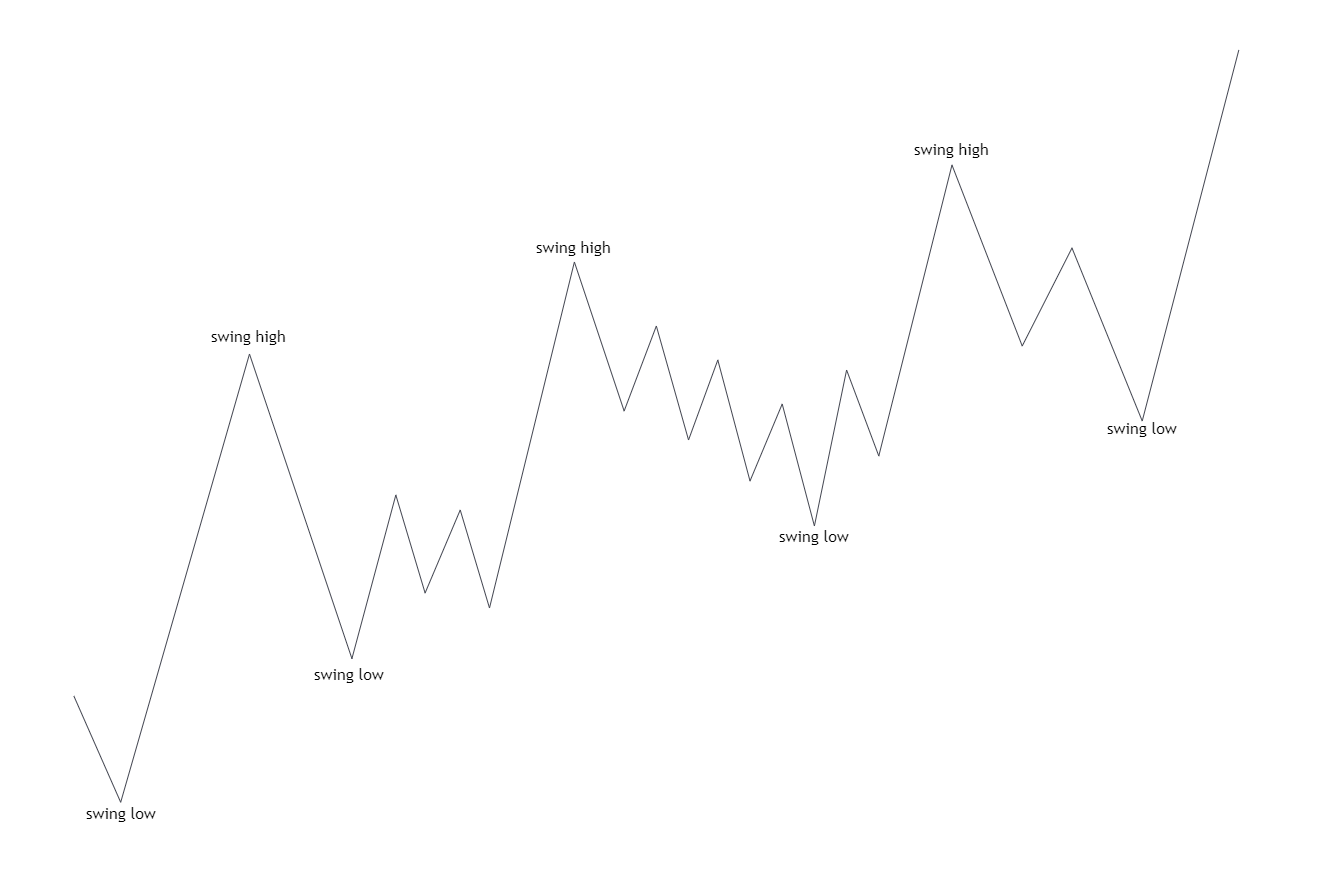
Swings form zones that are conditional support and resistance on the trend movement. Renewal of these structural zones acts as a fact of change direction of movement.
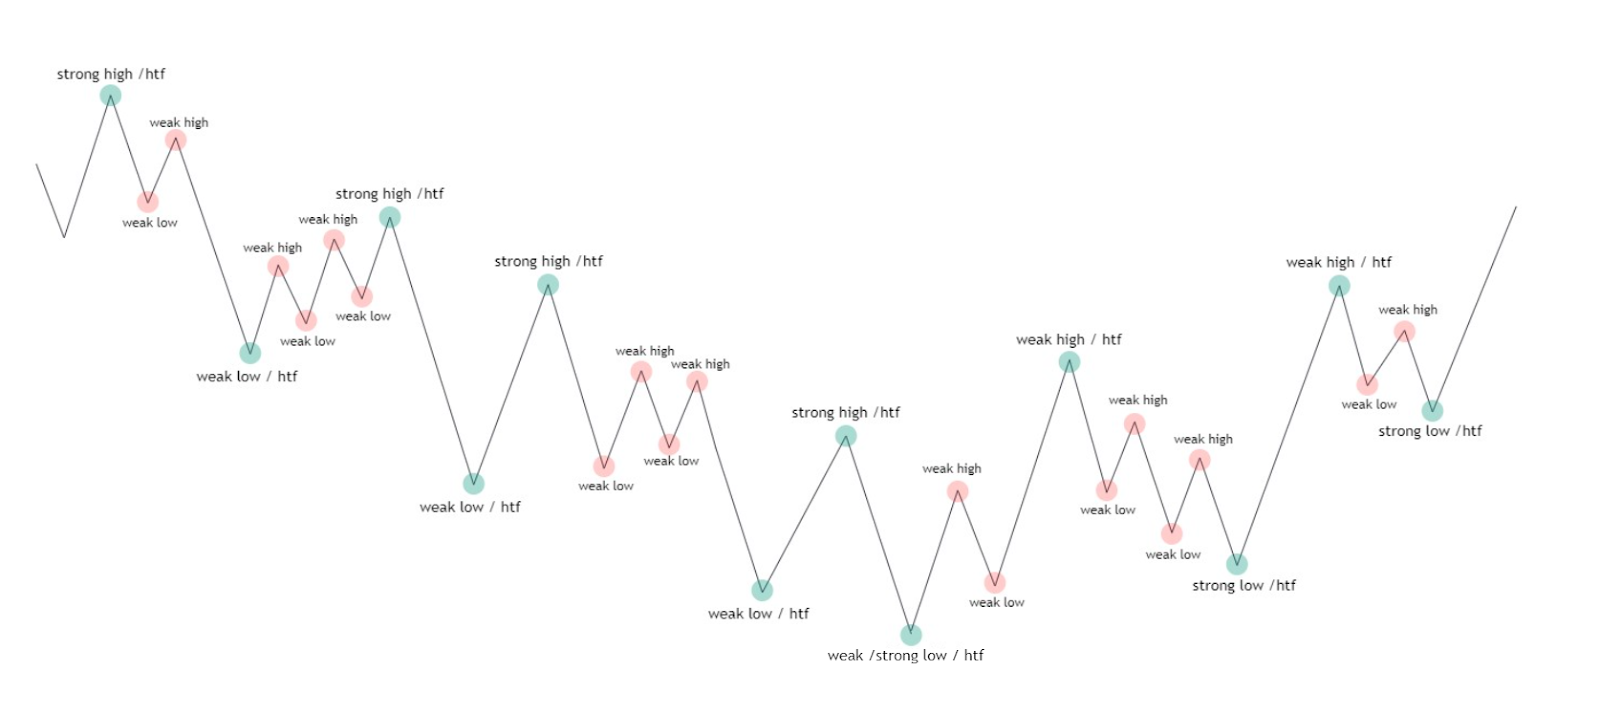
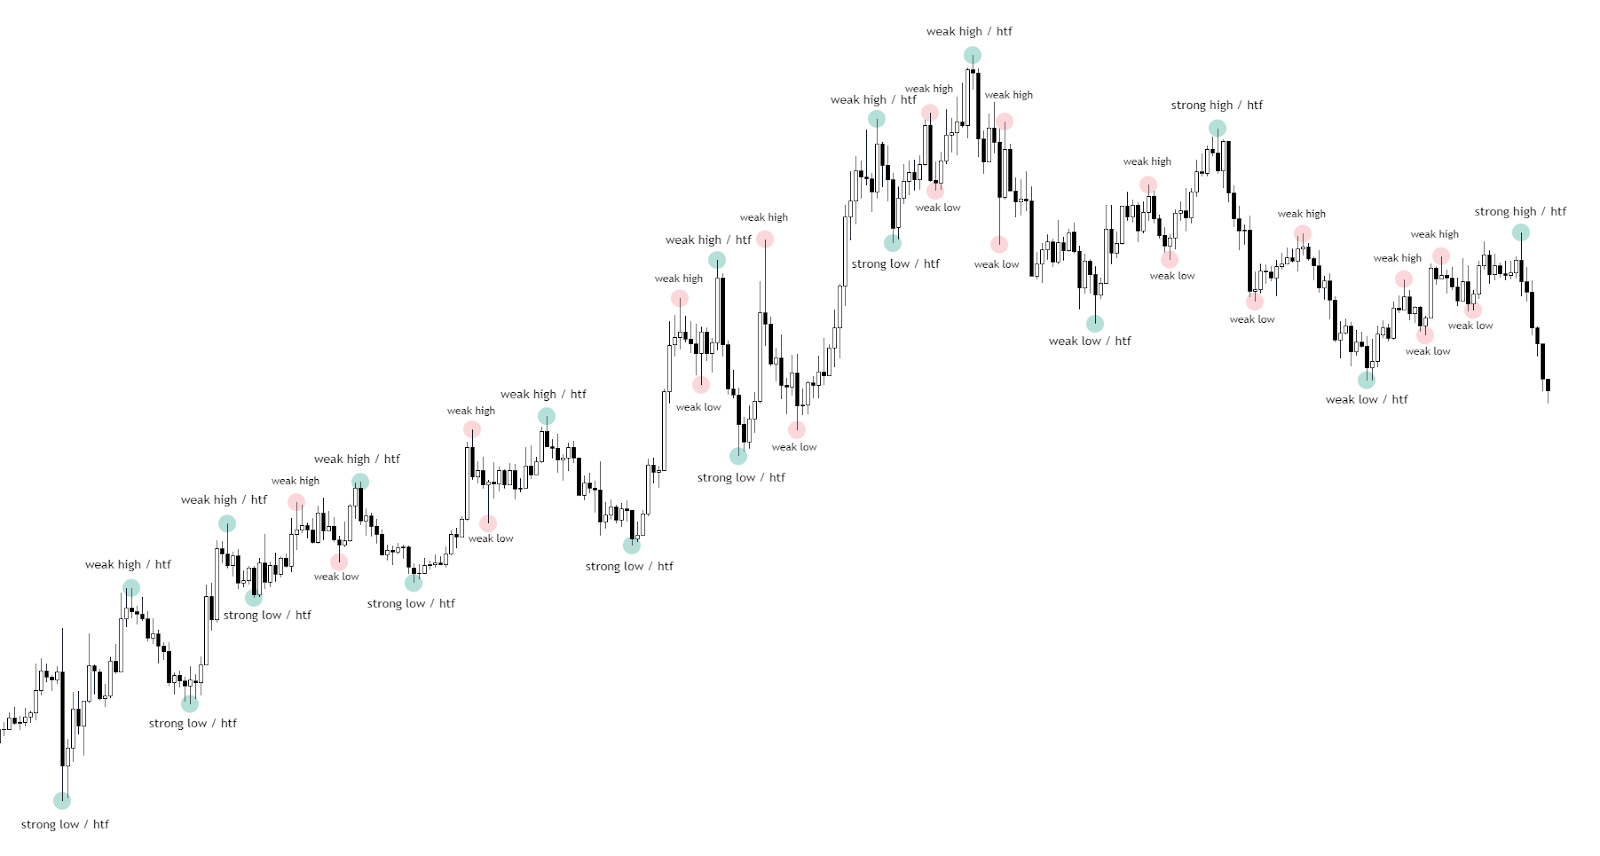
Key structural points (swings) are divided into Strong High/Strong Low and Weak High/Weak Low.
Strong/Strong (key) - swings, when approaching which the price gets a reaction and we can observe the continuation of the initial movement.
Most often formed in the range of the previous swing. The reaction that follows this phenomenon causes a structure update (conf) and cancel the weak swing.
Weak - swings that have no influence on the trend movement of a particular timeframe. Price rarely gets a strong reaction from such swings. They are broken through with subsequent updating of the structure (conf).
Schematic example
Strong High/Low are marked in green.
Red and orange Weak High/Low.
Schematic example
4. Break/update of a market trend break
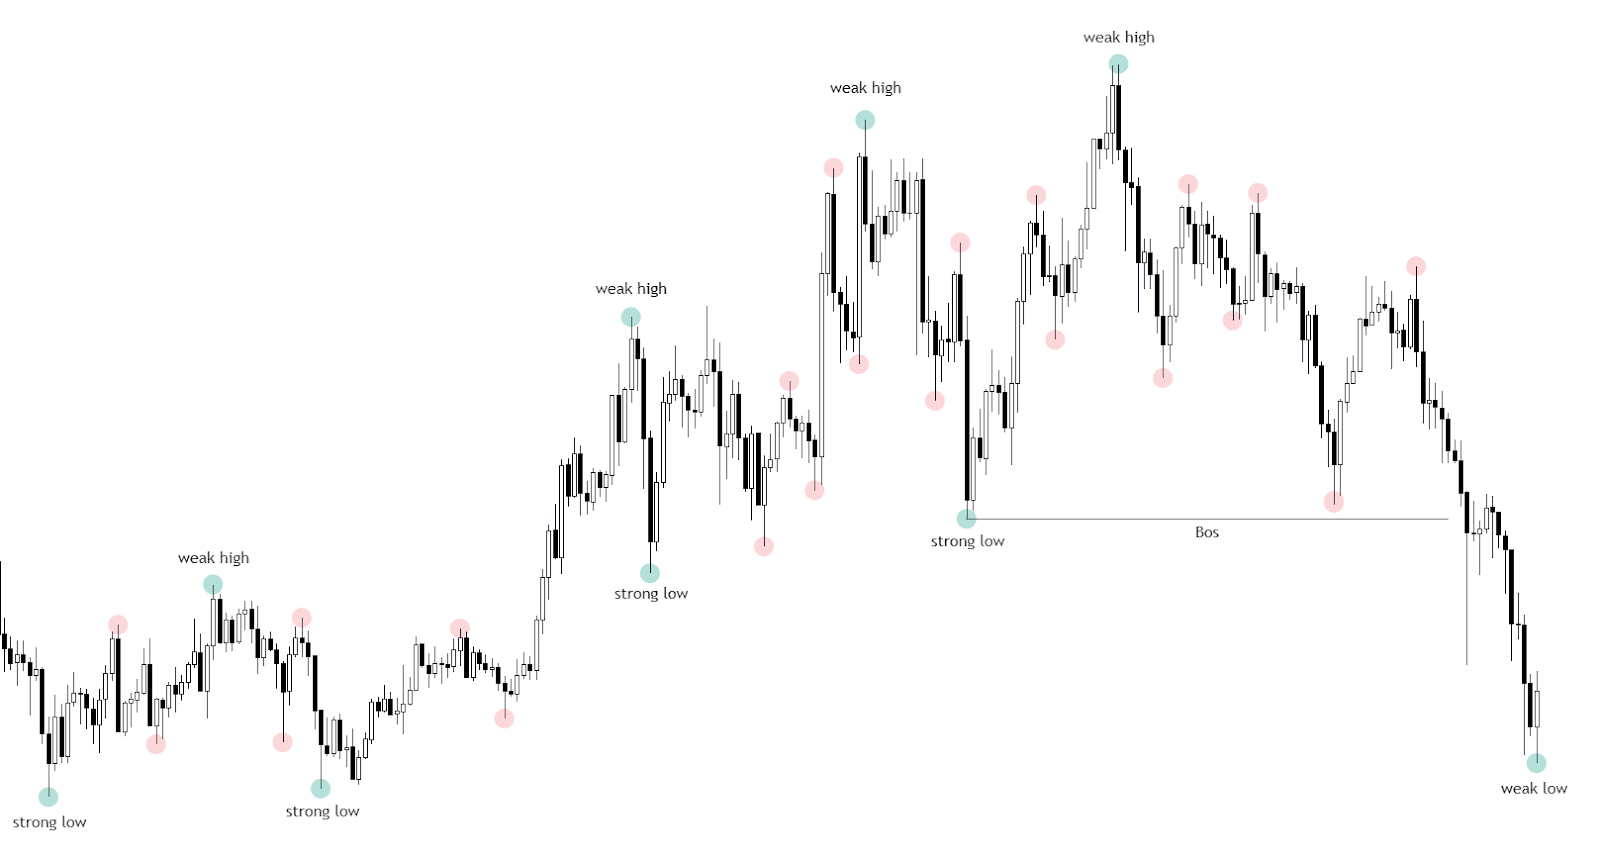
Break of structure (bos) - a specific low (strong low) on an upward movement and a high (strong high) on a downward movement, which is the key to the trend.
A market trend change occurs at the moment when the price values go beyond the limits of this swing.
Schematic representation of a trend change (BOS) from upward to downward movement
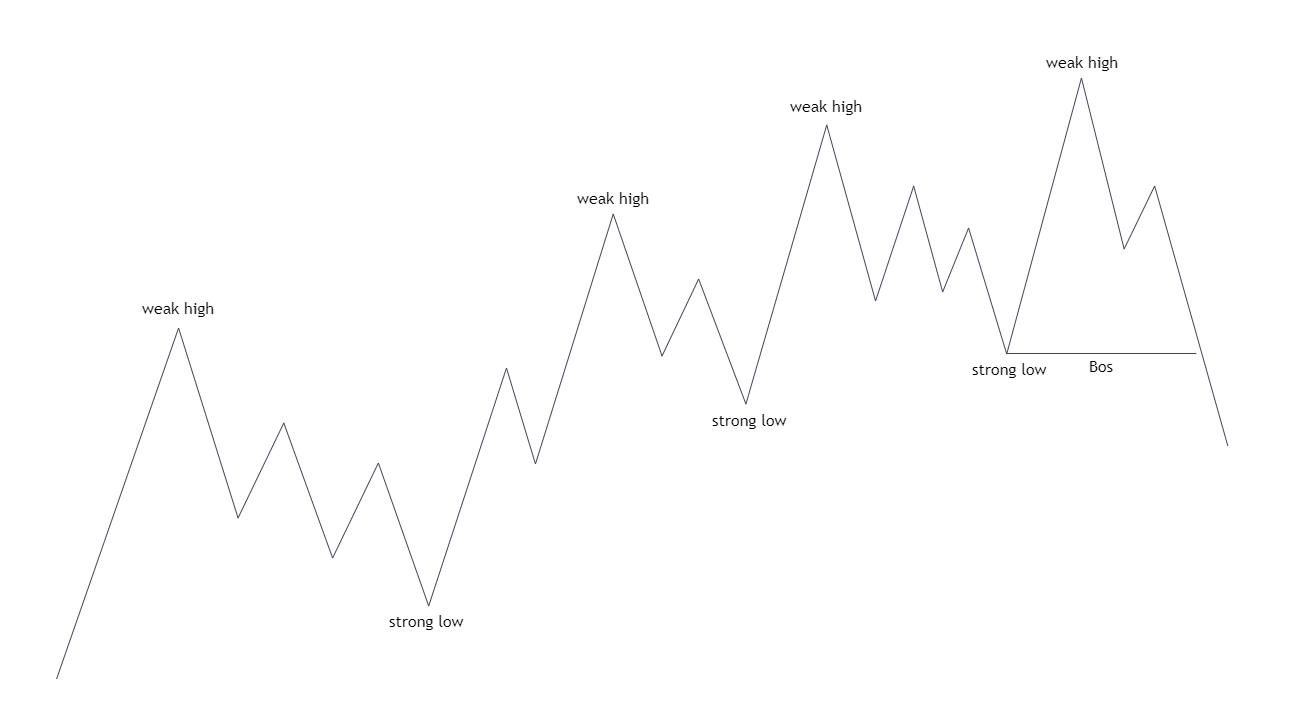
After updating the key low, we may see a change of direction of the movement.
Schematic representation of the change of trend (BOS) from downward to upward trend
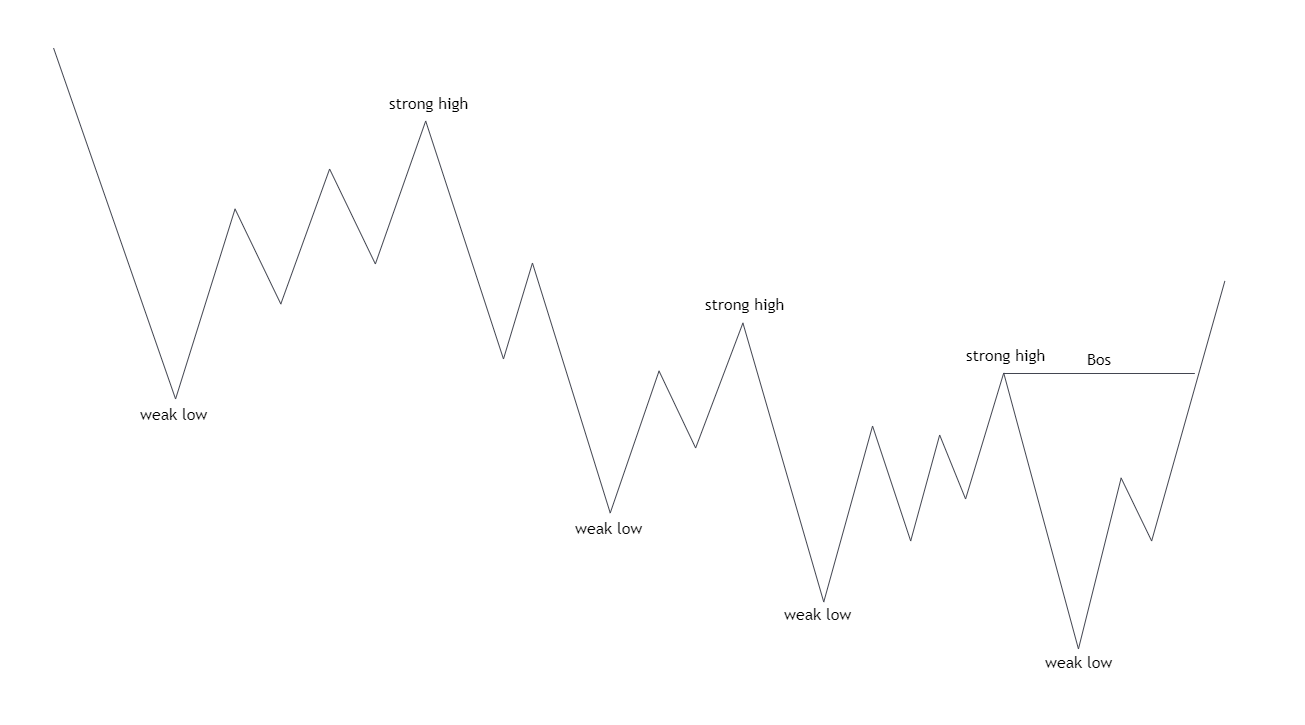
After updating the key high, we may see a change of direction of movement.
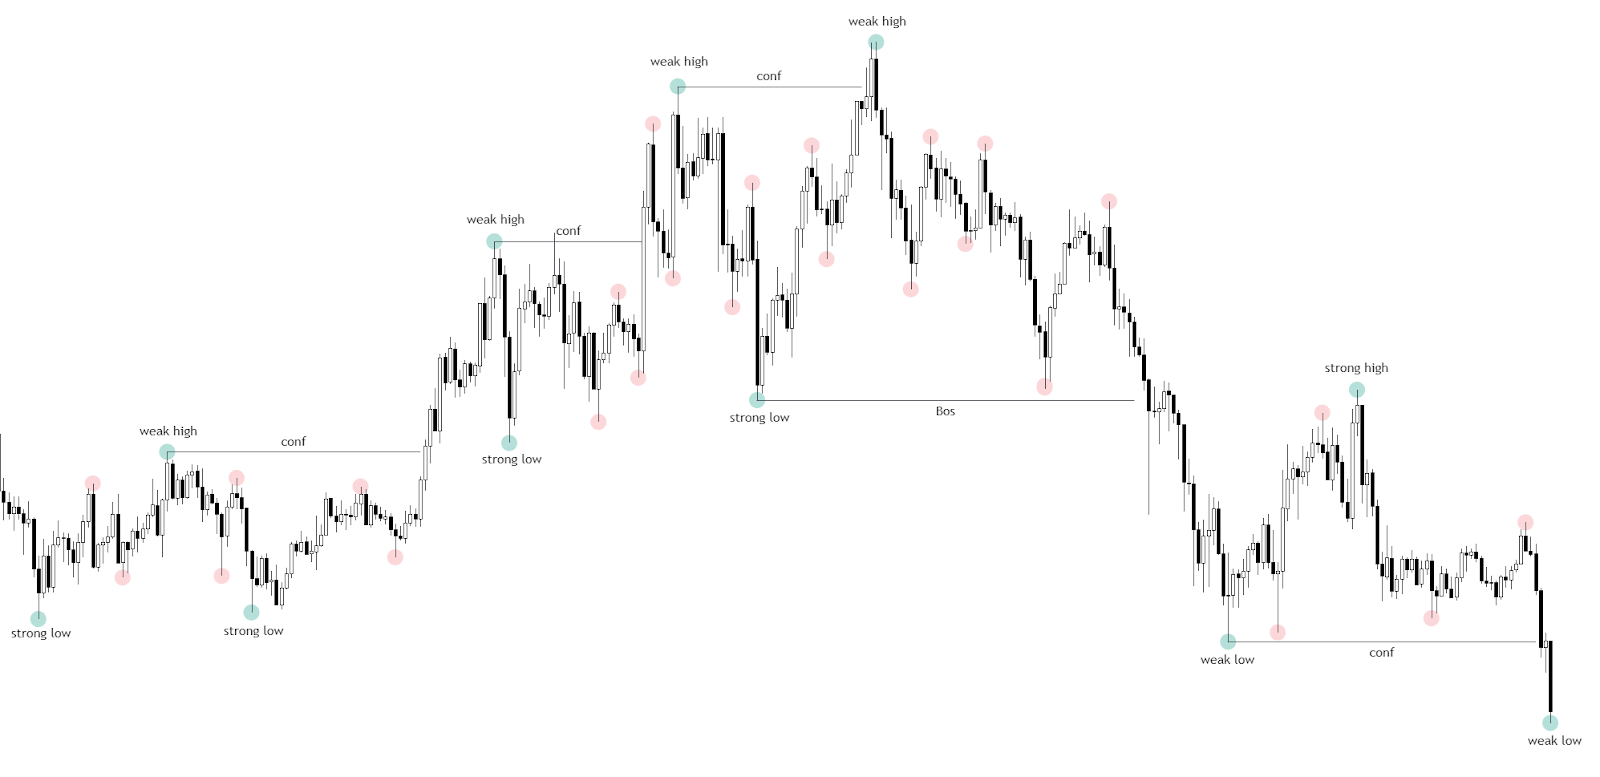
Graphical representation of the change of trend (BOS) from upward to downward trend
Graphical representation of a trend change (BOS) from downward to upward trending
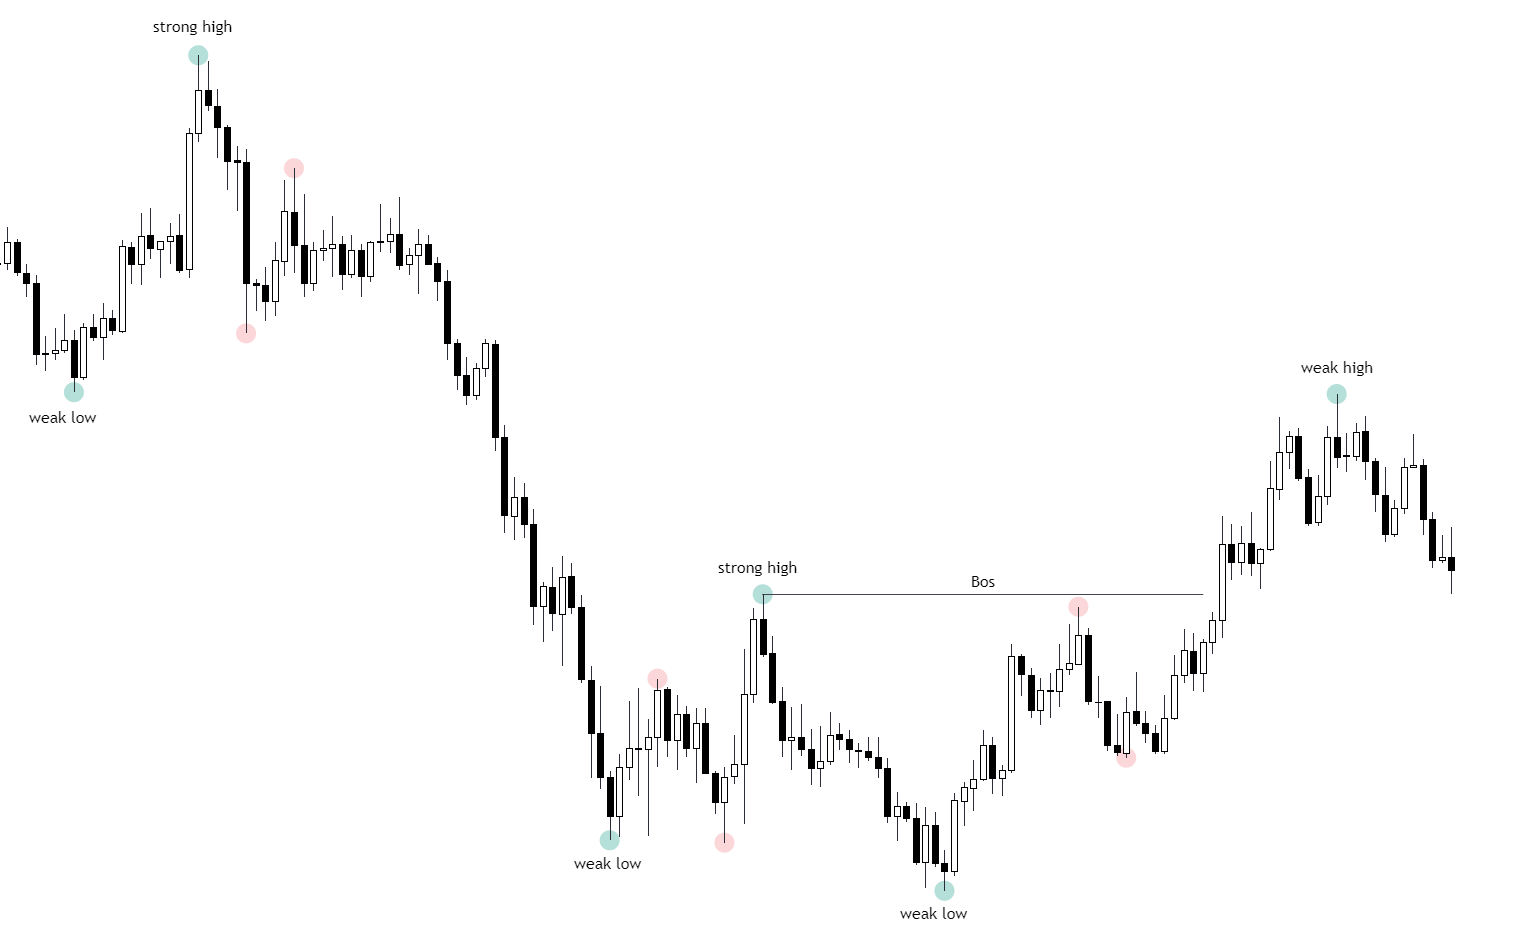
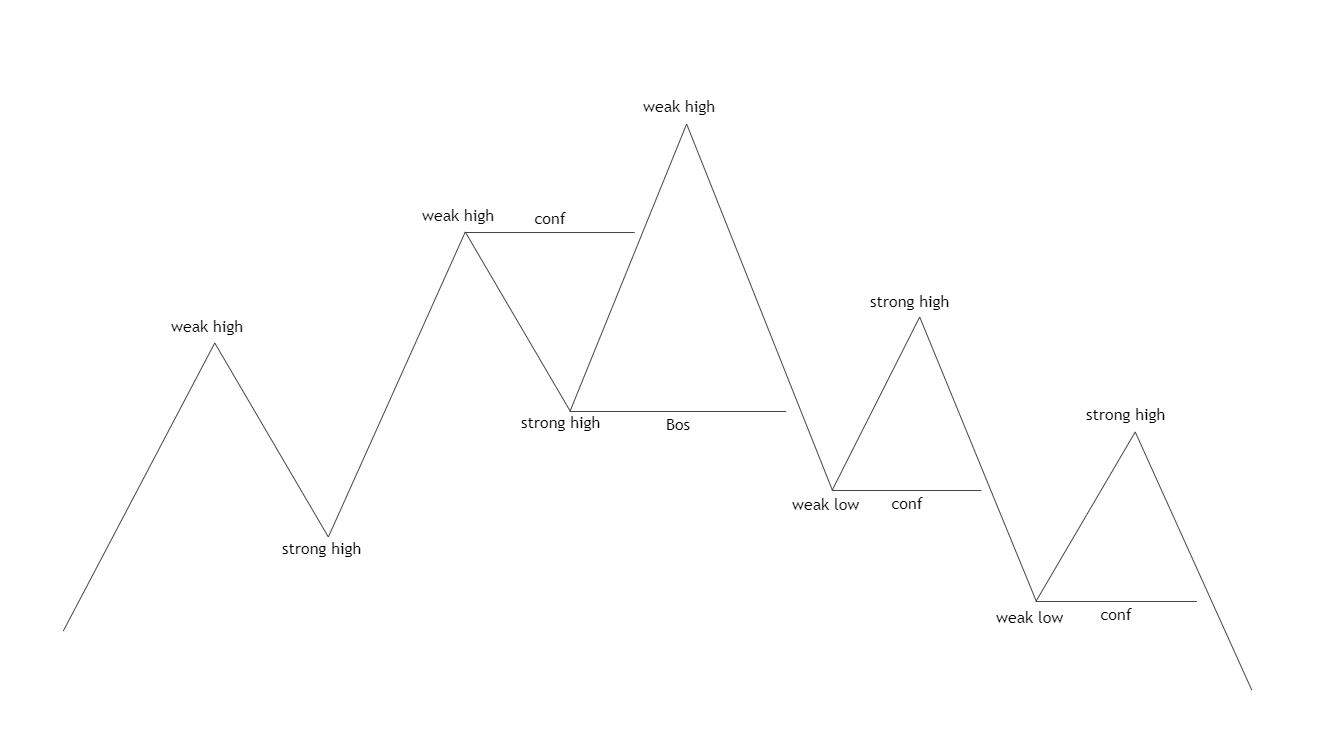
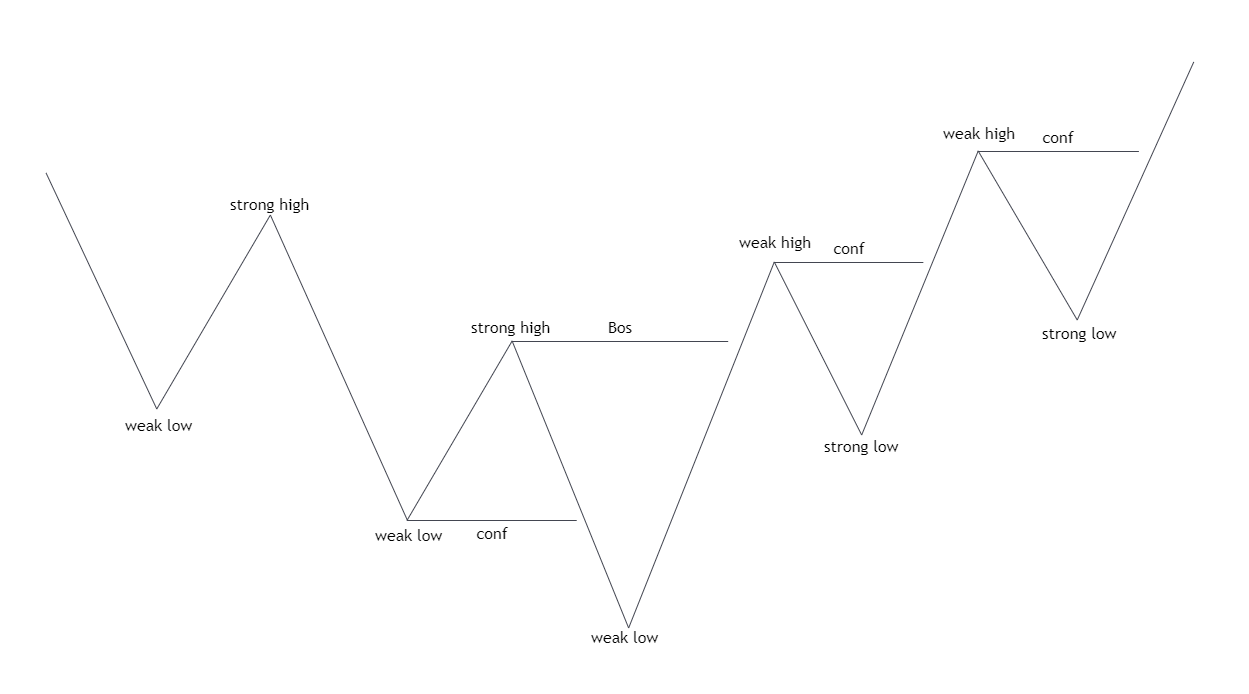
Conf (confirmation) - confirmation (update) of the market structure break. Updating of the key minimum/maximum of the new structure. Structural Confirmation gives understanding that the market has completely changed its priority and is moving in the opposite direction.
This is the first reversal signal, which gives the opportunity to work with further movement from its inception.
Schematic example of Conf on the incipient downward movement
Graphical example of Conf on a nascent downward movement
Schematic example of Conf on a nascent upward movement
Graphical example of Conf on a nascent upward movement
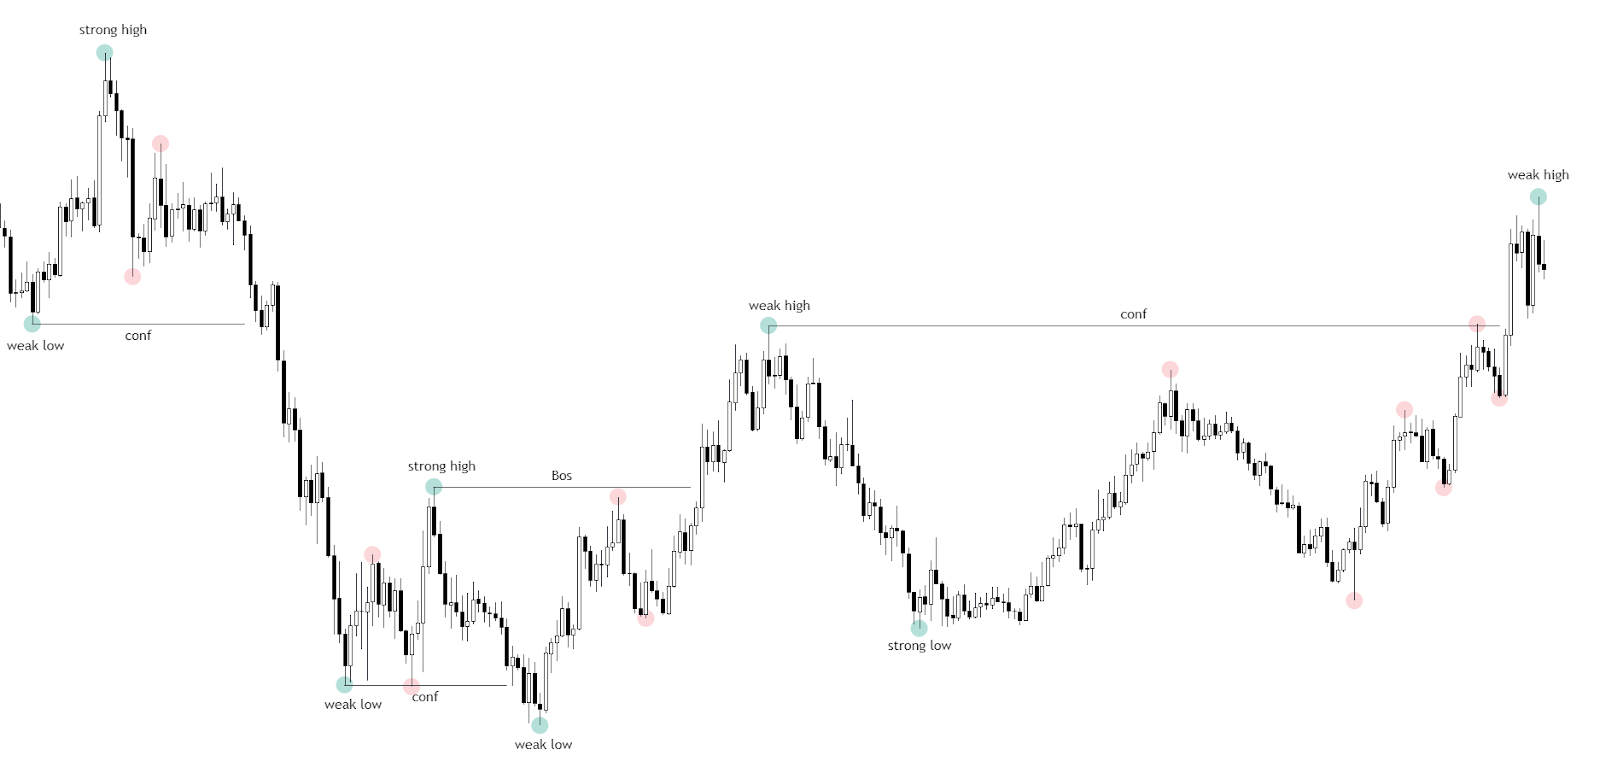
An important point for building a structural movement is the proper selection of a structural point, which is the key to the change of priority
Schematic example
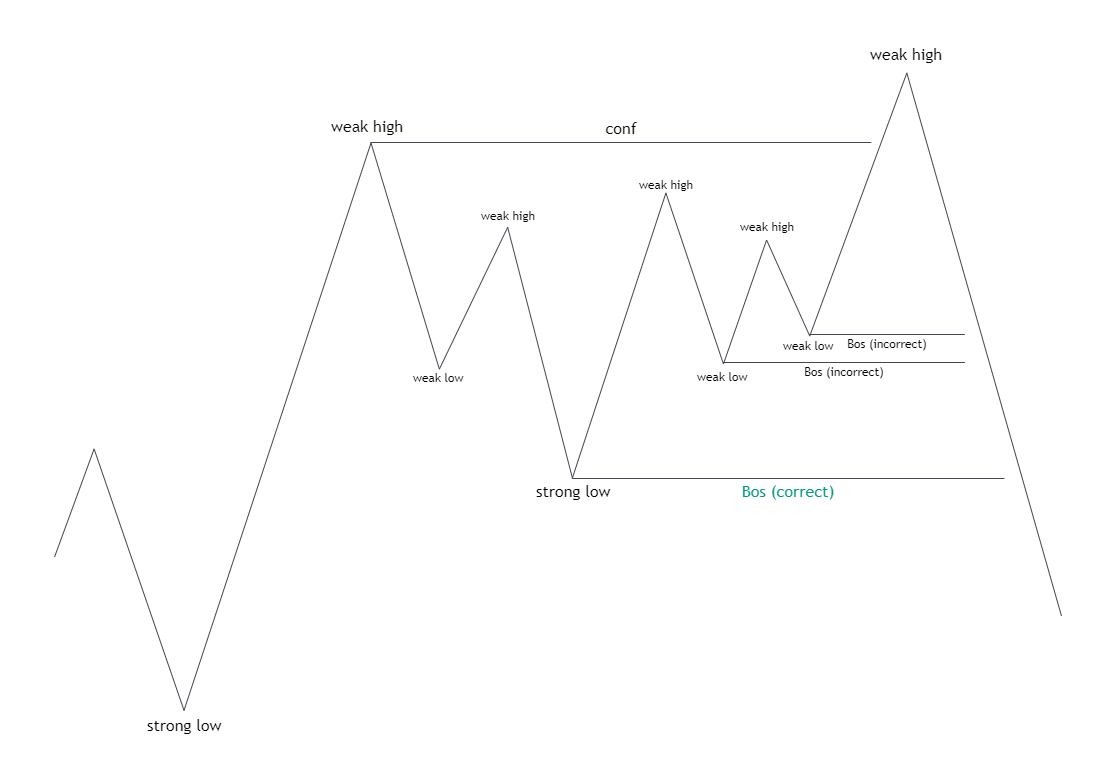
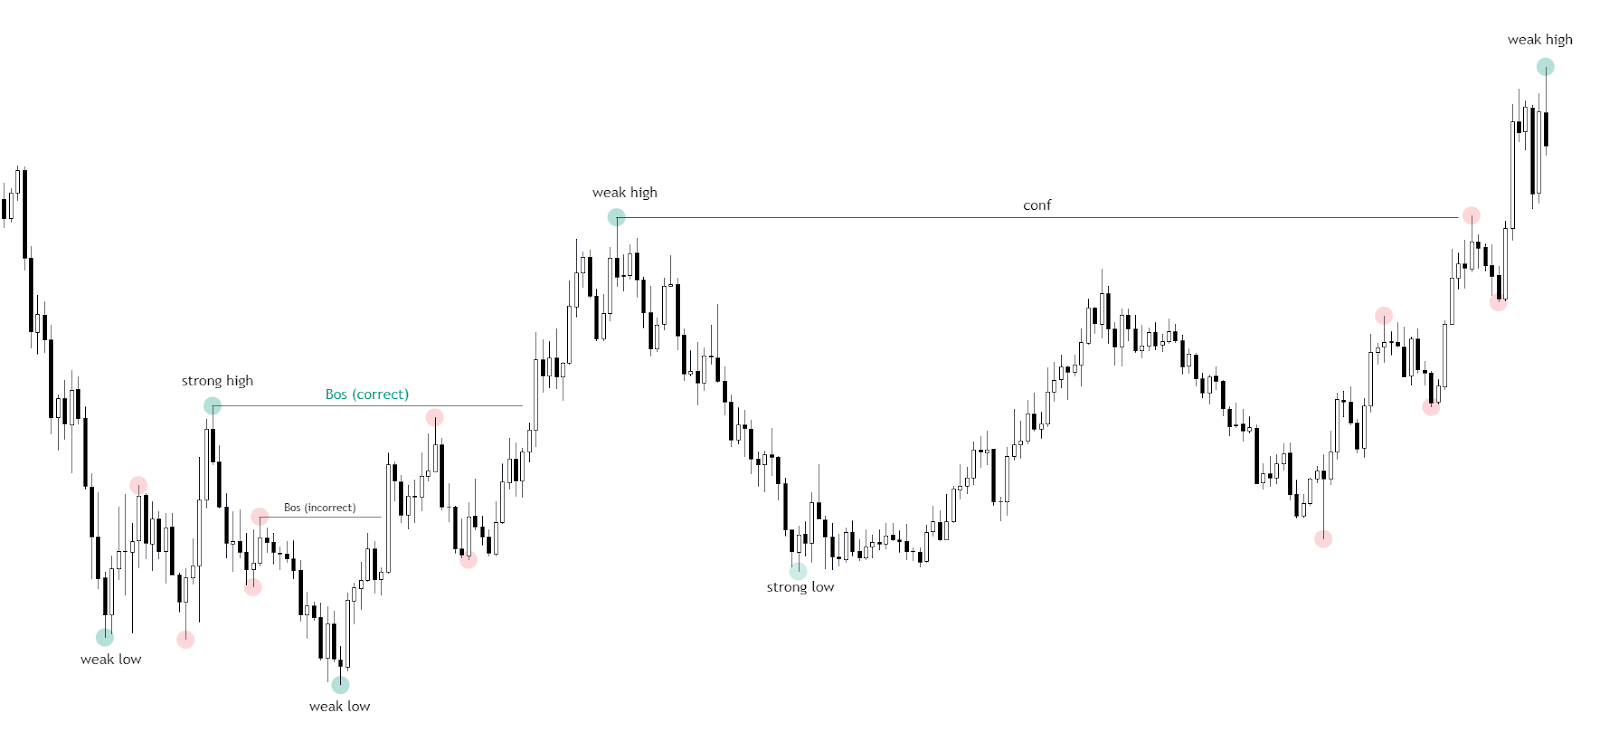
The absolute minimum (strong low), which gave birth to the movement that updated the maximum (weak high), will be the breaking point of the structure.
If we are talking about a downtrend, then we choose the key high, which has triggered the movement to update the key low in the direction of the movement.
Schematic example
5. Identification of break/renewal of structural movement
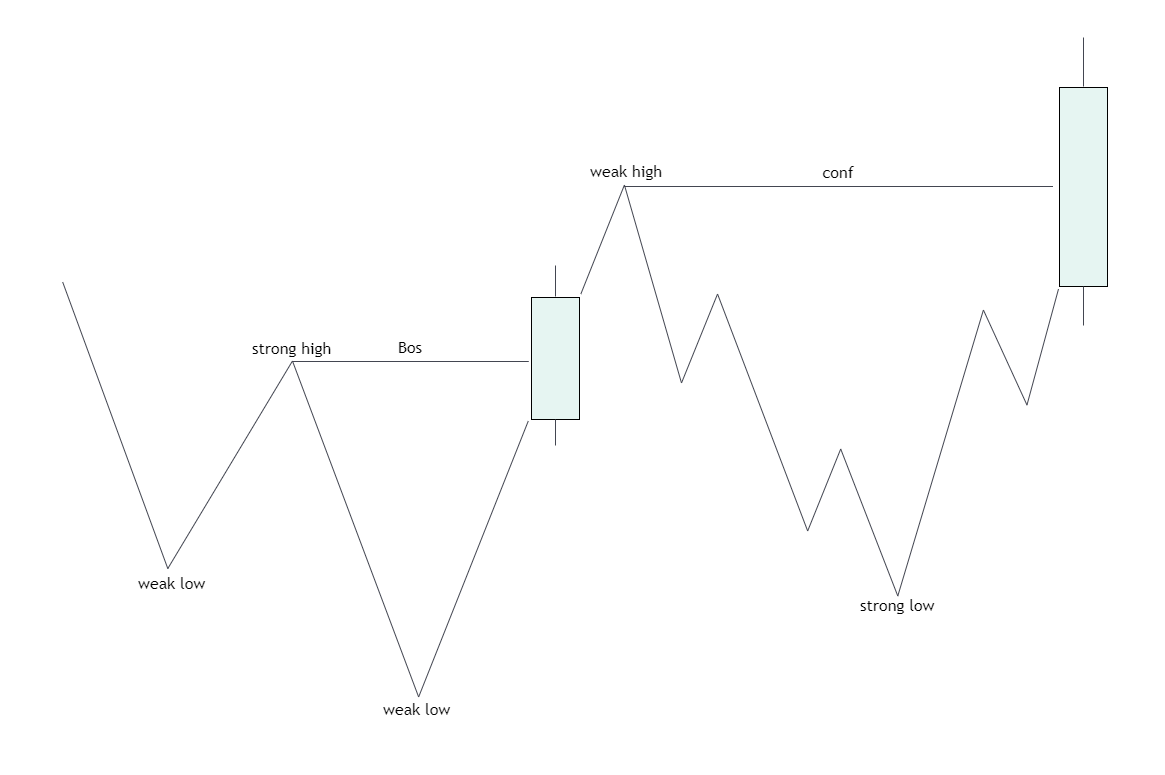
The main problem in identifying a break, or confirmation of a market trend break, is the issue of fixation above/below the key structural movement.
The true renewal of the structural movement will be confirmed by the candlestick formation above/below the key structural highs/minimums.
Schematic example
Graphical example
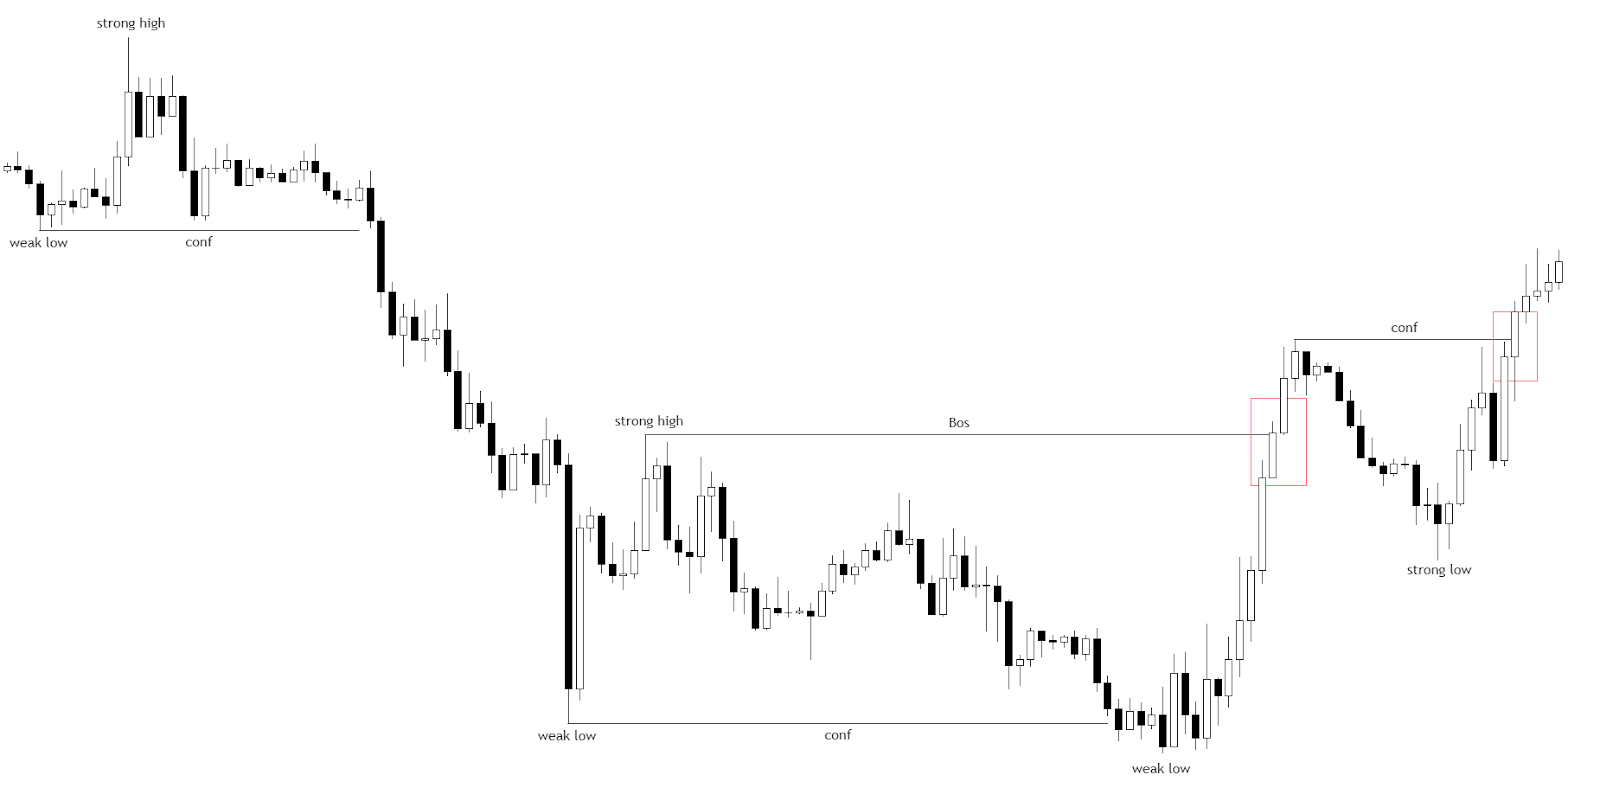
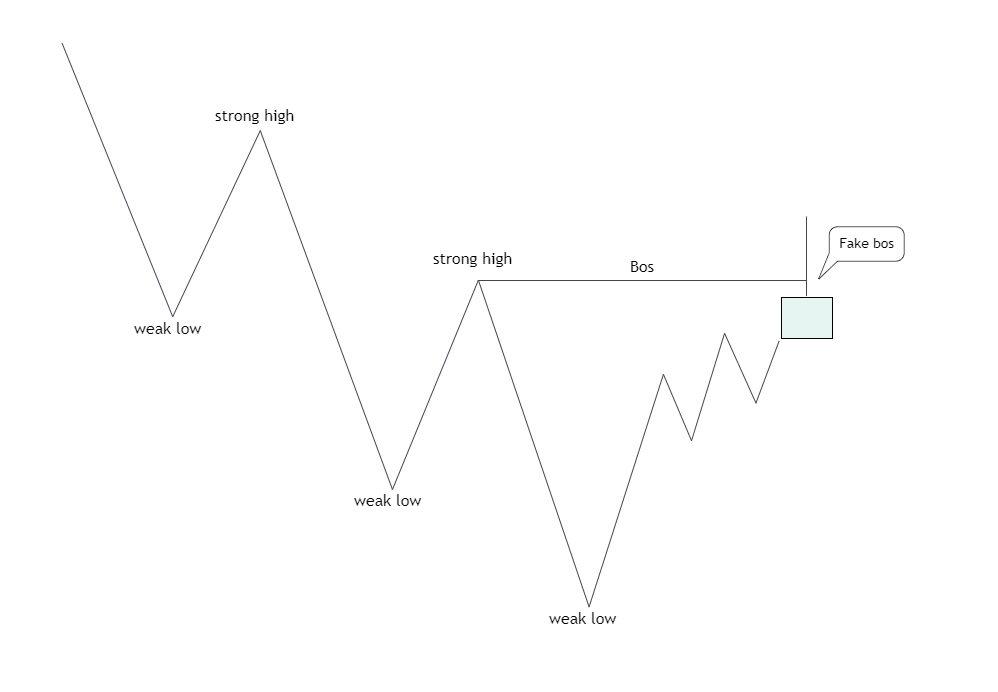
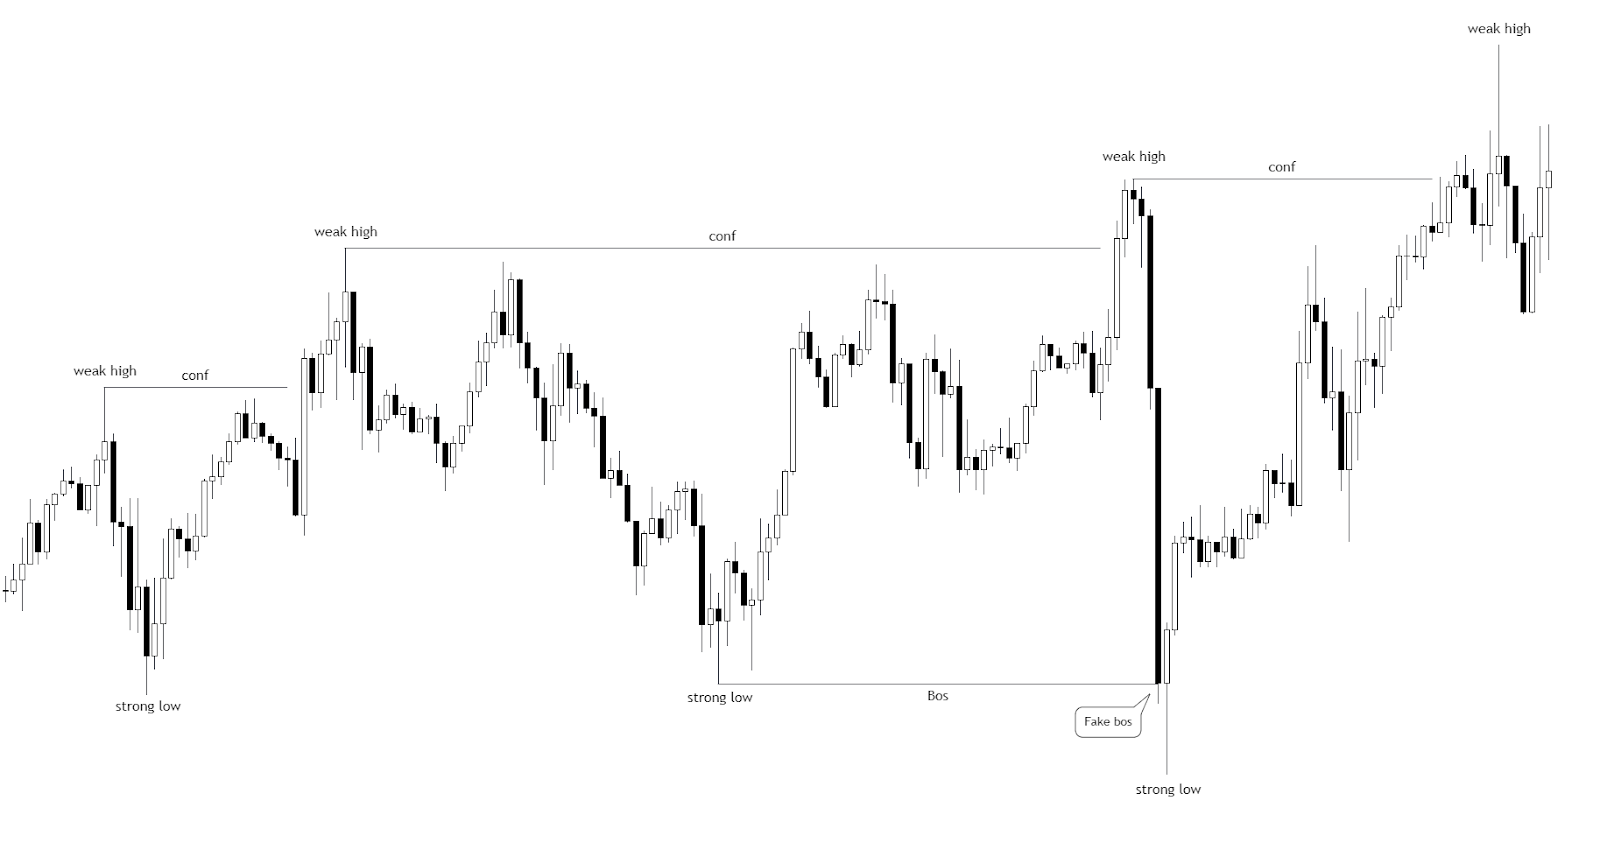
The absence of consolidation indicates that above/below the key structural The price has no interest to consolidate. This move is a price manipulation and is labeled as “FAKE BOS”.
Schematic example
Graphical example
6. Conclusions
In order to find an acceptable zone for buying or selling, you must learn to correctly determine the direction of price movement. Working with the market structure is the foundation for working with the market.