Market Summary #2
JACKWHITEIII
During the Tulip mania (1636-1637) were no indicators, then in 1978 was published "New Concepts in Technical Trading Systems" the book about RSI (and some other Directional Movement and Parabolics) after three financial crises later, traders are still using it.
As you know, Indicators were invented by the people for the people and Konikko is telling me, that after third industrial revolution, trading has change significantly. He says, before indicators and computers 99% of traders were drawing patterns with a pencil on the paper, the rest 1% traded blindly. The reason why am I telling this, is for you to appreciate tradingview and ability to create new account every month to renew the free-trial.
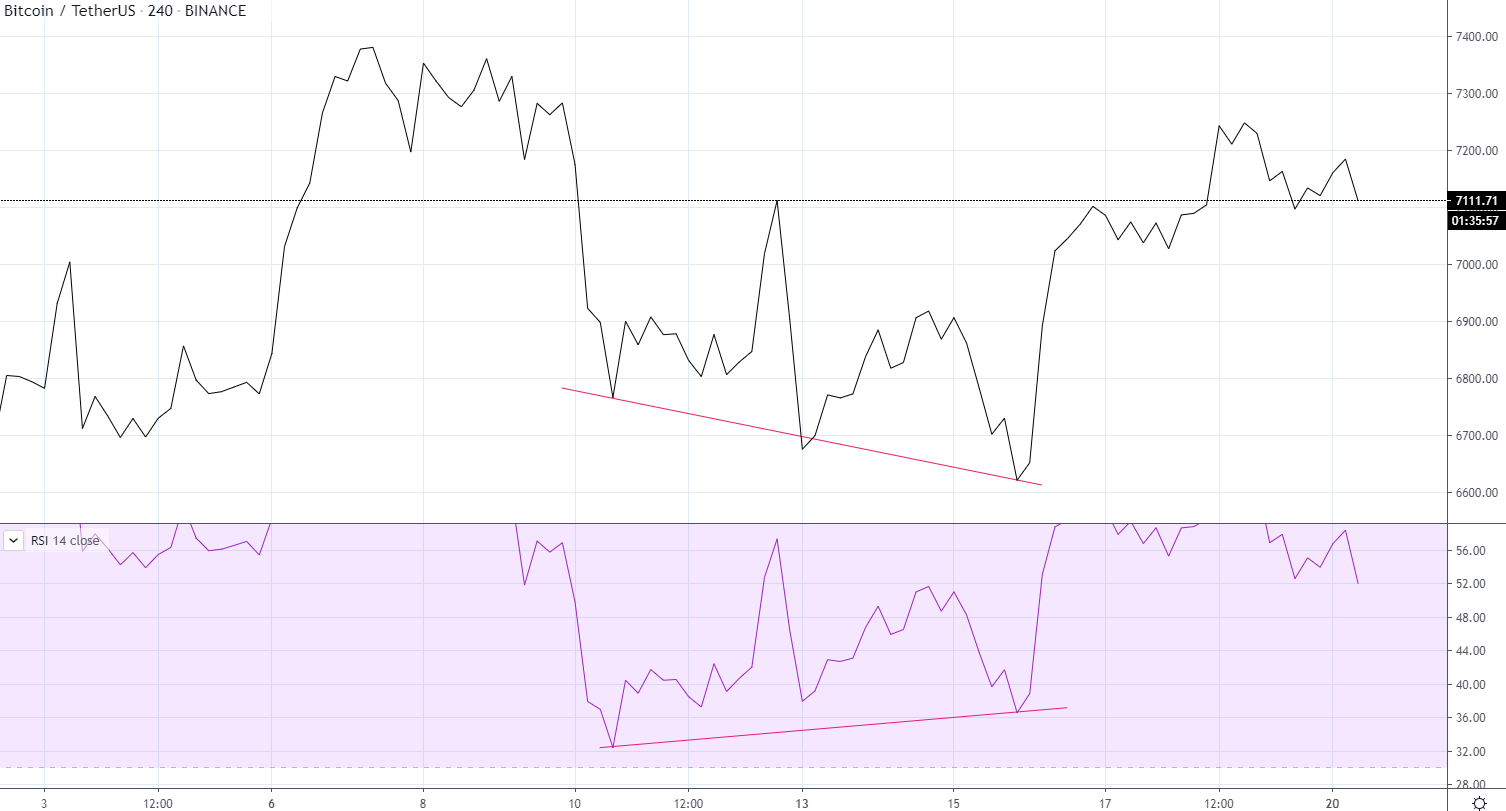
This week, I have switched from Japanese candles to line chart only for RSI. I am shocked how underrated line chart is and how divergence is easily spotted. Quick reminder: line chart shows only closing price (no high nor lows, not even opening)
divergence is something too oversold, price making new lows by faking it, so divergence is something fake. Index is an X-ray of price, noise cancellation tool to see how pure and real the movement is. if it's fake, u are in profit.
This looks like a divergence, but it isn't. This picture appears too often on charts, it has no power, index making new lows means nothing.
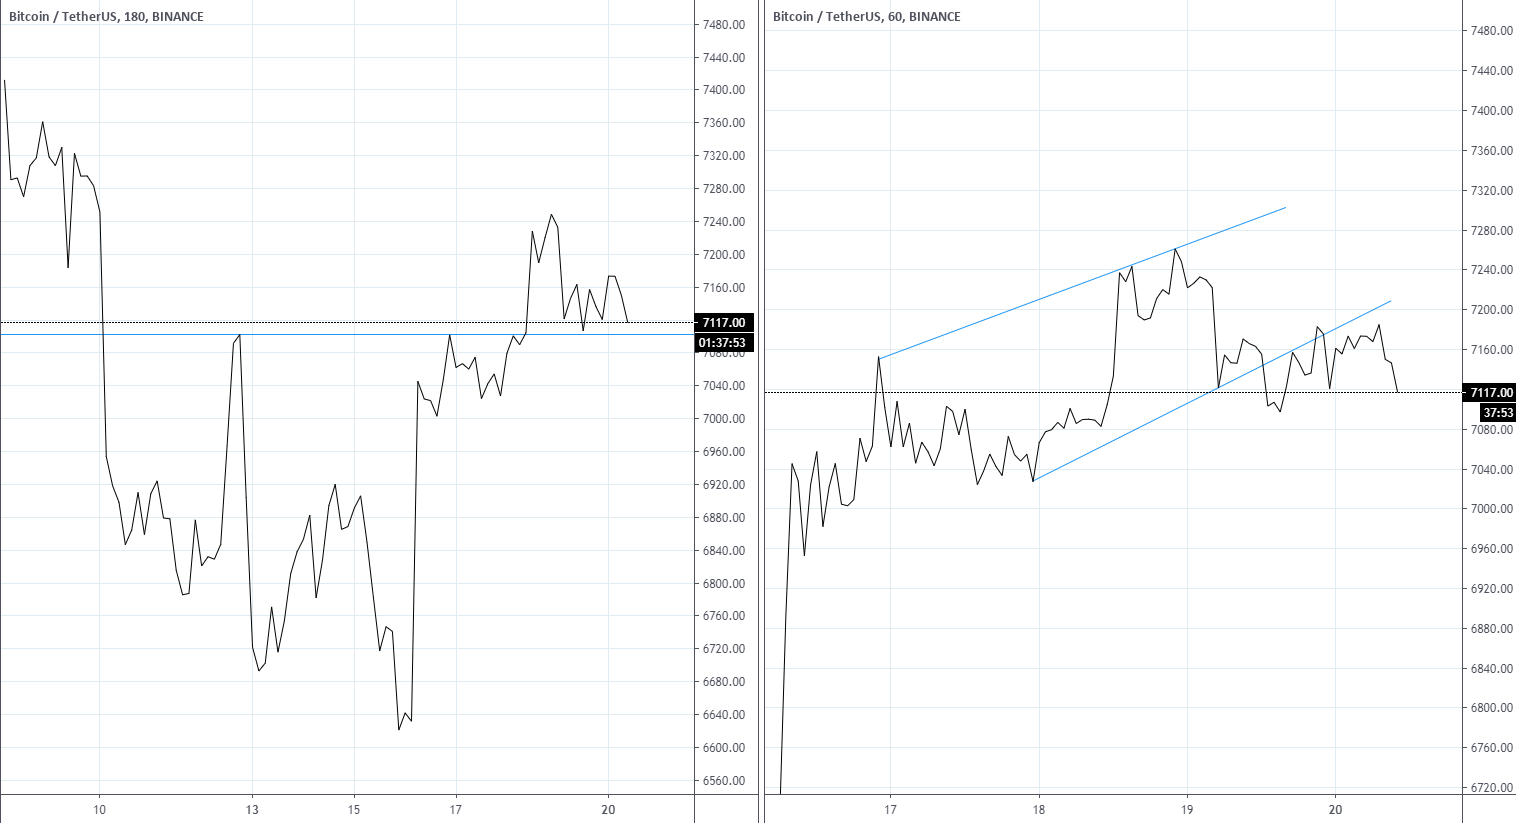
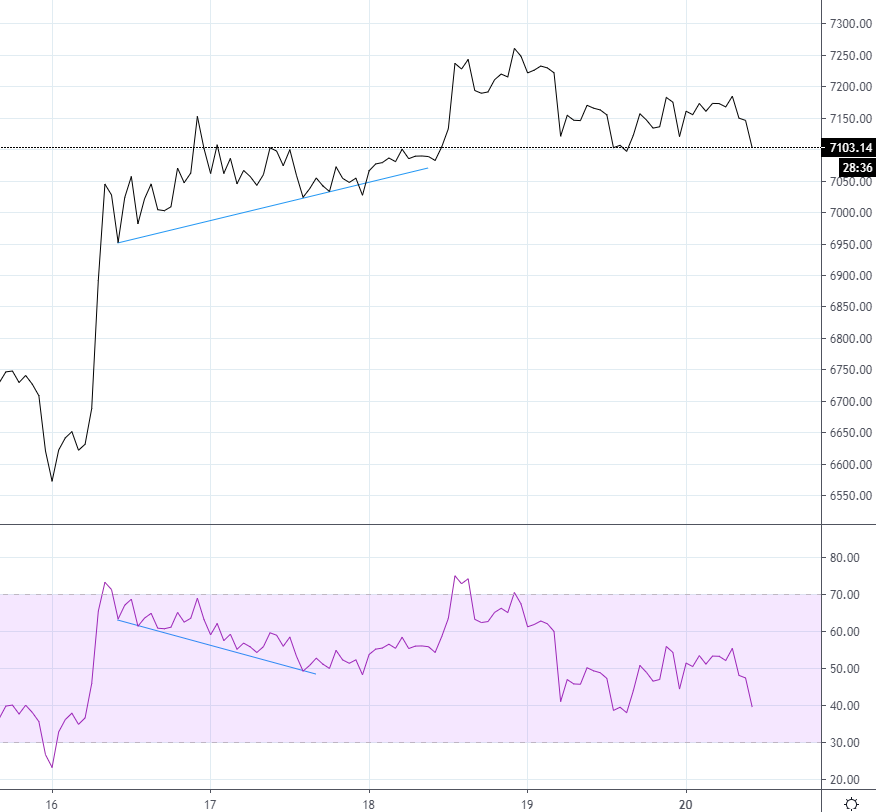
These days market was still, moving sideways, playing on nerves of traders. Although price hit resistance three times, stayed very closely to the line and broke it. Again we saw advantage of the line chart over Japanese candles. Then it grew, almost touched 7300, then bulled back again. Ascending wedge scared me little bit, but it had no big impact on chart.
when I started trading (3 years ago): $450
when I started the blog (16 April 2020): $5870
Today: $6000
Telegram: https://t.me/Konikko_telegram