Linux — How to Evaluate Network Performance?
In my previous articles, we talked about how to troubleshoot network latency and performance problems, also the classic C10K and C1000K problems. To recap, C10K refers to the problem of how a single host can handle 10,000 concurrent requests at the same time, and C1000K refers to 1M concurrent requests.
Introduction
The optimization of I/O model is the best way to solve the C10K problem. The epoll which introduced in Liux 2.6 perfectly solves C10K and many high-performance network solutions today are still abased on epoll.
From C10K to C100K, one solution is to increase the physical hardware resources to meet the requirements, but from C100K to C1000K, it is not enough to increase the physical resources. It is necessary to optimize both the application and hardware of the system, from hardware interrupt processing, to the number of file descriptors in the network protocol stack, connection status tracking, cache queues and then to the entire network link of the application’s working model.
One step further, what about C10M? This is not a problem that can be solved by adding hardware resources and tuning kernels and applications. At this time, the lengthy network protocol stack becomes in the kernel becomes the biggest issue.
There are two ways of solving this issue:
- Use the XDP method to process network packets before the kernel protocol stack.
- Use DPDK, skip the network protocol stack directly, and process by polling in user space.
Among the above two methods, DPDK is the the most mainstream high-performance network solution. However, the network card needs to support DPDK.
Of course, in fact, in most scenarios, we don’t need 10 million concurrent requests on a single machine. By adjusting the system architecture and distributing requests to multiple servers for parallel processing, it is a simpler and more scalable solution.
However, in this case, we need to evaluate the network performance of the system in order to examine the processing power of the system and provide benchmark data for capacity planning. So how to evaluate network performance?
Collecting Performance Metrics
Before we can even talk about evaluating network performance, we have to collect the metrics used to measure your system network performance. If your application runs on AWS EC2/ECS/Lambda/EKS, out of box AWS has some basic monitoring metrics in AWS Cloud Watch. If your application is containerized and runs on K8s, you could leverage Grafana and Prometheus to collect metrics (more cloud native). Otherwise, there are third party tools such as Datadog, new relic, etc.
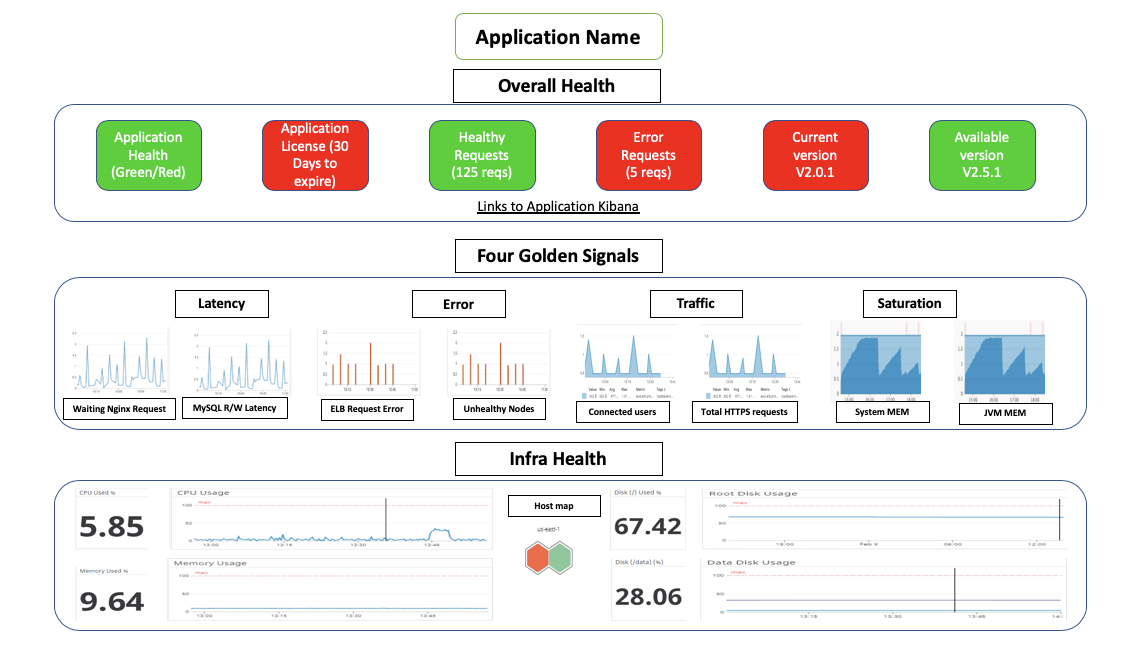
Whatever methods/tools you use, it is crucial to have a metrics collecting mechanism and dashboard to display performance, along with alerting and notification. I attached one sample dashboard that I use for some of my applications below:
Performance Metrics Review
In Linux Network Fundamentals, we once said that bandwidth, throughput, latency, PPS, etc. are the most commonly used network performance indicators. A quick recap of important network metrics:
- bandwidth: The maximum transmission rate of the link in b/s. When you purchase a network card, commonly used bandwidth are 1G, 10G, 100G.
- throughput: Indicates the maximum data transfer rate without packet loss, usually in b/s or B/s. Throughput is limited by bandwidth, and throughput/bandwidth is the utilization rate of the network link.
- delay: The time delay from the time that network request is sent until the remote response is received. It can represent the time required to establish a connection (such as the TCP handshake delay), or the time required for a round trip of a packet (such as RTT).
- PPS: Packet per second, represents the transmission rate in network packets. PPS is usually used to evaluate the forwarding capability of network, and the forwarding based on Linux servers is easily affected by the size of the network packets.
Among the above four indicators, the bandwidth is directly related to the physical NIC configuration. For TCP or Web services, more indicators such as the number of concurrent connections and the number of requests per second (QPS, Query per Second) are used, which can better reflect the performance of the actual application.
Benchmarking
After being familiar with the performance indicators of the network, let’s take a look at how to determine the benchmark values of these indicators through performance testing.
Linux networking is based on the TCP/IP protocol stack, and the behavior of different protocol layers is obviously different. So, before testing, you should figure out which layer of the protocol stack the network performance you want to evaluate belongs to? In other words, which layer of the protocol stack is your application based on?
In general:
- Web based applications based on HTTP/HTTPS obviously belong to the application layer.
- Game servers usually based on TCP or UDP to interact with client. So it is at TCP/UDP layer.
- If your Linux server is used as a soft switch or router, it will be at network layer.
HTTP performance
HTTP is the most commonly used application-layer protocol. For example, commonly used Apache, Nginx and other Web services are based on HTTP.
To test the performance of HTTP, there are also a large number of tools that can be used, such as ab, webbench, etc., which are commonly used HTTP stress testing tools. Among them, ab is the HTTP stress test tool that comes with Apache, which mainly tests the number of requests per second, request delay, throughput, and request delay distribution of HTTP services.
You can install the ab tool by running the following command:
$ yum install -y httpd-tools
Next, on the target machine, use Docker to start an Nginx service, and then use ab to test its performance. First, run the following command on the target machine:
$ docker run -p 80:80 -itd nginx
On another machine, run the ab command to test the performance of Nginx:
# -c means the number of concurrent requests is 1000, -n means the total number of requests is 10000
$ ab -c 1000 -n 10000 http://192.168.0.30/
...
Server Software:        nginx/1.15.8
Server Hostname:        192.168.0.30
Server Port:            80...Requests per second:    1078.54 [#/sec] (mean)
Time per request:       927.183 [ms] (mean)
Time per request:       0.927 [ms] (mean, across all concurrent requests)
Transfer rate:          890.00 [Kbytes/sec] receivedConnection Times (ms)
              min  mean[+/-sd] median   max
Connect:        0   27 152.1      1    1038
Processing:     9  207 843.0     22    9242
Waiting:        8  207 843.0     22    9242
Total:         15  233 857.7     23    9268Percentage of the requests served within a certain time (ms)
  50%     23
  66%     24
  75%     24
  80%     26
  90%    274
  95%   1195
  98%   2335
  99%   4663
 100%   9268 (longest request)
In the request summary section, you can see:
- Requests per second is 1074;
- The delay of each request (Time per request) is divided into two lines. The 927 ms in the first line represents the average delay, including the scheduling time of thread running and the network request response time, while the 0.927 ms in the next line represents the actual request response time;
- Transfer rate means throughput (BPS) of 890 KB/s.
- The connection time summary section shows various times for establishing connections, requests, waiting, and summarization, including minimum, maximum, average, and median processing times.
- The final request delay summary section gives the percentage of requests processed in different time periods, for example, 90% of the requests can be completed within 274ms.
TCP/UDP performance
Both iperf and netperf are the most commonly used network performance testing tools for testing TCP and UDP throughput. They both measure the average throughput over a period of time as the client and server communicate.
We will use iperf as an example. To install:
$ yum install iperf3
Then, start the iperf server on the target machine:
# -s means start the server, -i means reporting interval, -p means listening port
$ iperf3 -s -i 1 -p 10000
Next, run the iperf client on another machine to run the tests:
# -c means to start the client, 192.168.0.30 is the IP of the target server
# -b indicates the target bandwidth (unit is bits/s)
# -t means test time
# -P indicates the number of concurrency, -p indicates the target server listening port
$ iperf3 -c 192.168.0.30 -b 1G -t 15 -P 2 -p 10000
After a while (15 seconds) the test is over, go back to the target server and check the iperf report:
[ ID] Interval           Transfer     Bandwidth
...
[SUM]   0.00-15.04  sec  0.00 Bytes  0.00 bits/sec                  sender
[SUM]   0.00-15.04  sec  1.51 GBytes   860 Mbits/sec                  receiver
The final SUM line is the summary result of the test, including test time, data transfer volume, and bandwidth. According to sending and receiving, this part is divided into two lines of sender and receiver.
From the test results, you can see that the TCP received bandwidth (throughput) of this machine is 860 Mb/s, which is still a bit far from the target’s 1Gb/s.
Forwarding performance
Let’s first look at the network interface layer and the network layer, which are mainly responsible for the encapsulation, addressing, routing, and sending and receiving of network packets.
In this layer, the PPS is the most important performance indicator. To test network layer, we can use “pktgen”. pktgen comes with Linux kernel and supports a wealth of customization options.
Since pktgen runs as kernel thread, you cannot find the command directly. you need to load the pktgen kernel module and then interact with /proc file system. For example:
$ modprobe pktgen
$ ps -ef | grep pktgen | grep -v grep
root     26384     2  0 06:17 ?        00:00:00 [kpktgend_0]
root     26385     2  0 06:17 ?        00:00:00 [kpktgend_1]
$ ls /proc/net/pktgen/
kpktgend_0  kpktgend_1  pgctrl
pktgen starts a kernel thread on each CPU, and can interact with these threads through the file of the same name under /proc/net/pktgen; and pgctrl is mainly used to control the start and stop of this test.
Suppose the network card used by the sending machine is eth0, and the IP address of the target machine is 192.168.0.30 and the MAC address is 11:11:11:11:11:11.
# Define pgset function
function pgset() {
    local result
    echo $1 > $PGDEVresult=`cat $PGDEV | fgrep "Result: OK:"`
    if [ "$result" = "" ]; then
         cat $PGDEV | fgrep Result:
    fi
}# Bind the eth0 network card for thread 0
PGDEV=/proc/net/pktgen/kpktgend_0
pgset "rem_device_all"   # Clear network card binding
pgset "add_device eth0"  # Add eth0 network card# Configure the test options for the eth0 NIC
PGDEV=/proc/net/pktgen/eth0
pgset "count 1000000"    # Total number of packets sent
pgset "delay 5000"       # Send delay between packets (nanoseconds)
pgset "clone_skb 0"      # SKB package copy
pgset "pkt_size 64"      # Network packet size
pgset "dst 192.168.0.30" # destination IP
pgset "dst_mac 11:11:11:11:11:11"  # MAC address# Start test
PGDEV=/proc/net/pktgen/pgctrl
pgset "start"
After a while, the test is complete and the results are available from the /proc filesystem. Through the content in the following code snippet, we can view the test report just now:
$ cat /proc/net/pktgen/eth0
Params: count 1000000  min_pkt_size: 64  max_pkt_size: 64
     frags: 0  delay: 0  clone_skb: 0  ifname: eth0
     flows: 0 flowlen: 0
...
Current:
     pkts-sofar: 1000000  errors: 0
     started: 1534853256071us  stopped: 1534861576098us idle: 70673us
...
Result: OK: 8320027(c8249354+d70673) usec, 1000000 (64byte,0frags)
  120191pps 61Mb/sec (61537792bps) errors: 0
As you can see, the test report is mainly divided into three parts:
- Params in the first part are test options;
- The Current of the second part is the test progress, among which,
pkts-sofarmeans that 1 million packets have been sent, which means that the test has been completed. - The Result includes the time spent in the test, the number of network packets and fragmentation, PPS, throughput, and the number of errors.
From the results above, we found that the PPS was 120,000, the throughput was 61 Mb/s, and no errors occurred.
Conclusion
In this article, we talked about different tools that you can use to evaluate network performance.
Performance evaluation is the premise of optimizing network performance. Only when you find network performance bottlenecks, network performance optimization is required. According to the principle of the TCP/IP protocol stack, the performance focus of different protocol layers is not exactly the same, which corresponds to different performance testing methods.
Because the low-level protocol is the basis of the high-level protocol. Therefore, in general, we need to test the performance of each protocol layer from top to bottom, and then according to the results of the performance test, combined with the principle of the Linux network protocol stack, to find the root cause of the performance bottleneck, and then optimize the network performance.