Is it just new beginning?
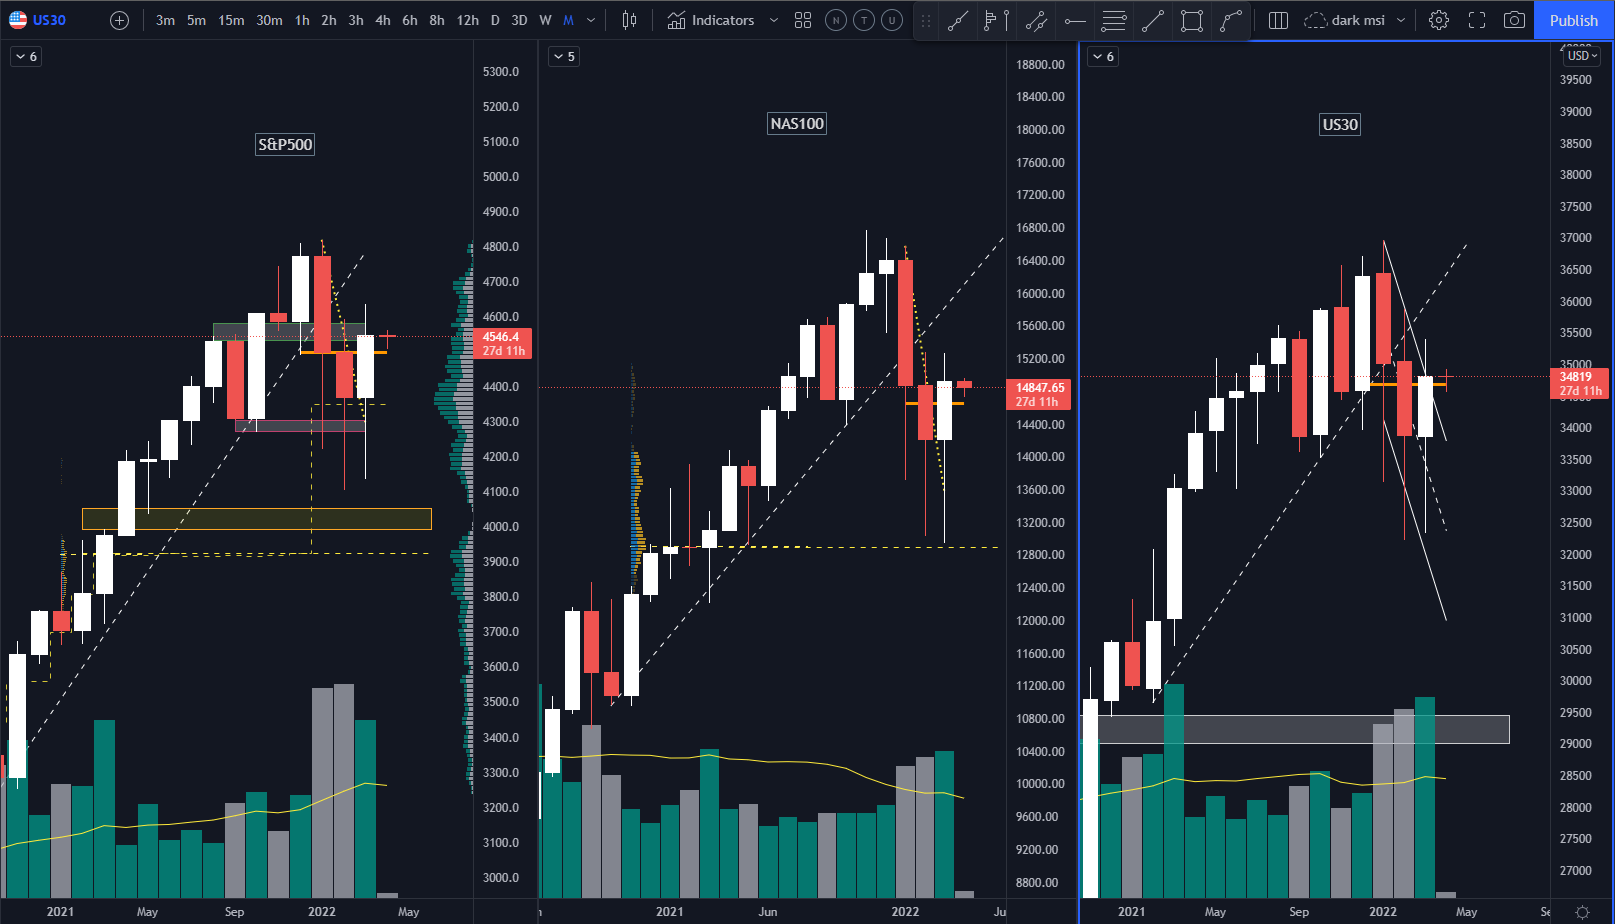
them8Monthly closed pretty well for markets. S&P500, NAS100 andUS30 looking good and seemed made it's correction and ready to blast till new ATH, despite the fact that the market is overheated.
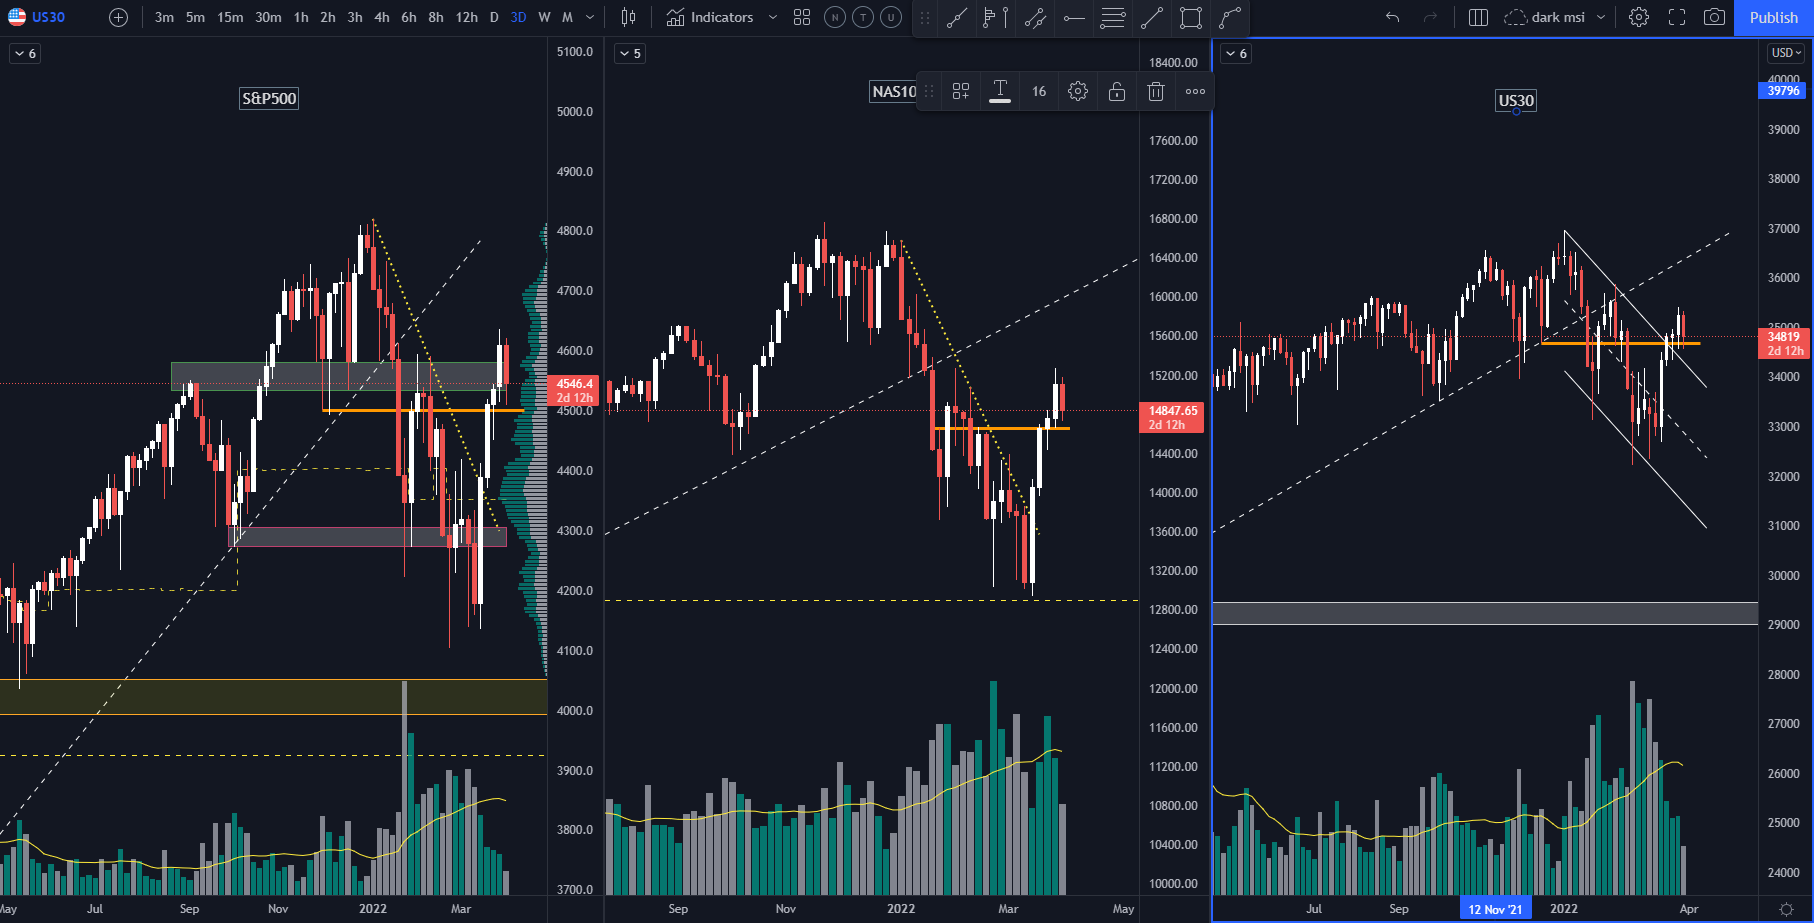
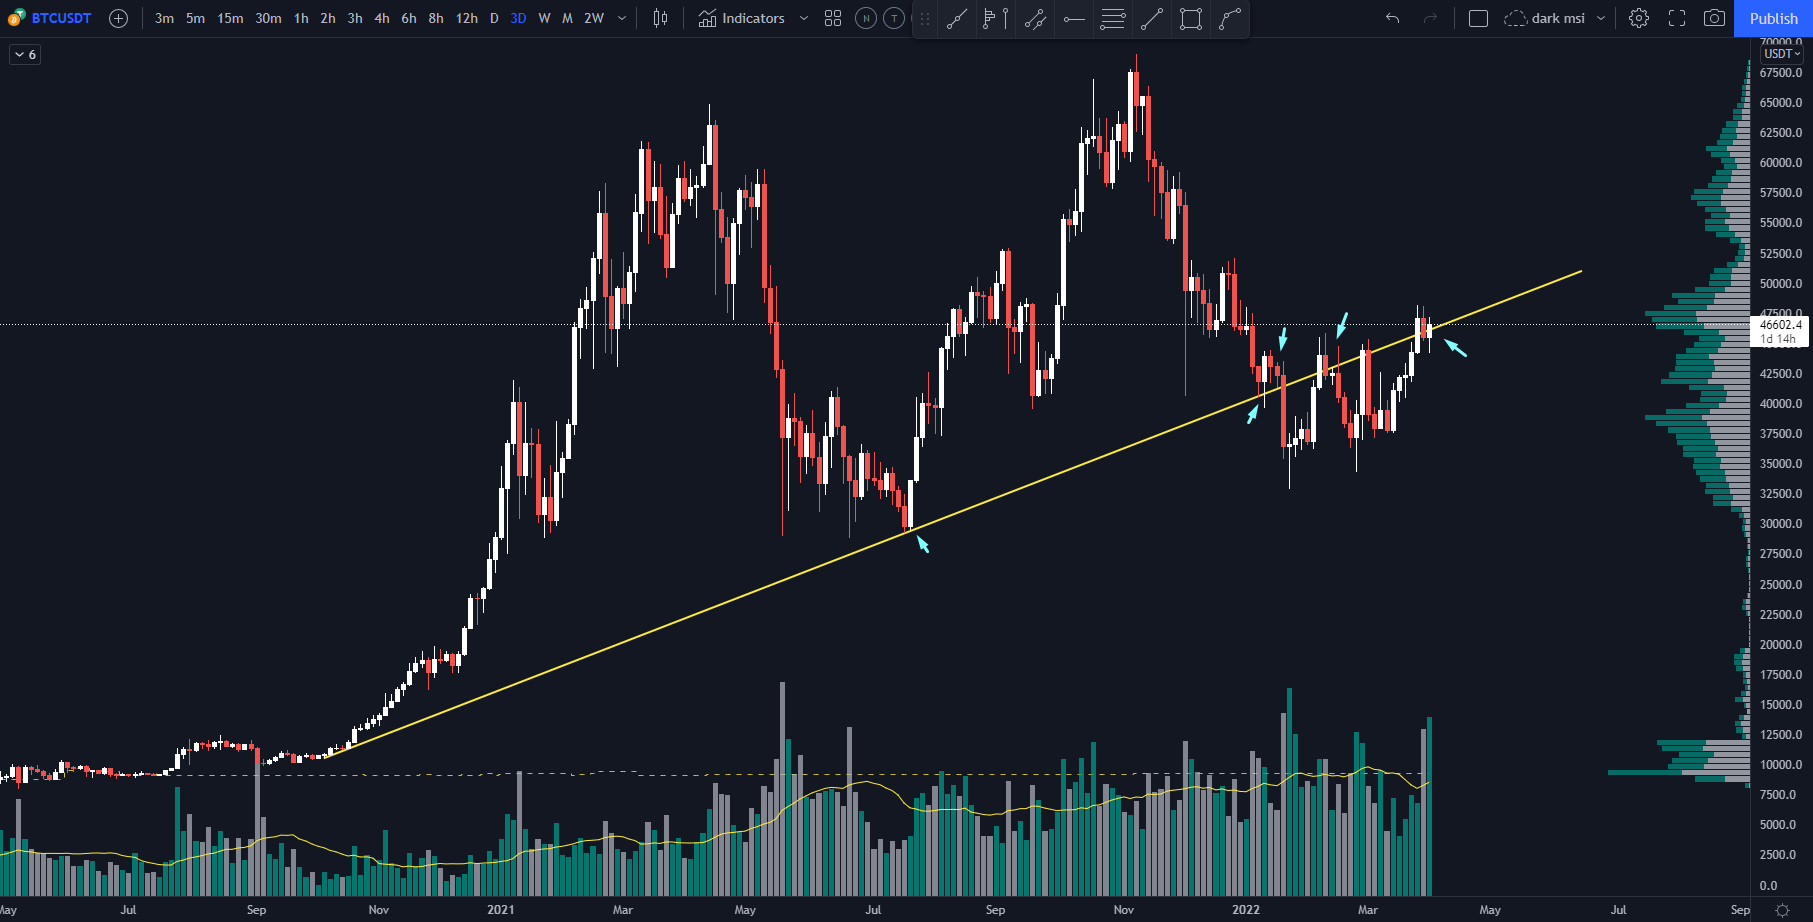
3 days charts are looking pretty optimistic too. Can see some support area - orange line.
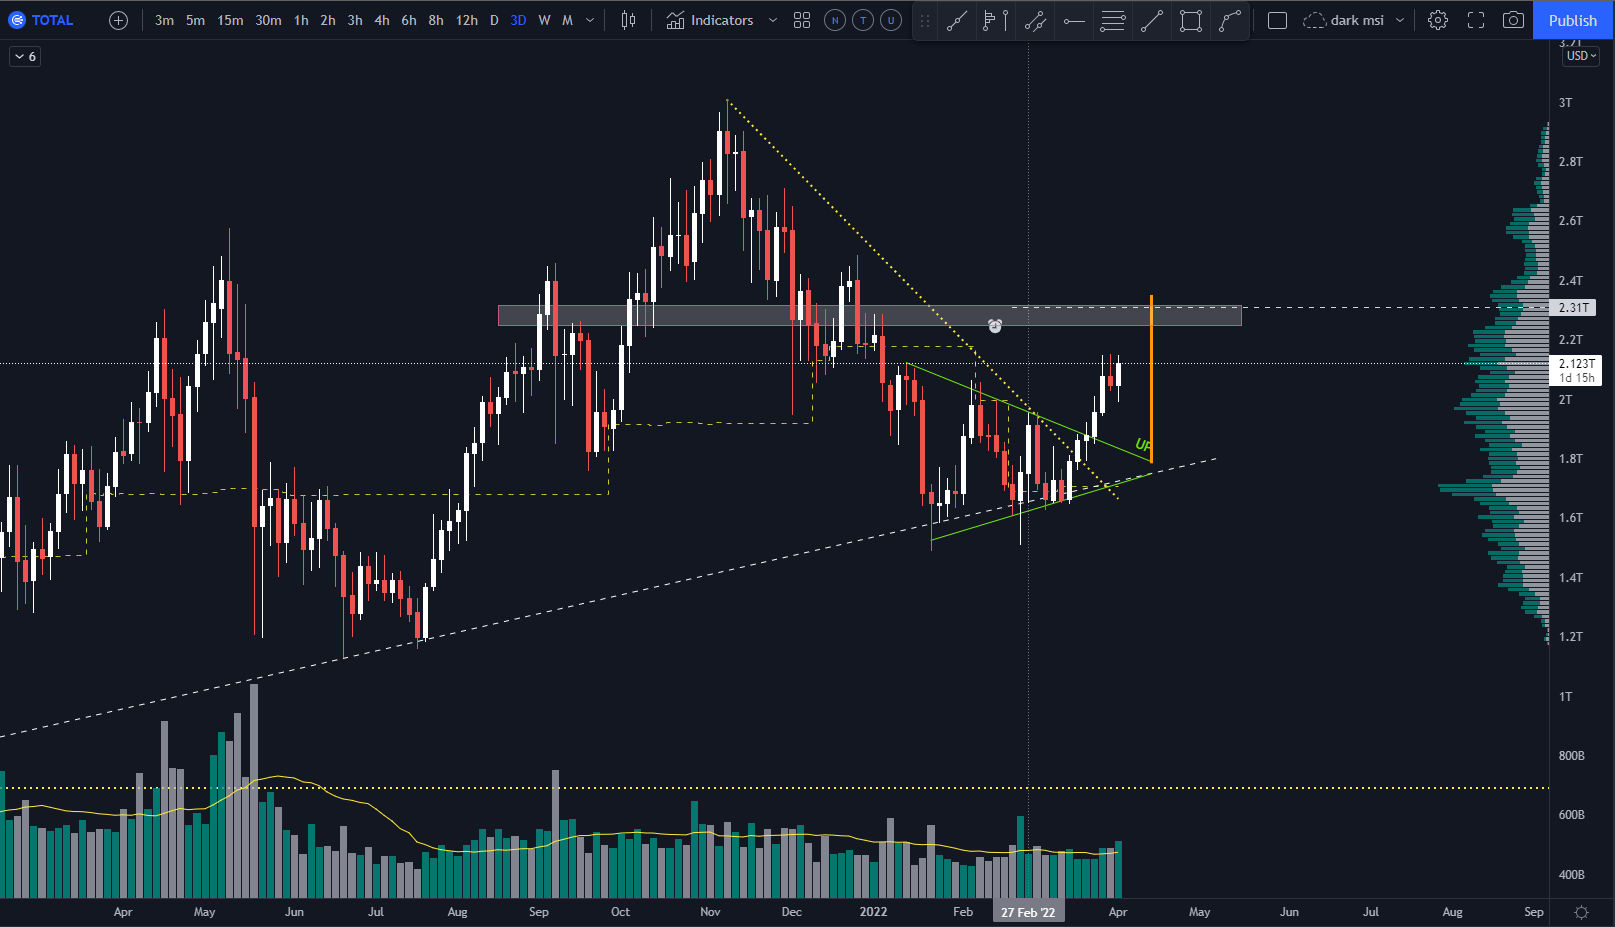
Total market cap on its way up after broke triangle figure, the potential of movement is up to 2.3T usd. It's above 2T now for 5 days.
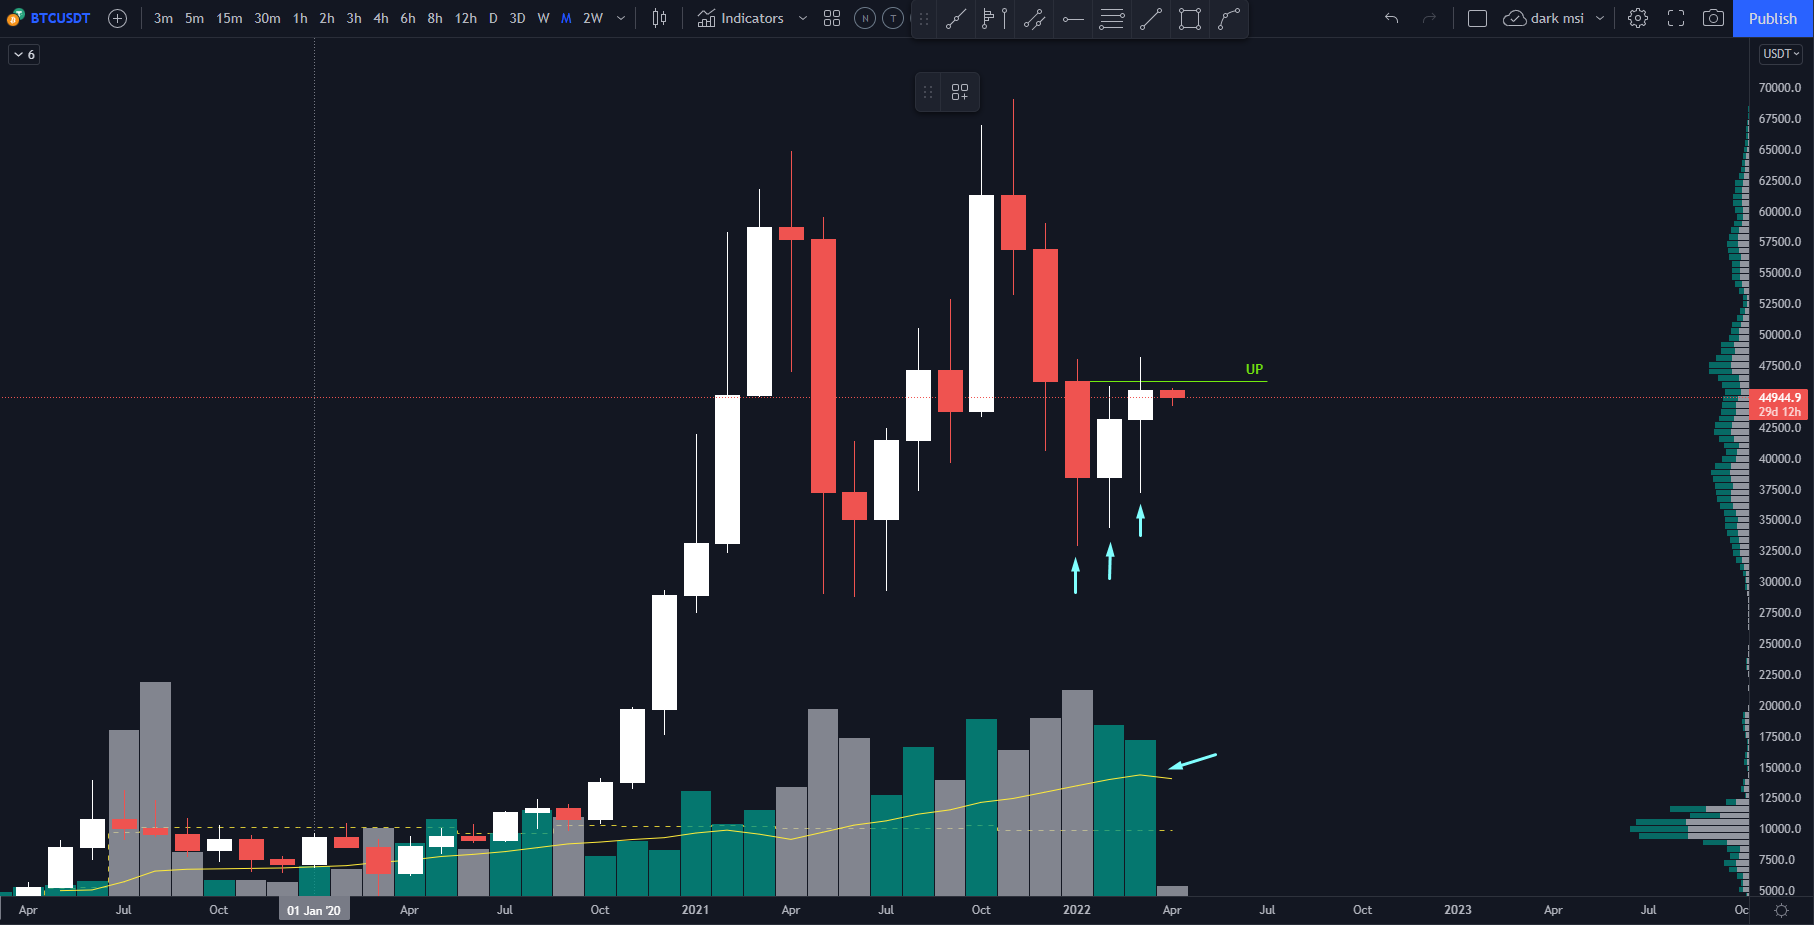
BTCUSDT chart, 1 month time frame, has shown us that buyers is right there and as you see by vertical volume(higher then average) area around 35k usd is protected for now.
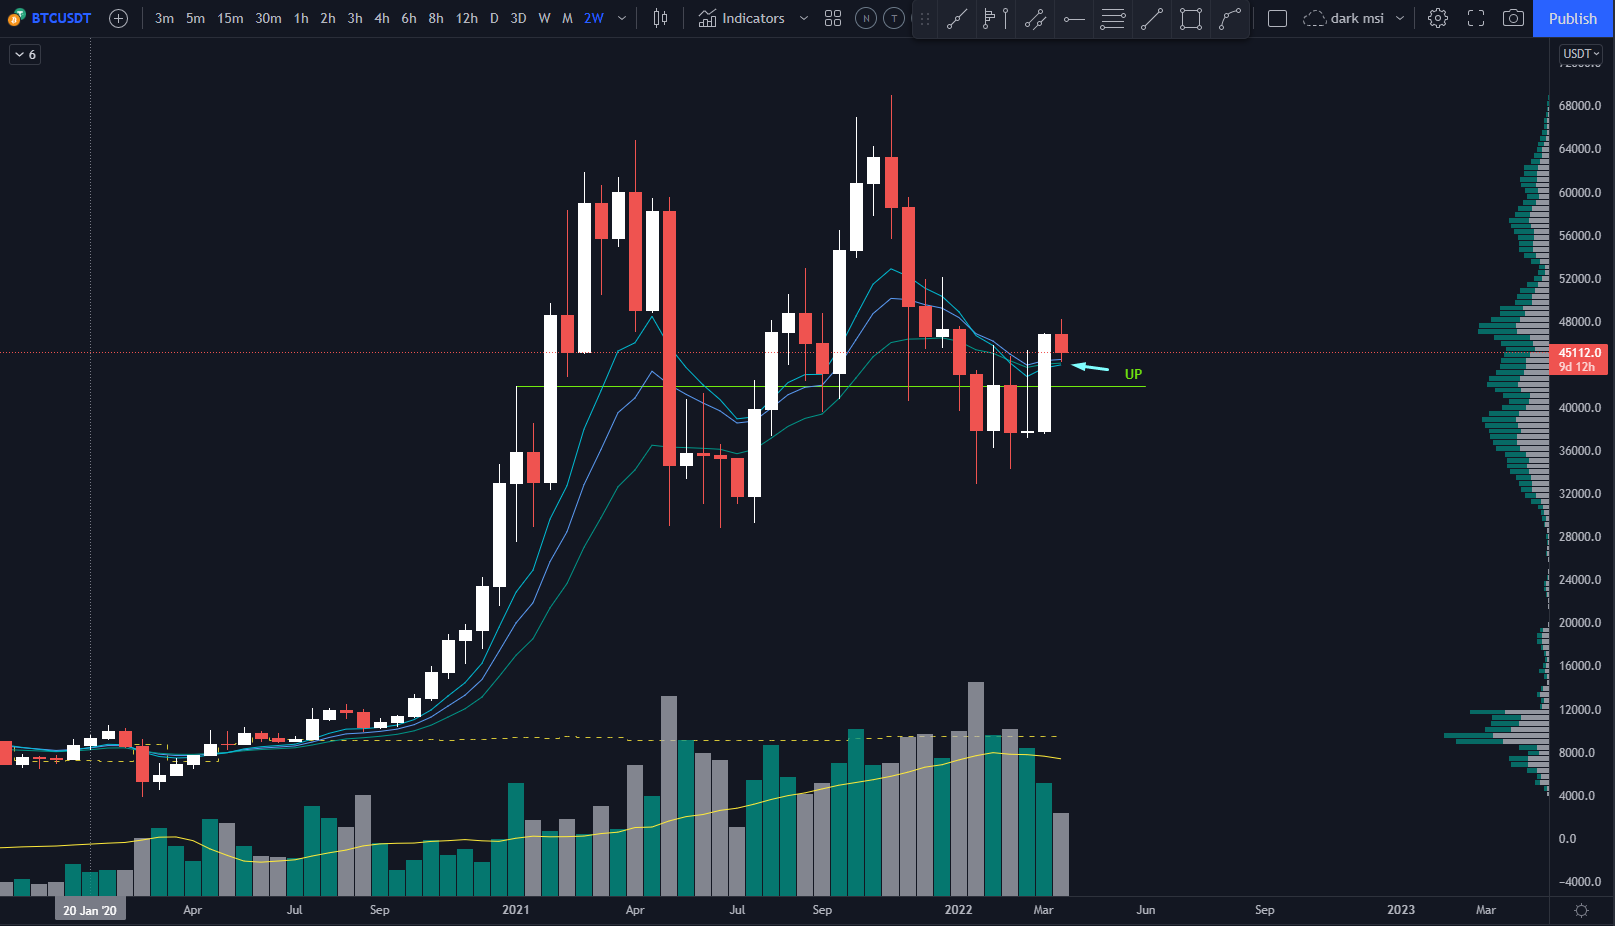
BTCUSDT 2 weeks chart - the price is above 9/13/20 EMAs and above the support line (green~ 42.100 usd)
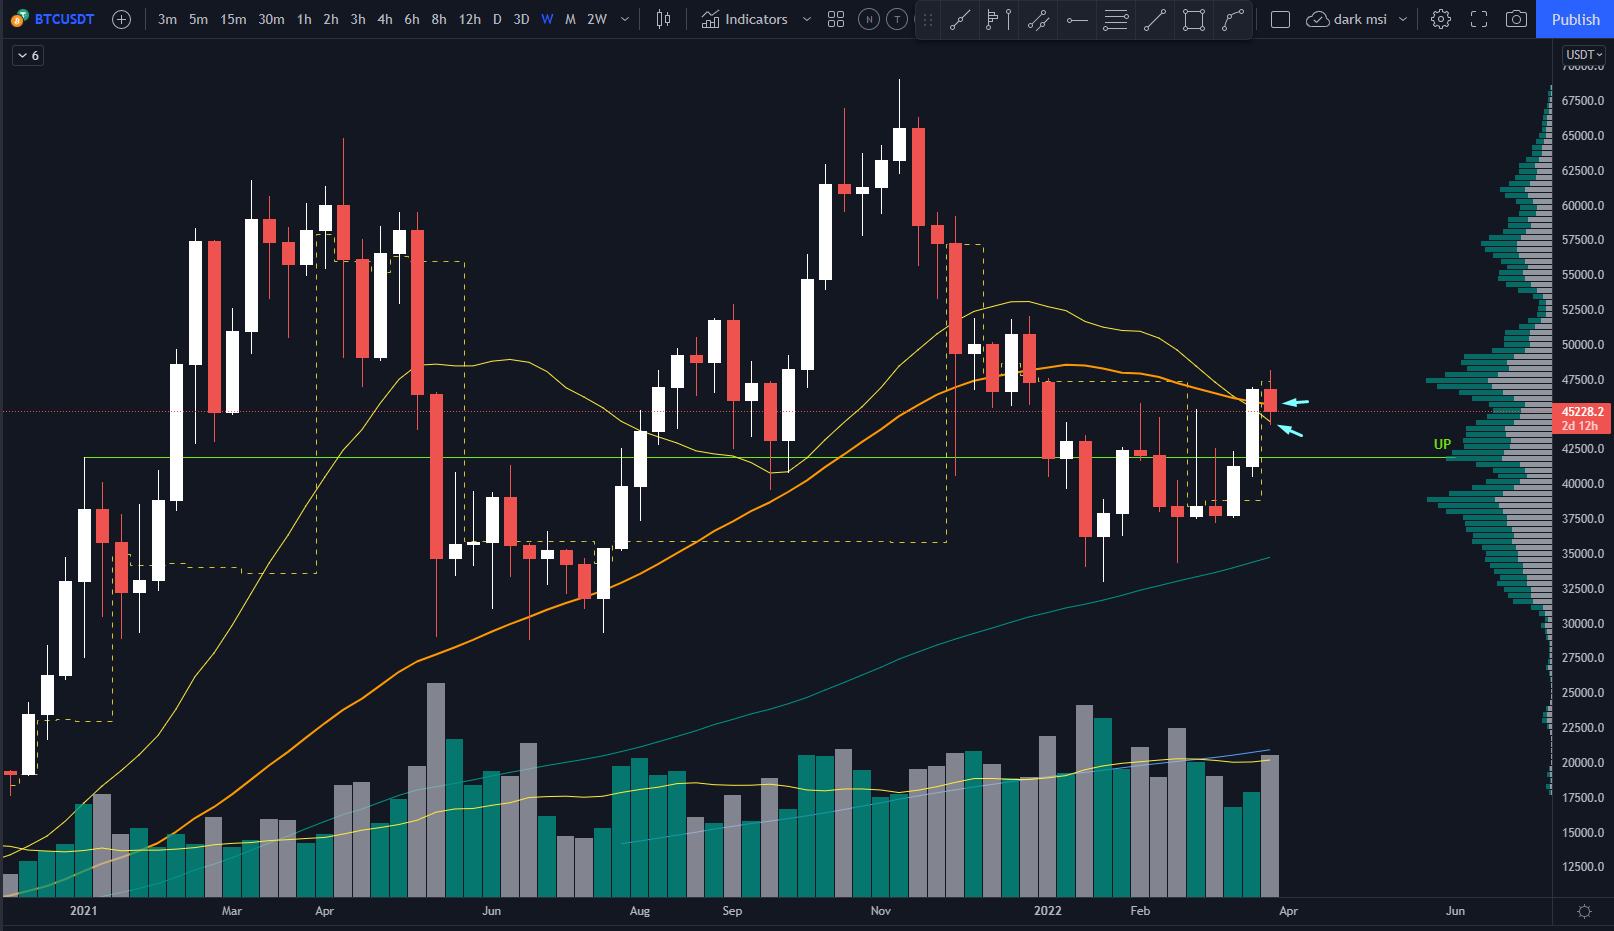
BTCUSDT 1 week chart hasa support of 20MA and 50MA, in order to continue ascending movement price needs to be above them(~44.500usd).
3 days chart of BTCUSDT shows big volatility when the price is around trend line.
At the same time 1 day chart shows flag pattern. Its a bearish flag with potencial of movement down till around 30.000 usd.
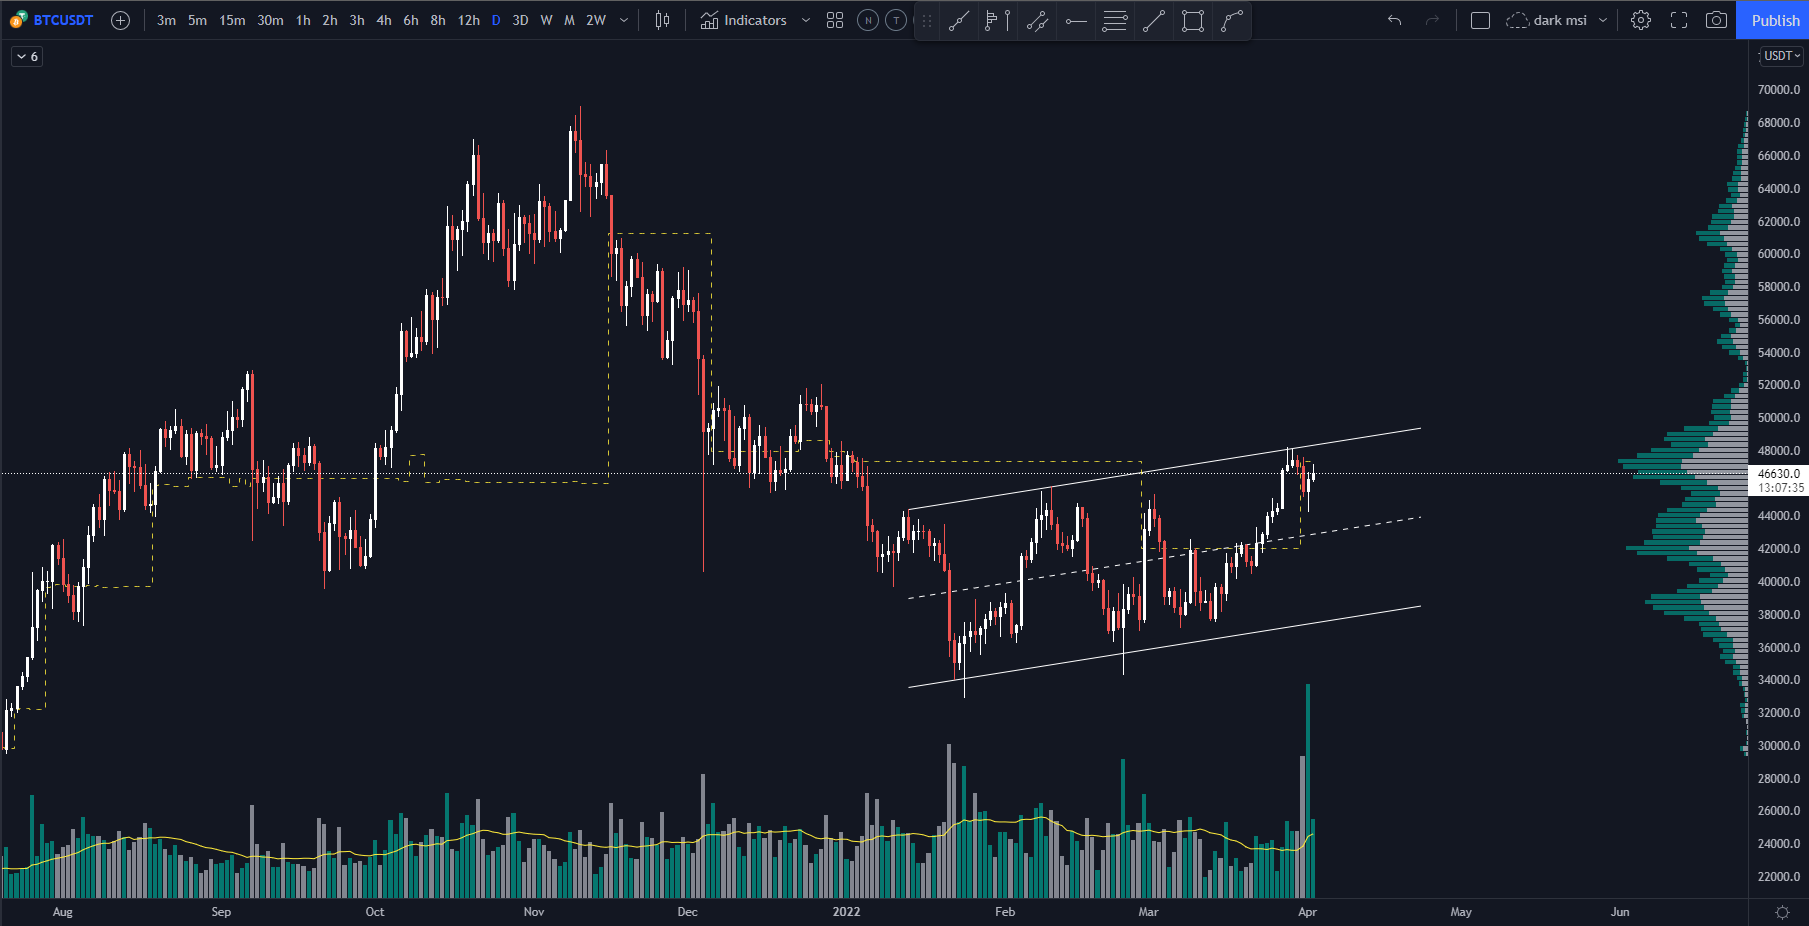
Now the price needed to break through upper line of parallel channel and consolidate there, for the continuation of local ascending movement.
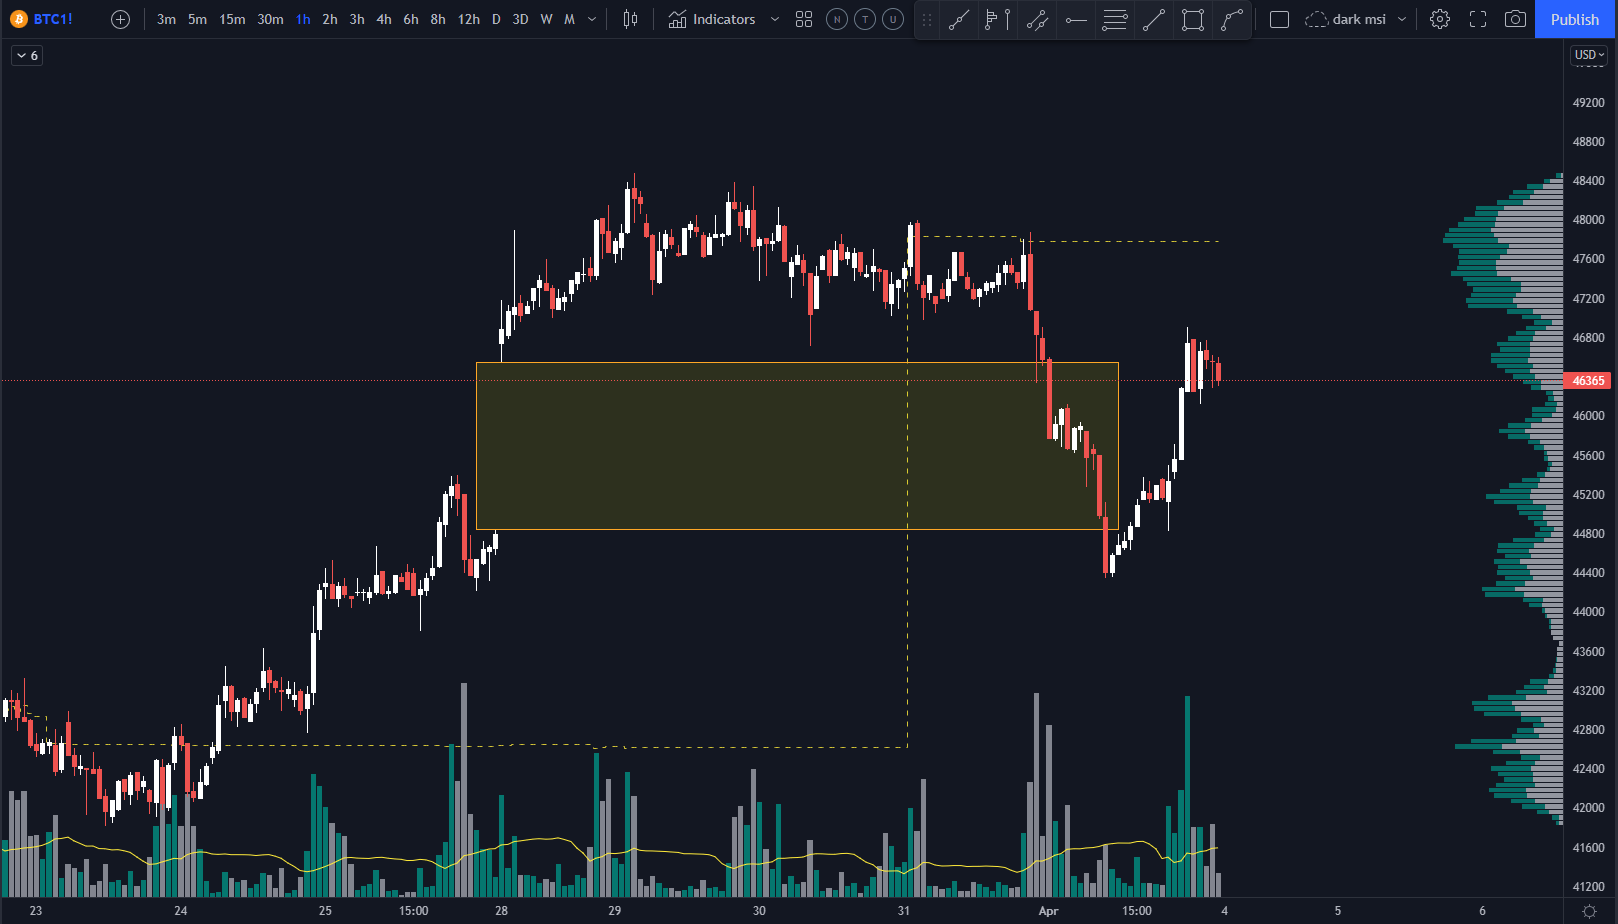
Gap, which normally happens at CME exchange already closed. It's 1 hour chart of BTC1!.
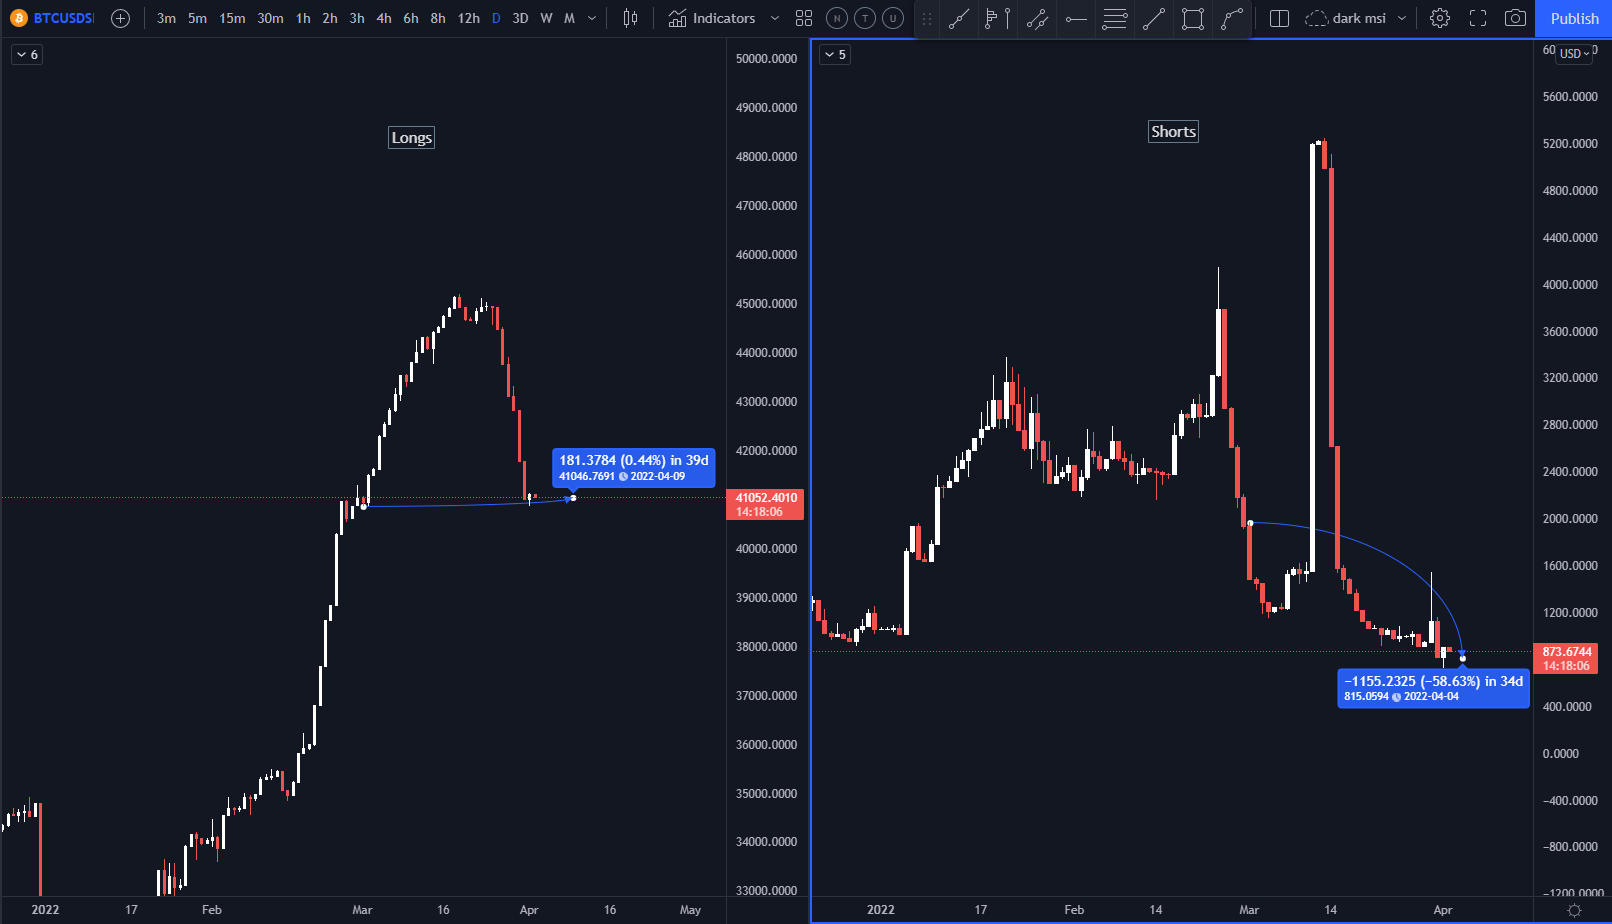
At the same time during march 50% of Shorts were closed, Longs kept on the same level.
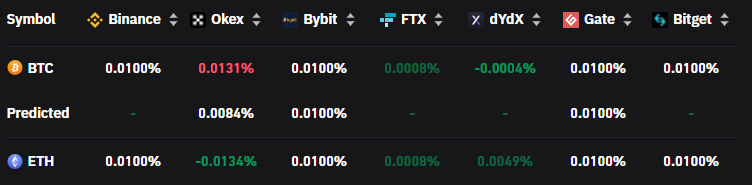
Funding rates are positive now, which can lead to a small fluctuations of the price during the weekend.
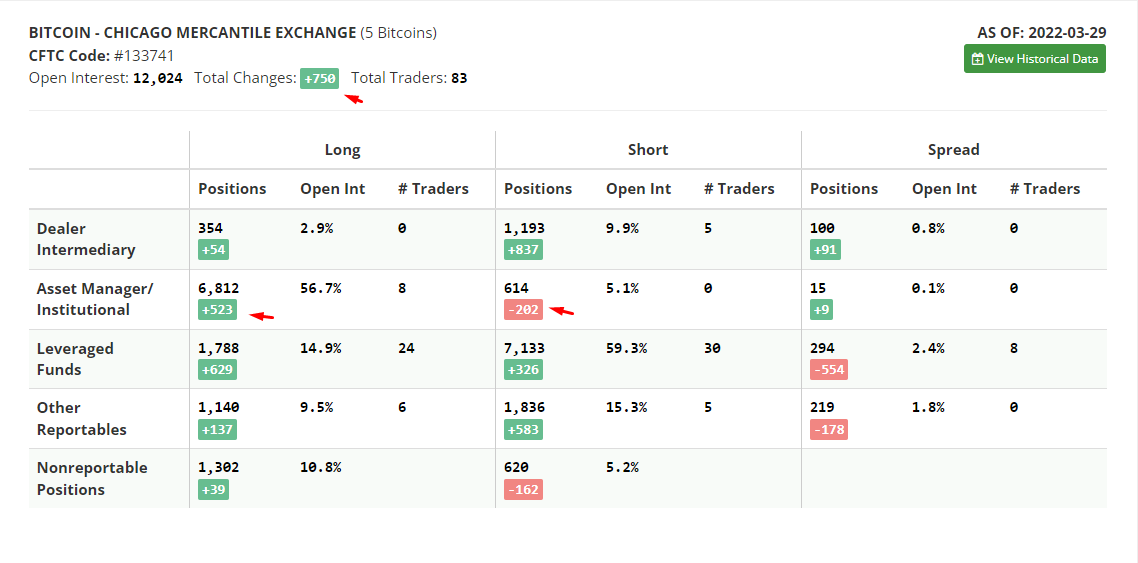
COT report shows that open interest was increased and Institutionals were added Long positions and decreased Shorts.
Summary: Overall situation looks good, some small corrections of a price can be happen. Locally the price did retest 45k area and now it became Support.