Is Natural Gas drop over?
TS Forecasts. Sergey IvanovThis instrument considerably dropped this week. What trading opportunities it discovers are considered by this article.
Looking at NG price chart you might see that it is detrended itself. For these kinds of charts the best projection lines might be calculated by Timing Solution Spectrum and Q-Spectrum modules with Volatility as indicator.
So, price has reached the 1st bullish turning point while the 2nd one is dated to the end of July in a month.
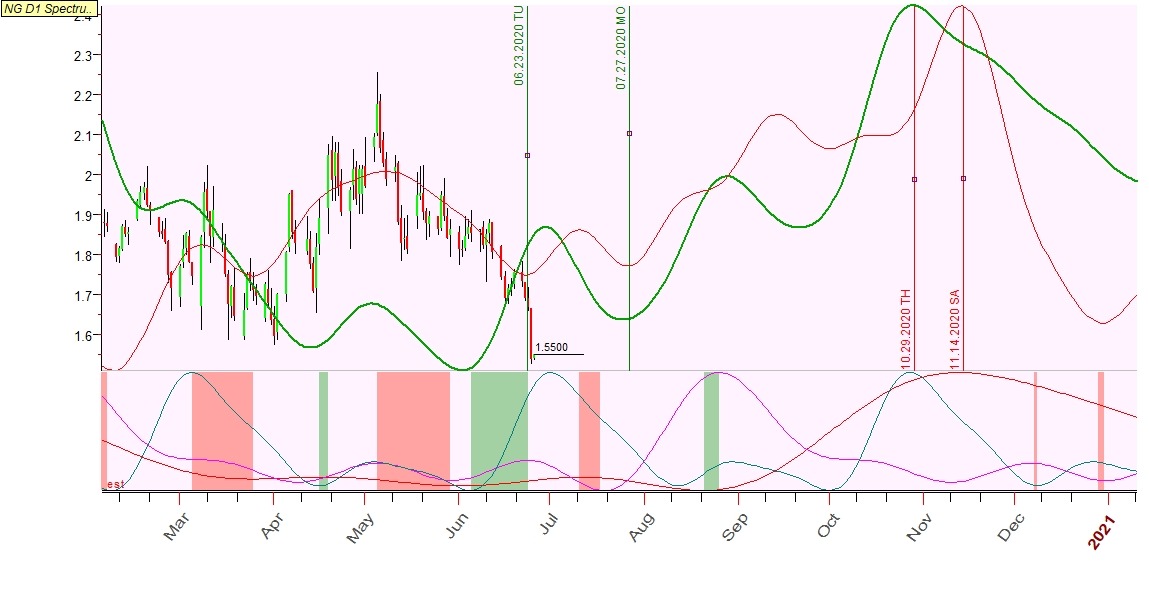
From daily time frame we may expect that the further increase will continue till Dec 2020, but don't see if current days' low is the actual minimum or we'll have another one in the second half of July.
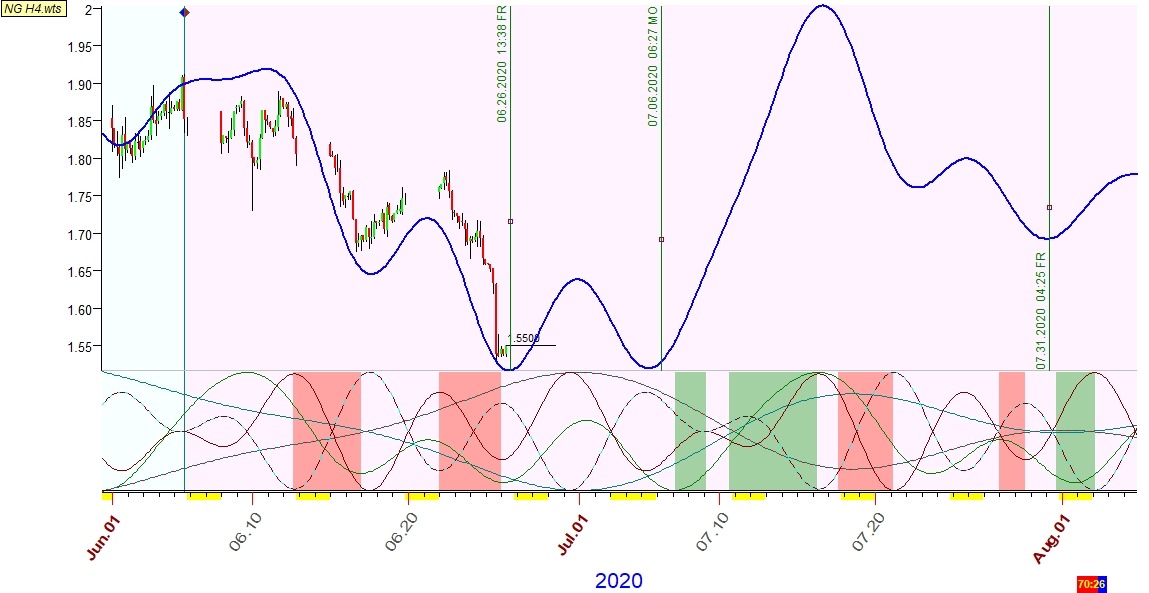
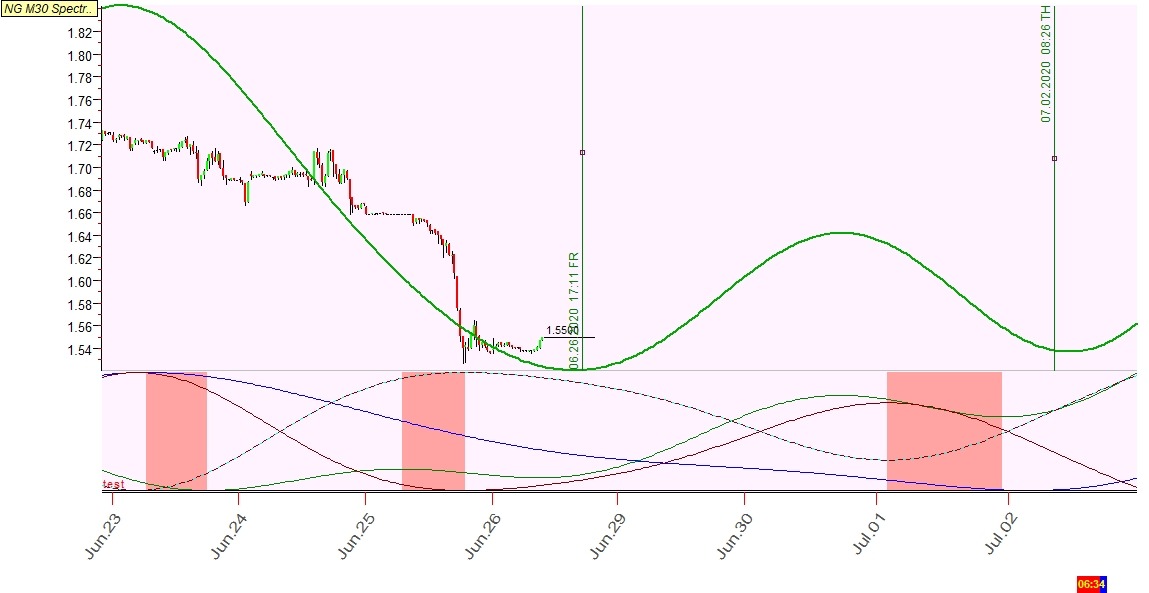
As you can see from H4 time frame projection line supports the idea of nowadays reversal to increase. The same view comes from intraday forecasts at M30 time frame.
Moreover, expected NG growth goes in line with forecast of Gazprom (Russian stock market blue chip, NG exporter).

So, keep an eye on these instruments to catch a middle-run trend.