Instructions for indicators
Pifagor_admin
Introduction
Indicators in open access - you can add them using the link.
Indicators with limited access - access is only available through the bot.
All these indicators are a lot of work. They are free for you. We don't have donations, but if you want to thank us, you can sign up for our affiliate link on the Bybit exchange and get a bonus up to $30,000
Indicators in open access
Follow the links and add the indicators you need to your Favorite indicator list on TradingView.
Instructions on how to add an indicator using a link
Some of the indicators in this set exist only in the form of online charts, which you can view by clicking on the link.
1. Dno po ATR

2. Trap Line

This is the average purchase price of small players. It typically represents significant resistance in a bear market and support in a bull market.
3. MFI Pifagor

The indicator incorporates the concept of money flows, but with many of our own observations and additions. It can be used on any asset and timeframe.
4. Opportunity

For any investor, the most important thing is to buy when the price of an asset is below its value, and when the market is experiencing extreme fear.
This indicator, using a formula we created, shows where the current value of an asset is (the green line).
The green background marks areas where large players are buying, and small speculators are panic-selling.
The red background, on the other hand, marks areas where large players are selling, and small speculators and the crowd are greedily buying.
5. Radar (4h)

This indicator is suitable for all beginners for safe, leverage-free trading if you don't yet have a trading strategy and are simply trading at random.
It works with any altcoin on any timeframe, including 12-hour and daily. It works well with Altcoins, Big Guy, and MFI. It tends to perform better/worse on different pairs (see historical data). Spot trading has been tested on BTC/USD 4h and ETH/USD 4h, with a 60% win rate.
6. Seven Days

The indicator is designed for trading the BTCUSD pair on a 1-week timeframe.
7. Risk Metrics (Benjamin Cowen)

8. BTC MOOD

This indicator displays crowd sentiment in BTC and displays it as a specific color on the chart. Apply only to BLX for 1 day!
9. Profit/Loss (sopr)

The indicator shows, based on blockchain data (untspent UTXO inputs), when people are selling at a loss and when they are selling at a profit. Selling at a loss indicates capitulation, which means potential good entry points.
10. Logarithms of transaction costs

An indicator that helps you sell or buy back BTC based on the risk metric. Touching the lower trend line indicates a buy, while touching the upper one indicates a sell.
11. Technical version of the realized price (Thermocap)

The indicator shows a good price for long-term BTC purchases. Realized price is an indicator calculated based on realized market capitalization. Realized market capitalization differs from market capitalization in that it is calculated as the sum of the values of each coin at the time of its last transfer from one crypto wallet to another. This indicator allows you to estimate the value of coins in circulation, excluding coins in inactive wallets.
12. Pi Cycle for BTC (modified)

The indicator has accurately pinpointed market tops for BTC several times. Originally developed by Philip Swift, it was refined by our team: buy zones were added, and sell zones were updated for XRP.
BTC: Add
XRP: Add
13. Forever Cap by Willy Woo

The indicator was developed by Willy Woo. It displays the market capitalization over its entire history (multiplied by 35), which previously served as the market peak. It also provides bottom and midpoint values.
14. Global RSI + Global Fibonacci


The global RSI shows where large amounts of money are buying.
Global Fibonacci levels show BTC's cycle targets.
15. BTC levels chart in grams of gold

Measures BTC relative to gold. Sometimes it works with surgical precision.
16. Negative funding and price reaction

This isn't our indicator, but it's a very useful one. Funding reflects the crowd's "money" sentiment and the predominance of one group or another (longs/shorts). When funding is positive, people are long; when it's negative, they are short. Observations suggest that high funding leads to price movement in the opposite direction.
17. NVS

This is a modified NVT indicator = market capitalization/network activity (number of transactions). We've refined the formula to take other parameters into account. Divergences indicate that small players are highly confident in growth, while large players are presumably selling their holdings to them.
Line color = overheating.
Black = a point where the number of new network participants is extremely low, indicating a good time to enter the market.
(This is still a theory; the indicator hasn't been fully tested.)
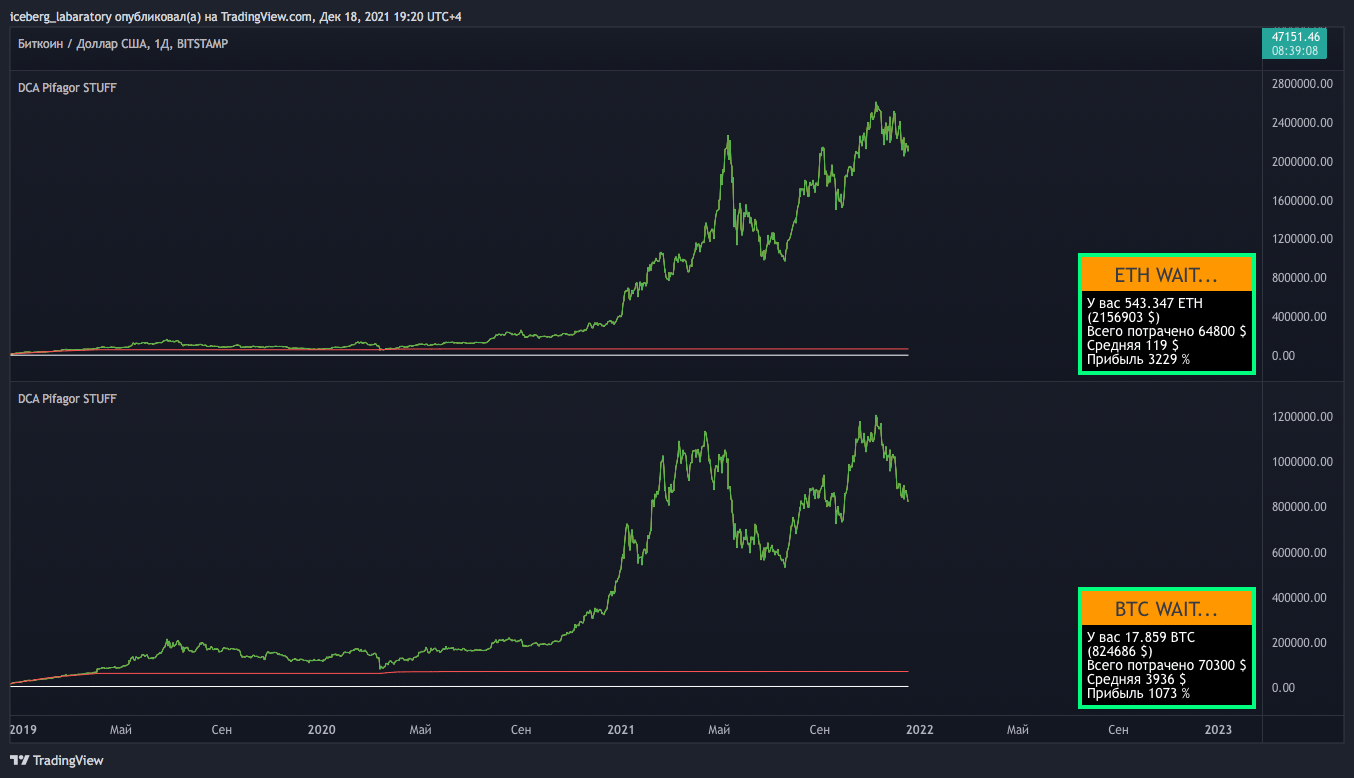
18. DCA Pifagor 3.1

Based on 15 of the most powerful on-chain glassnode indicators.
Allows you to average in on the closest possible price bottom. Bitcoin, Ethereum, and alts.
For example, when you enter the market with a single investment, you risk buying at the highs only to see the price fall and ultimately end up with a losing position.
However, if you split your single investment into smaller increments, you can buy the asset at different points in time at different prices, thereby achieving a better average price for your position, significantly reducing the risk of local price movements.
19. Money waterfall

An on-chain indicator showing buying and selling activity by major players. It reflects buying and selling climaxes, often marking peaks and bottoms.
20. BIG GUY


This indicator shows whether a major player is buying up an asset. It can be used on any coin. It has many add-ons. It's suitable for both positional and scalping trading.
Example of medium-term trading
How to scalp with this indicator
Finding an exit point with a "big guy"
Indicators with limited access
Access to these indicators is only possible with the author's permission.
We provide access to referrals free of charge.
Use the bot and get access for 1 year. (We will give a new one after the deadline.)
1. Global BTC 1/3D Bitstamp
2. Forever sma

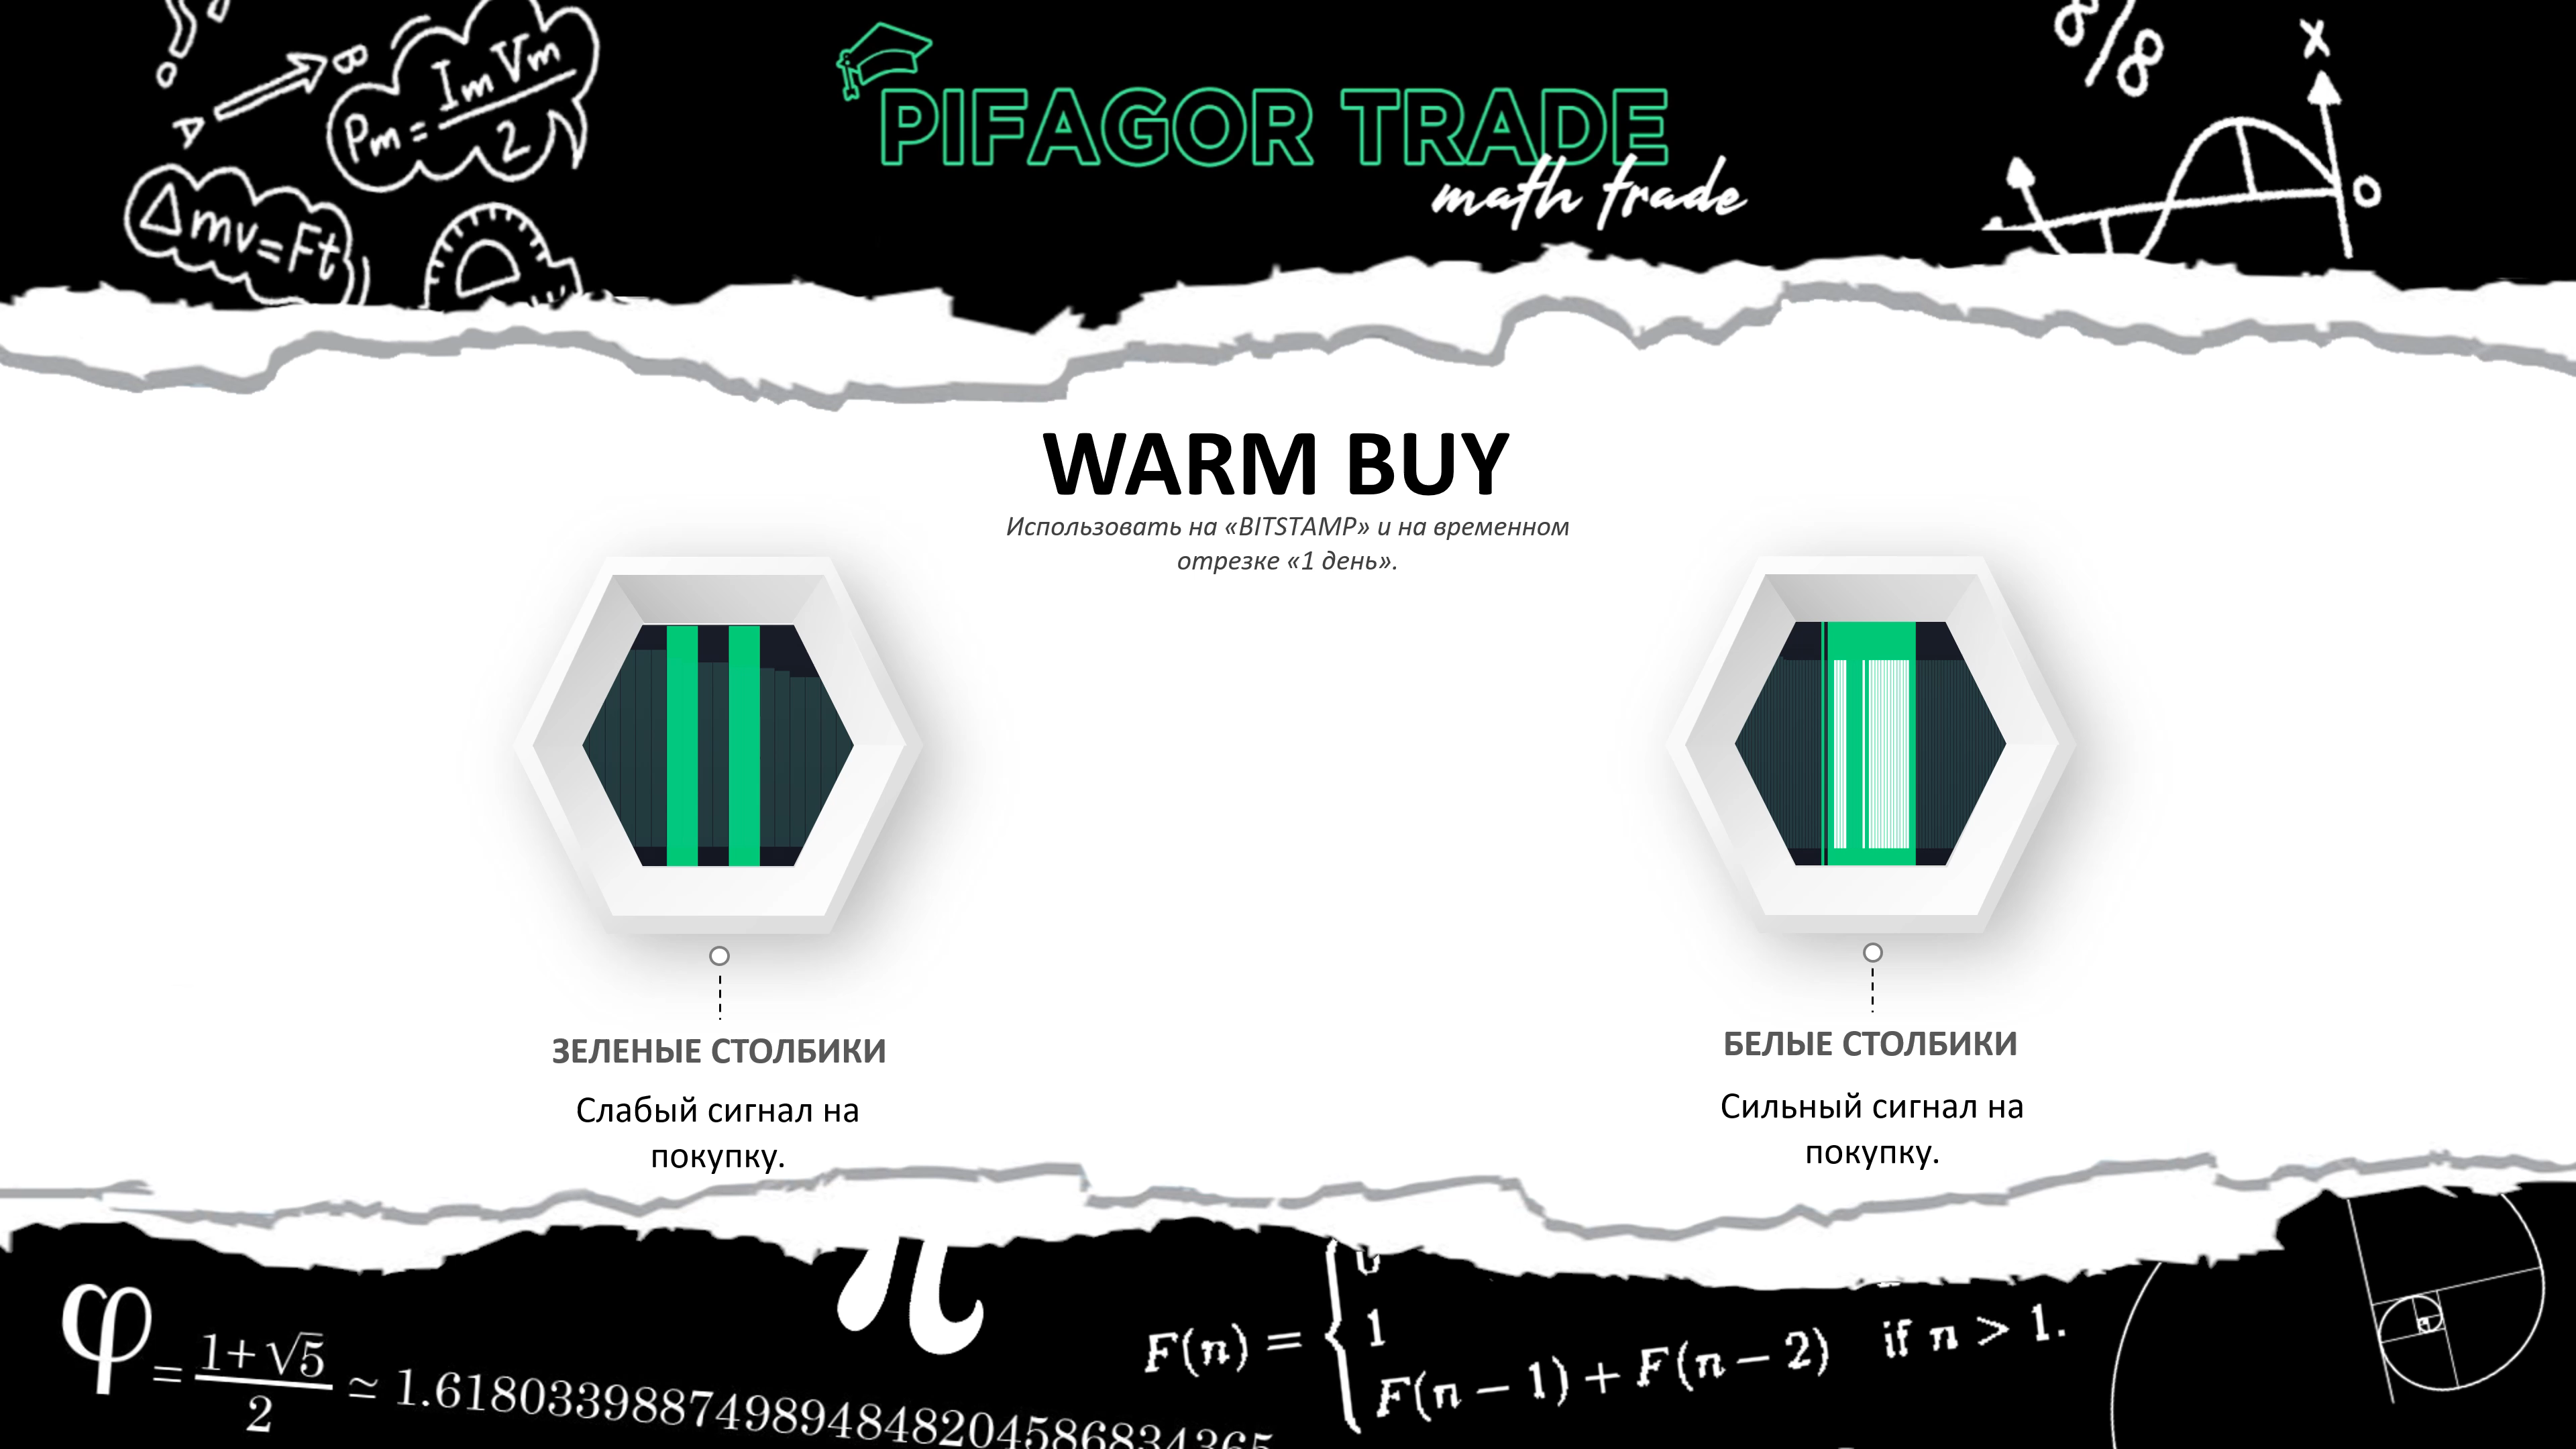
3. Warm buy
4. Div btc/usdt 4h, 12h, 1d
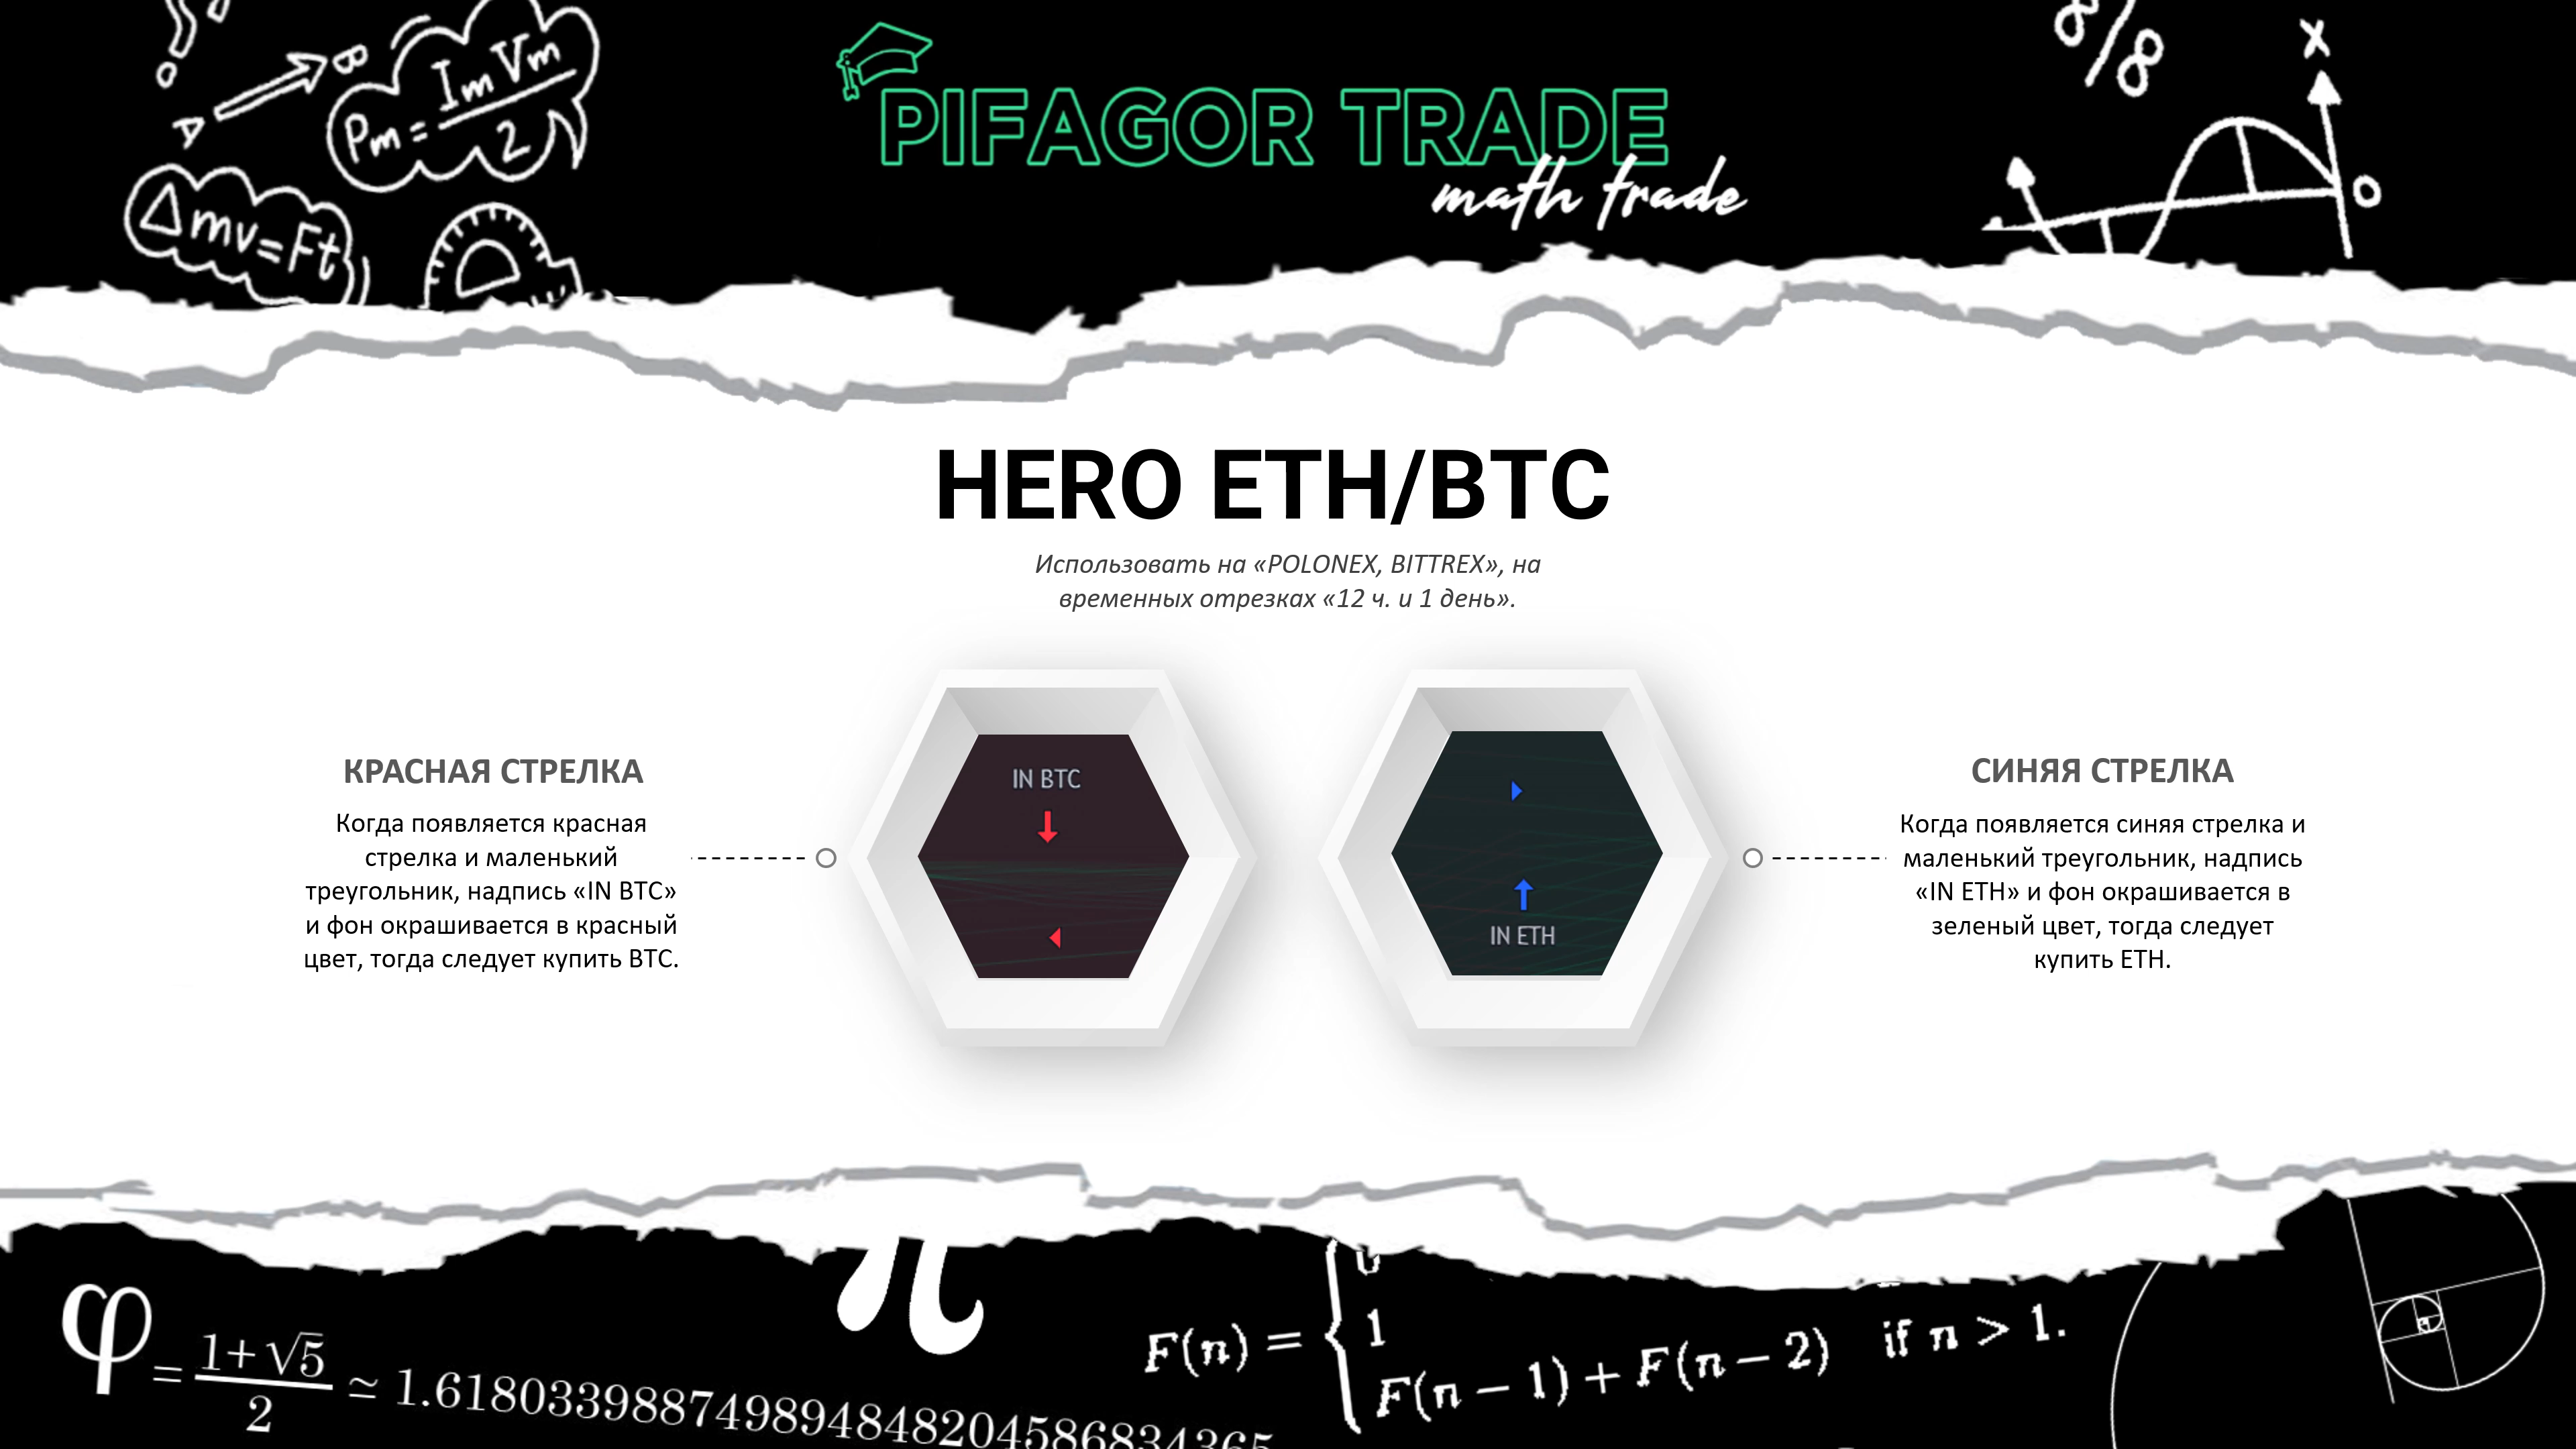
5. Hero eth/btc 12h, 1d
6. Best eth/btc 12h, 4h

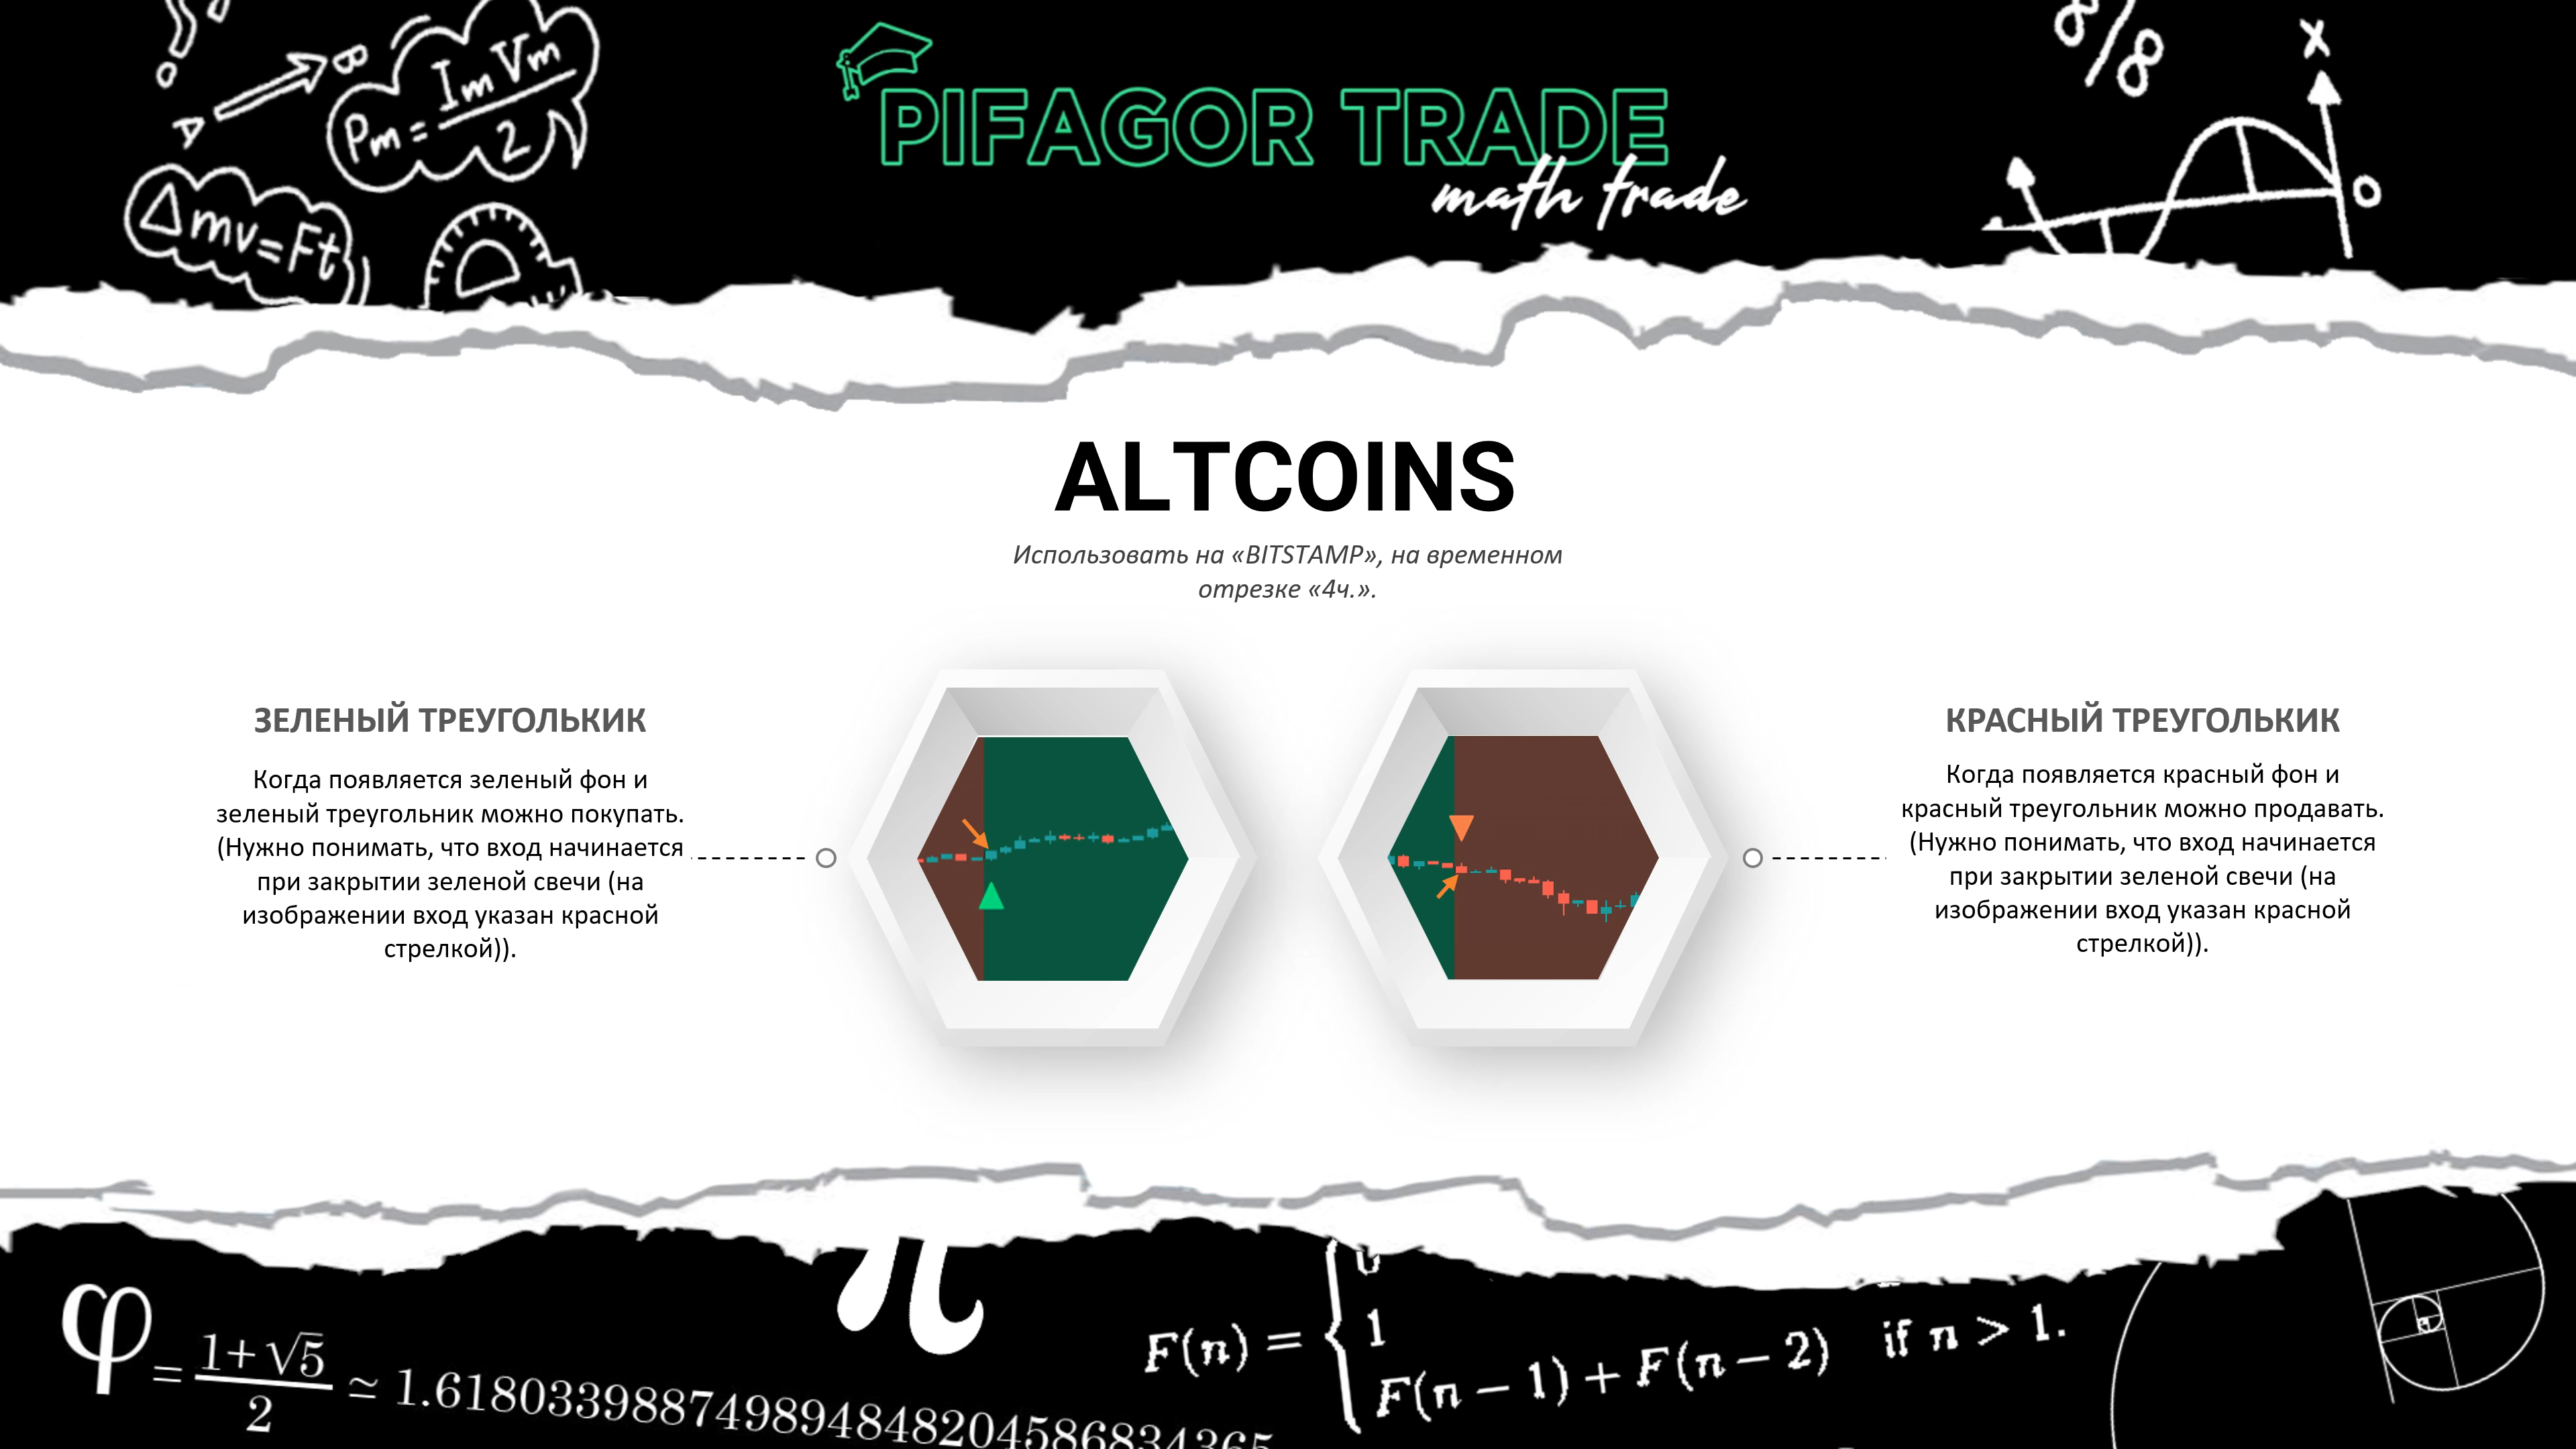
7. Altcoins (любые пары, таймфрейм)
8. Alts strategy (Alts 3.6)
To see the asset's sell price, set the indicator settings to 100% sufficient.
For risk management, there's an over/under option in the settings.

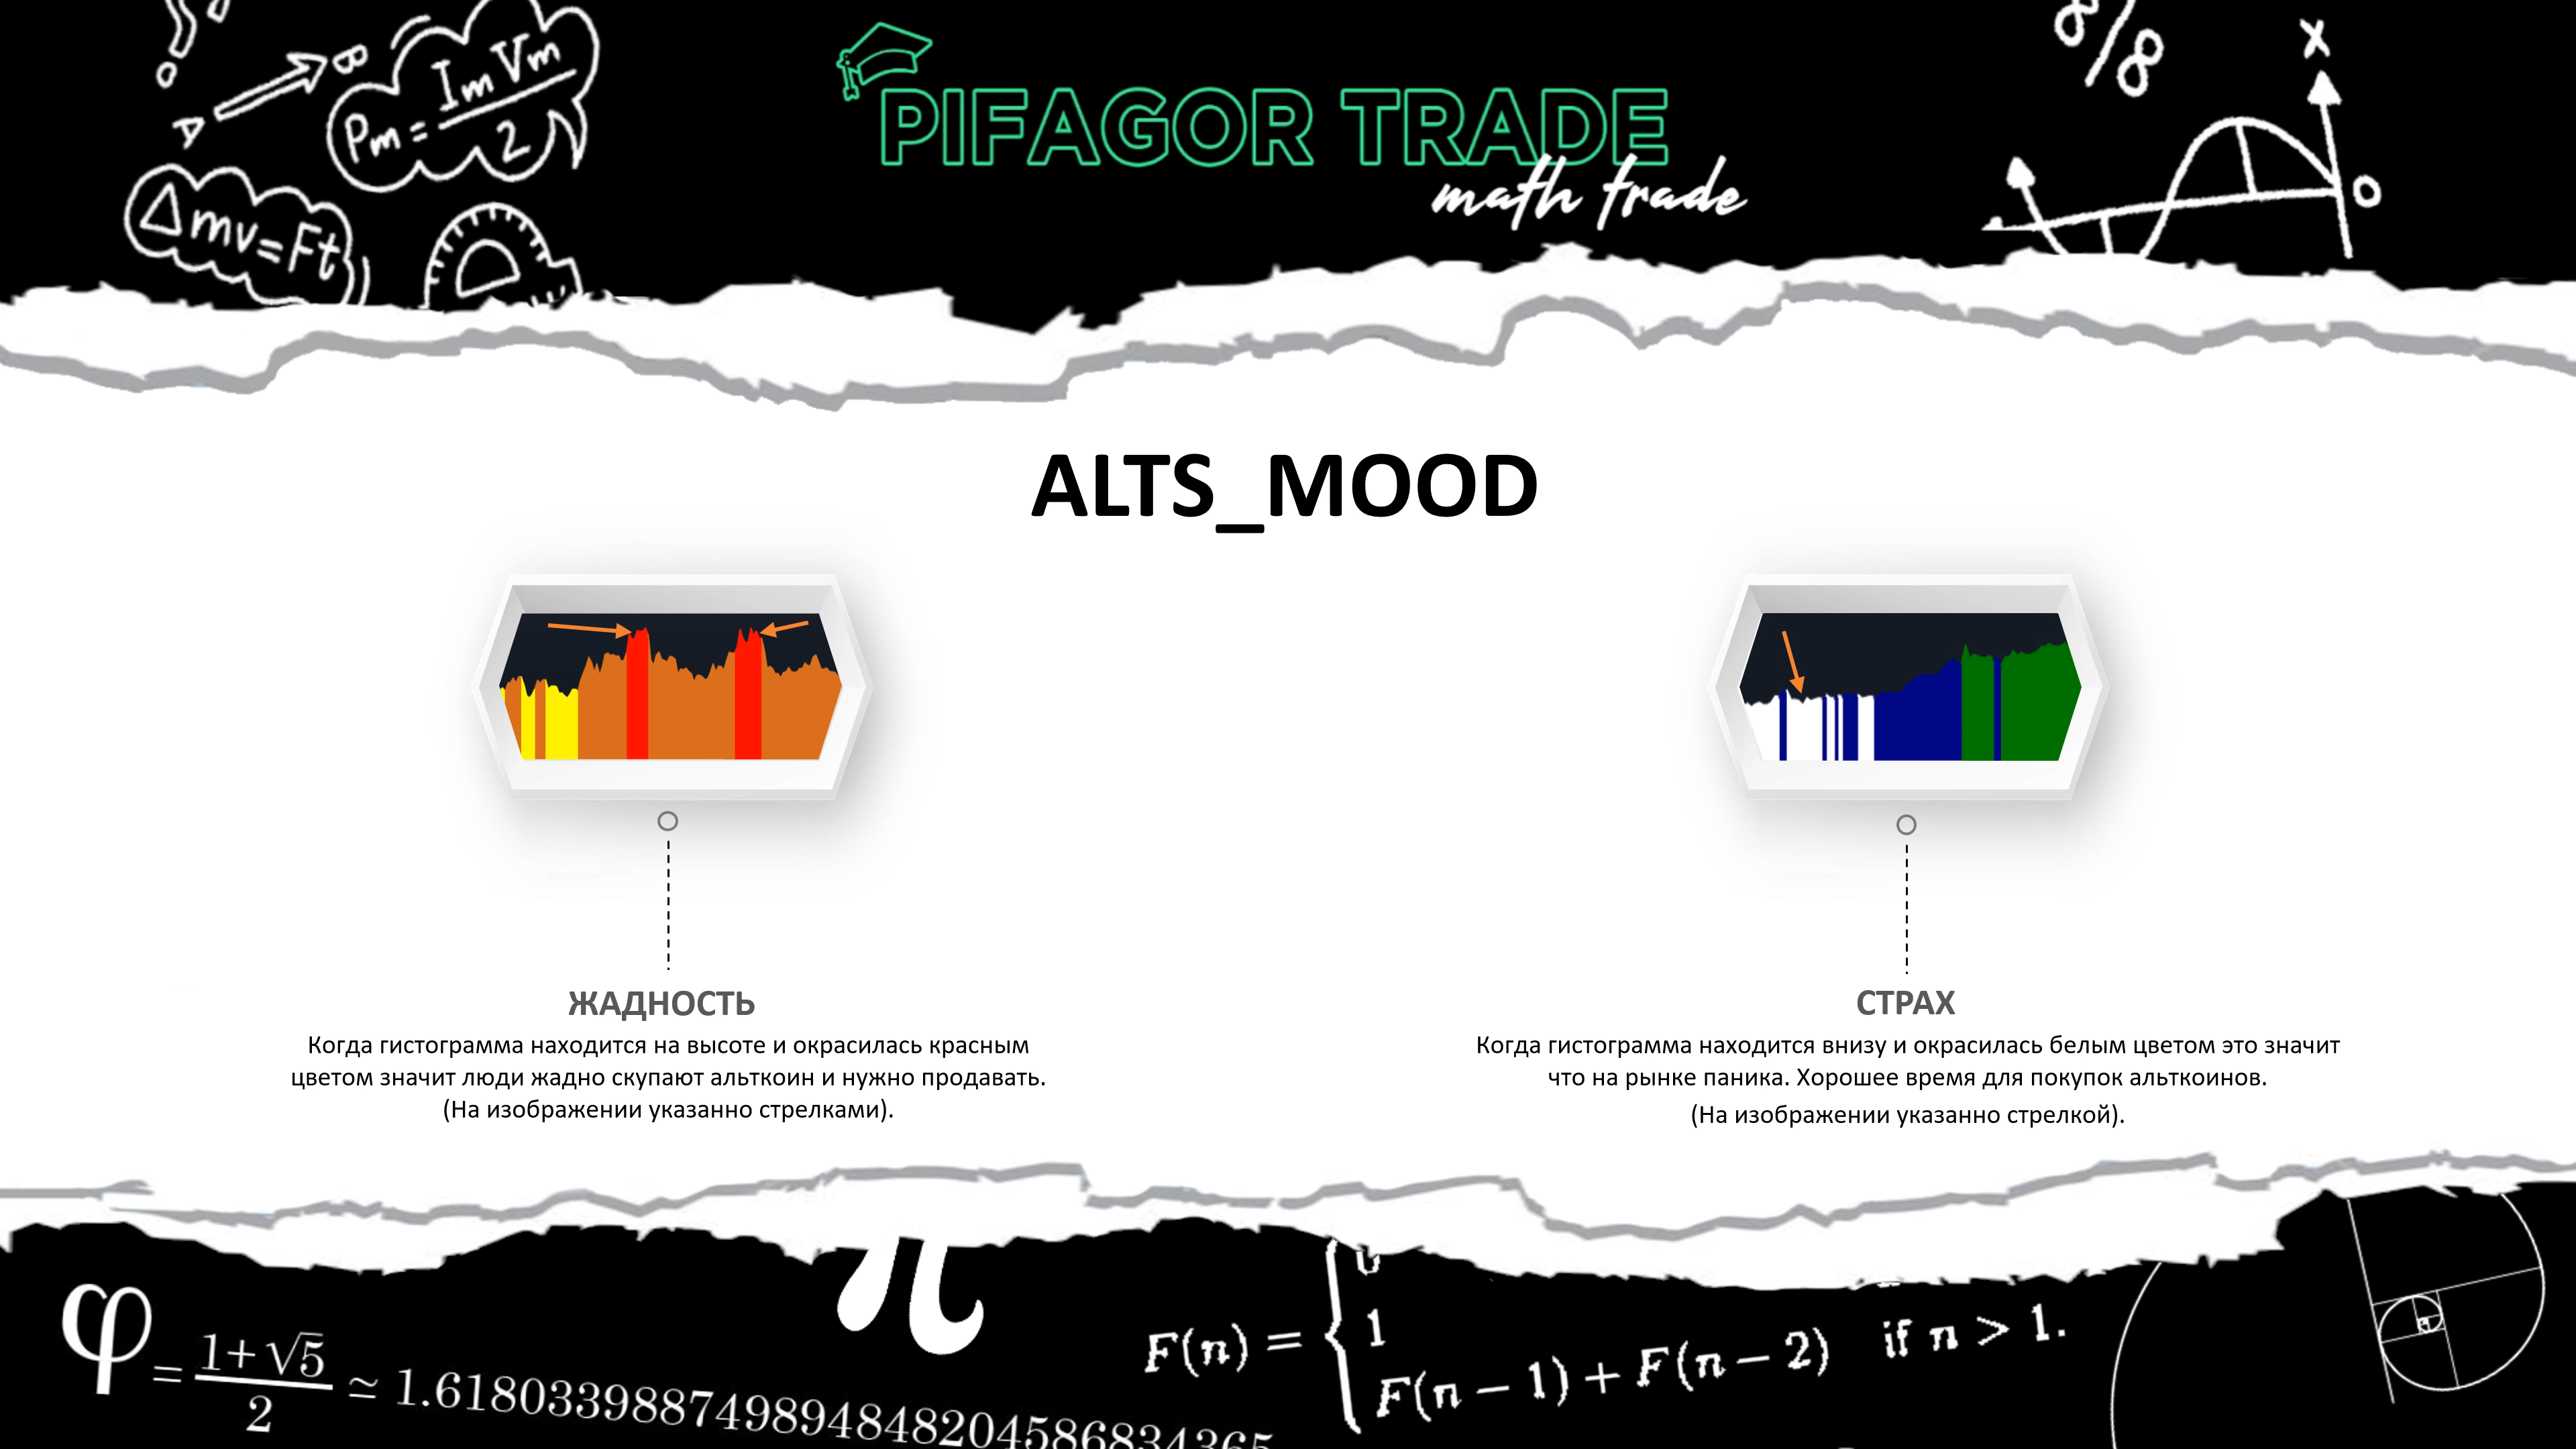
9. ALTS_Mood - The crowd's sentiment towards this asset
10. Big guy (2 modes)


11. DCA (Dollar Cost Averaging) for BTC
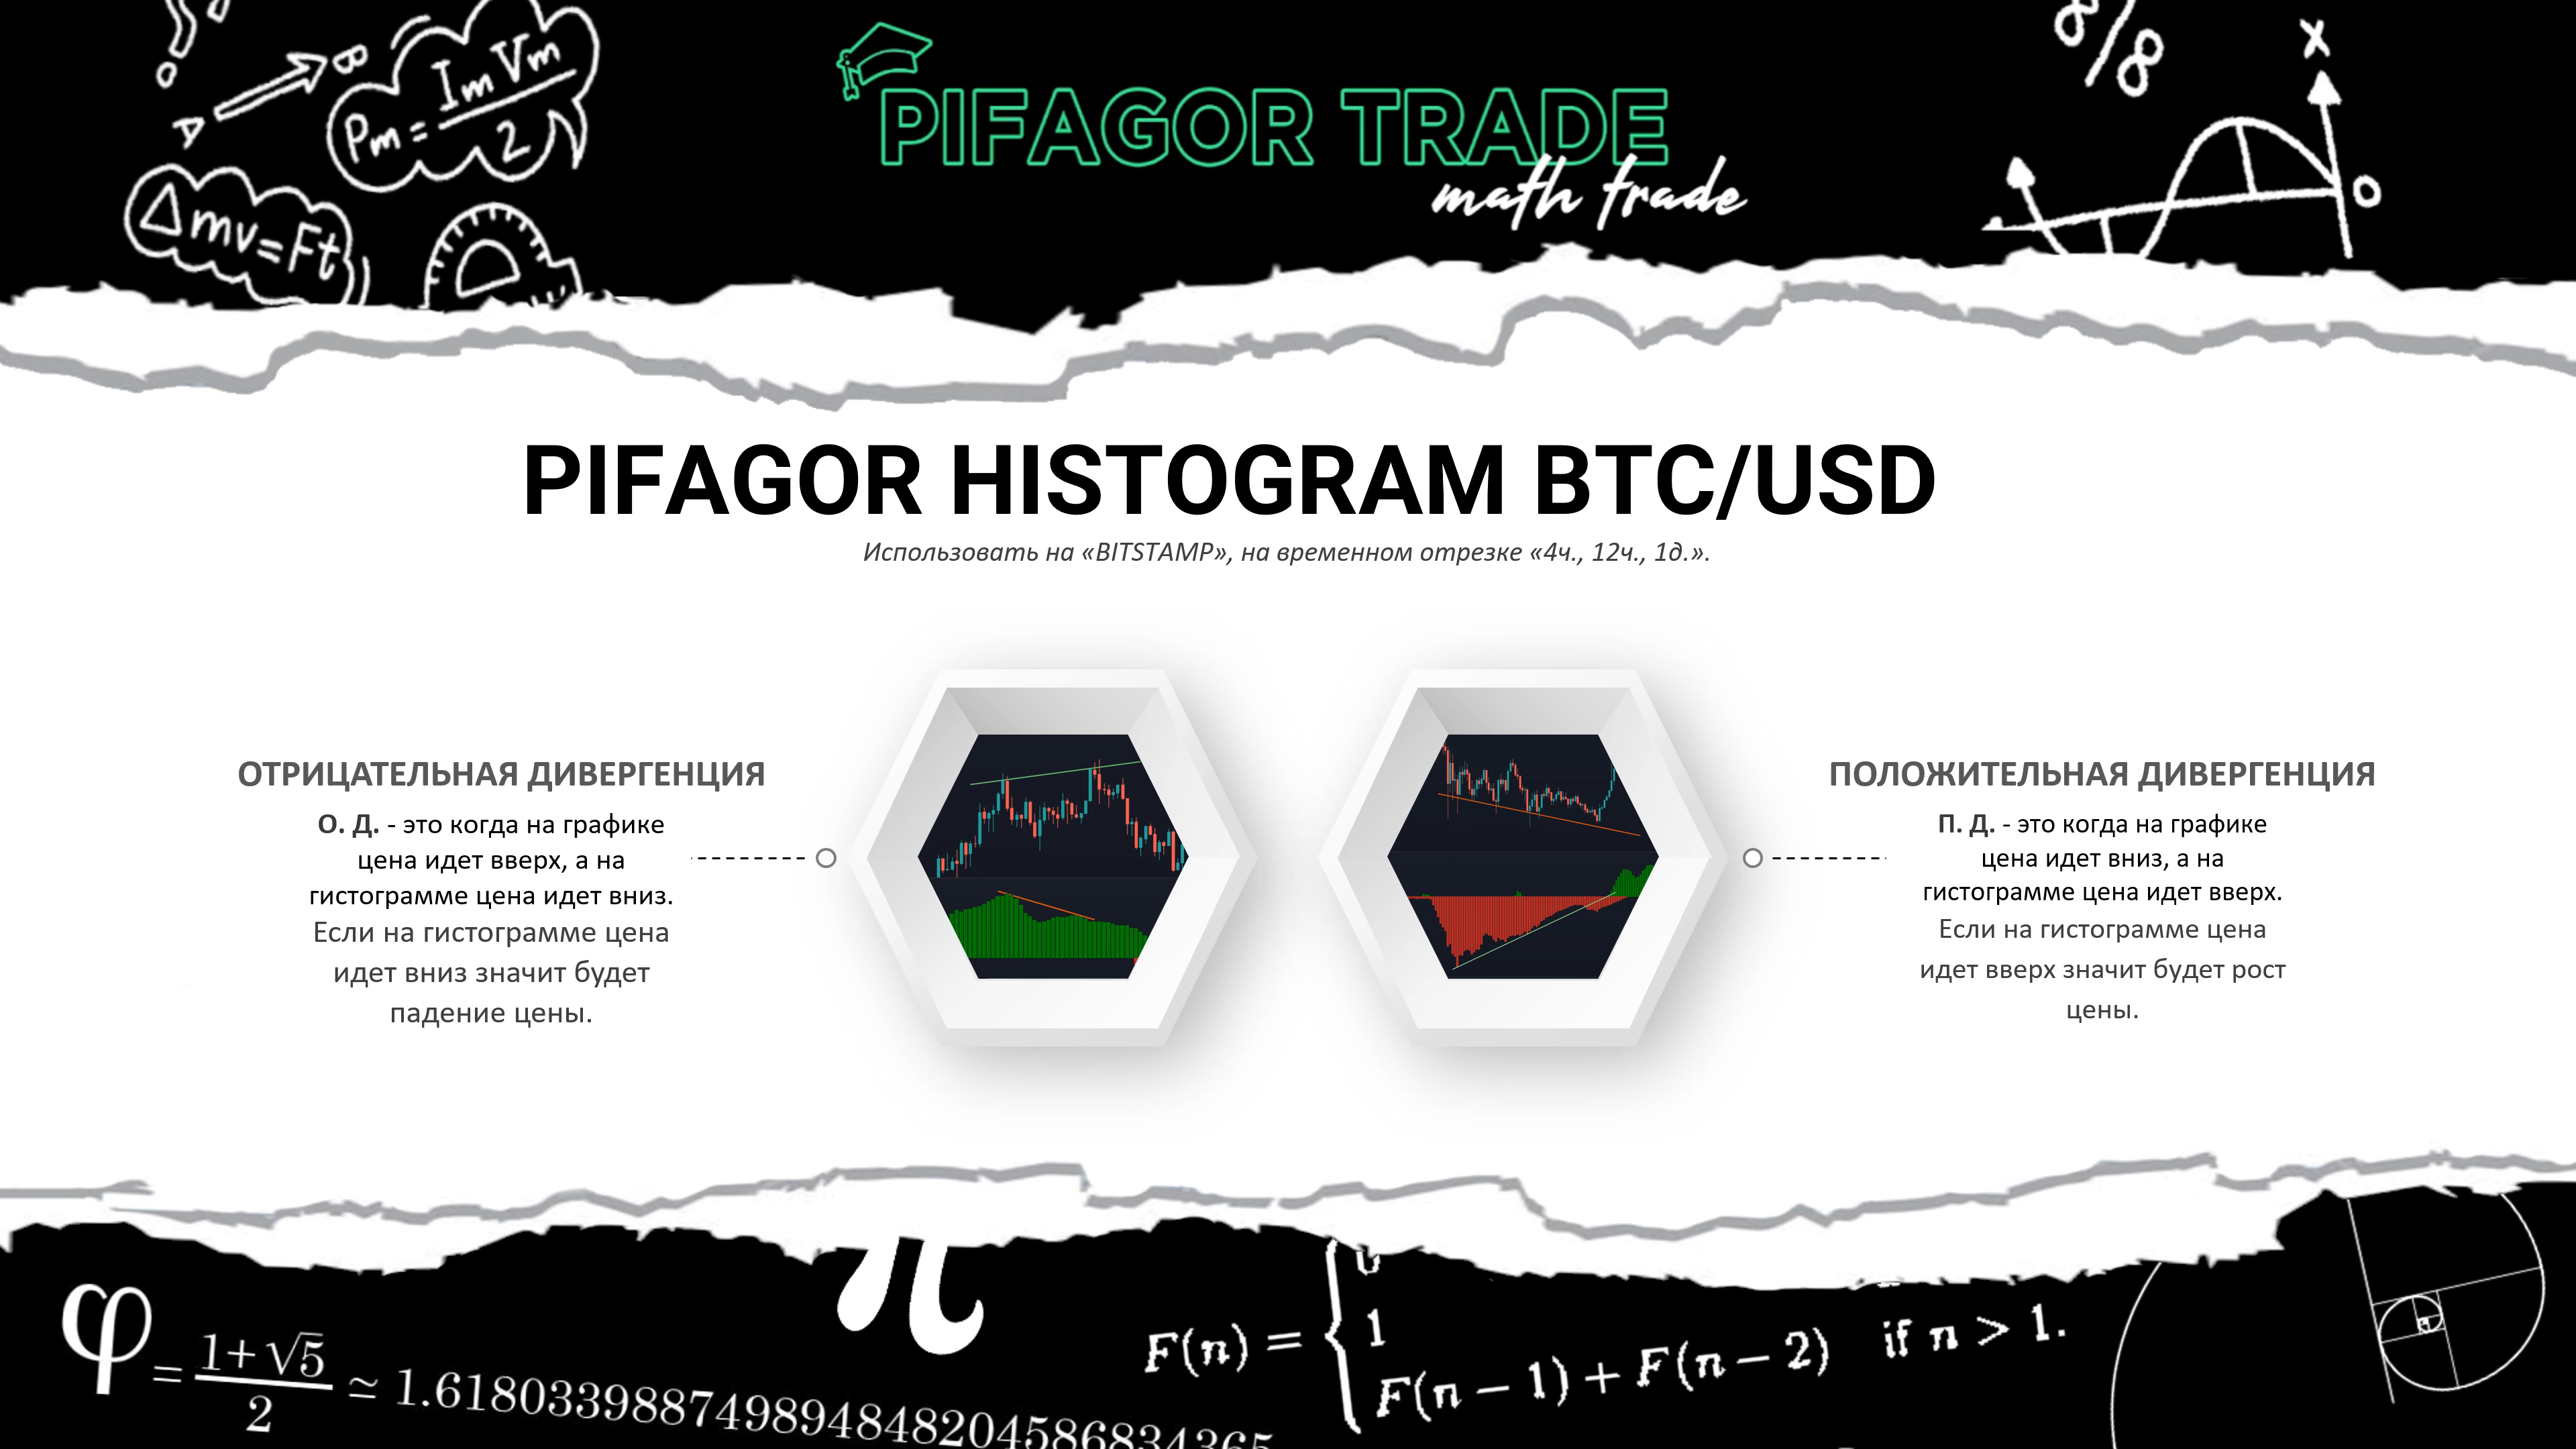
12. Pifagor histogram btc/usd Bitstamp 4h, 12h, 1d
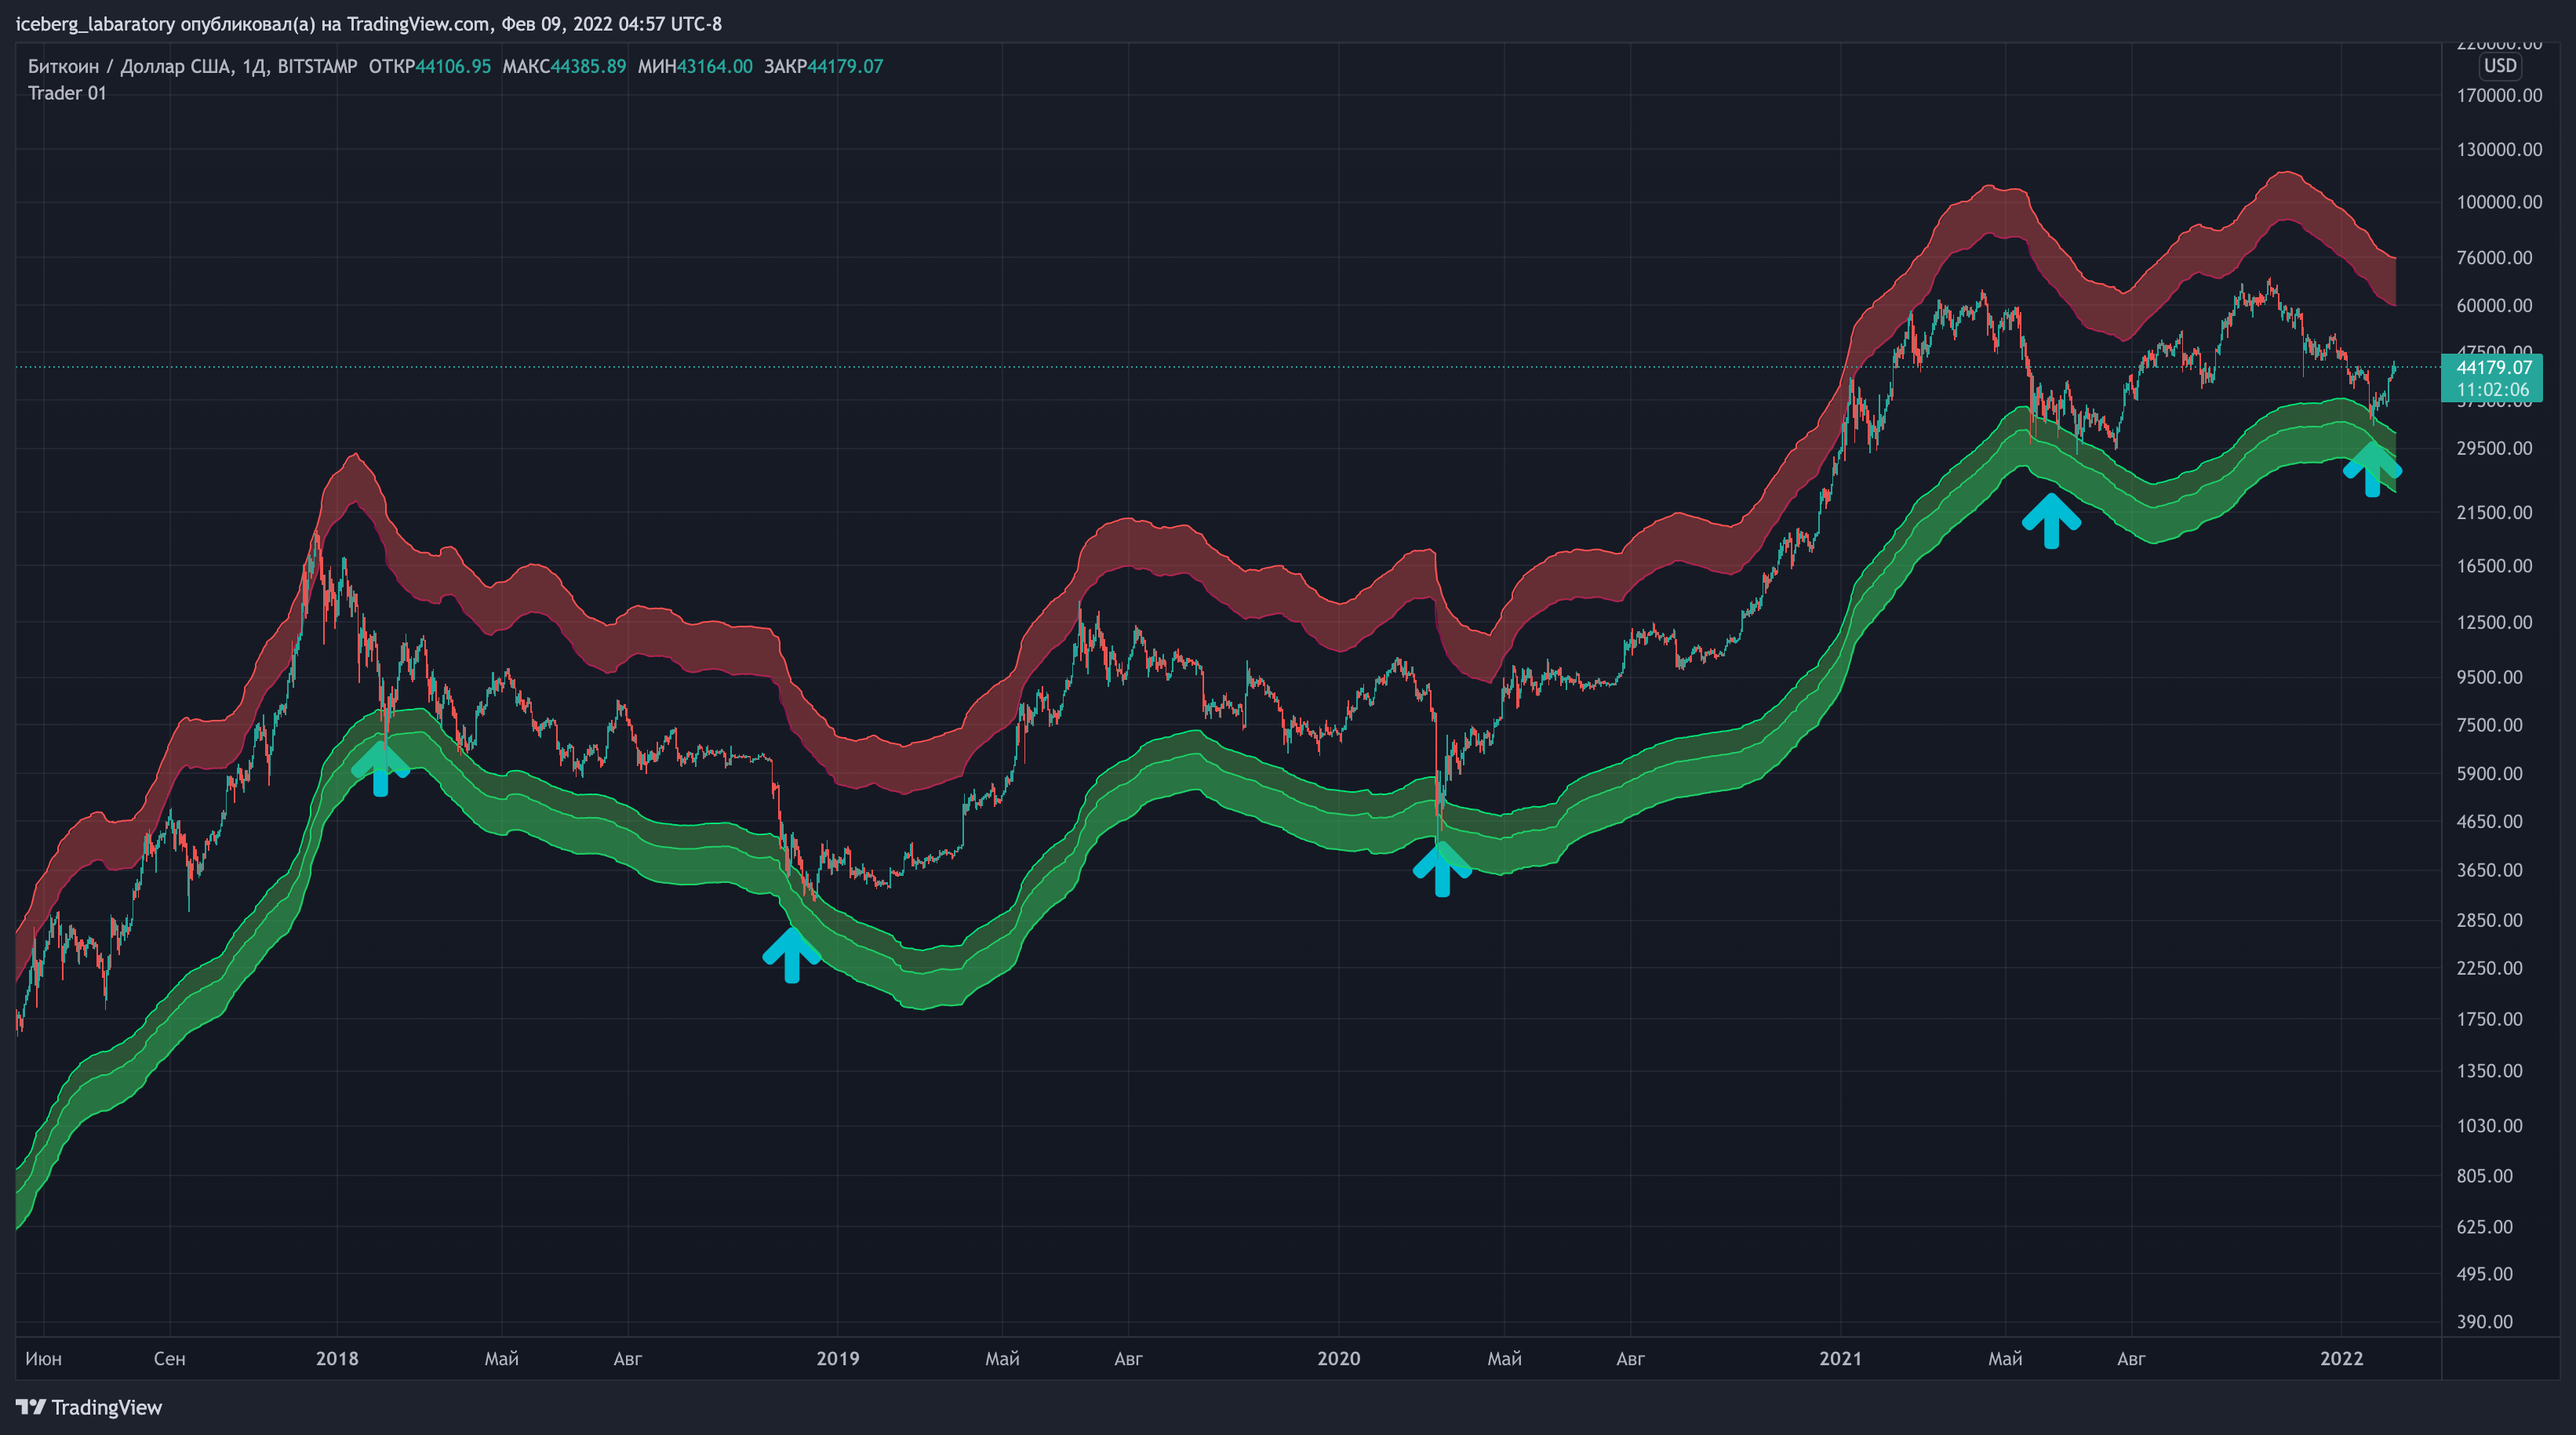
13. Trader 01
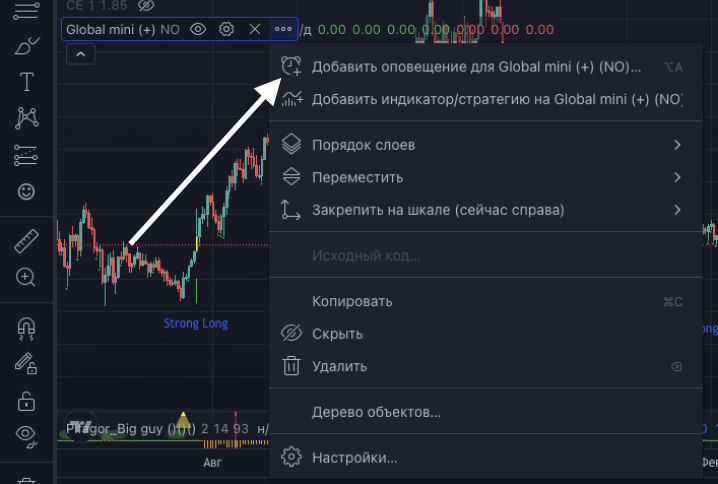
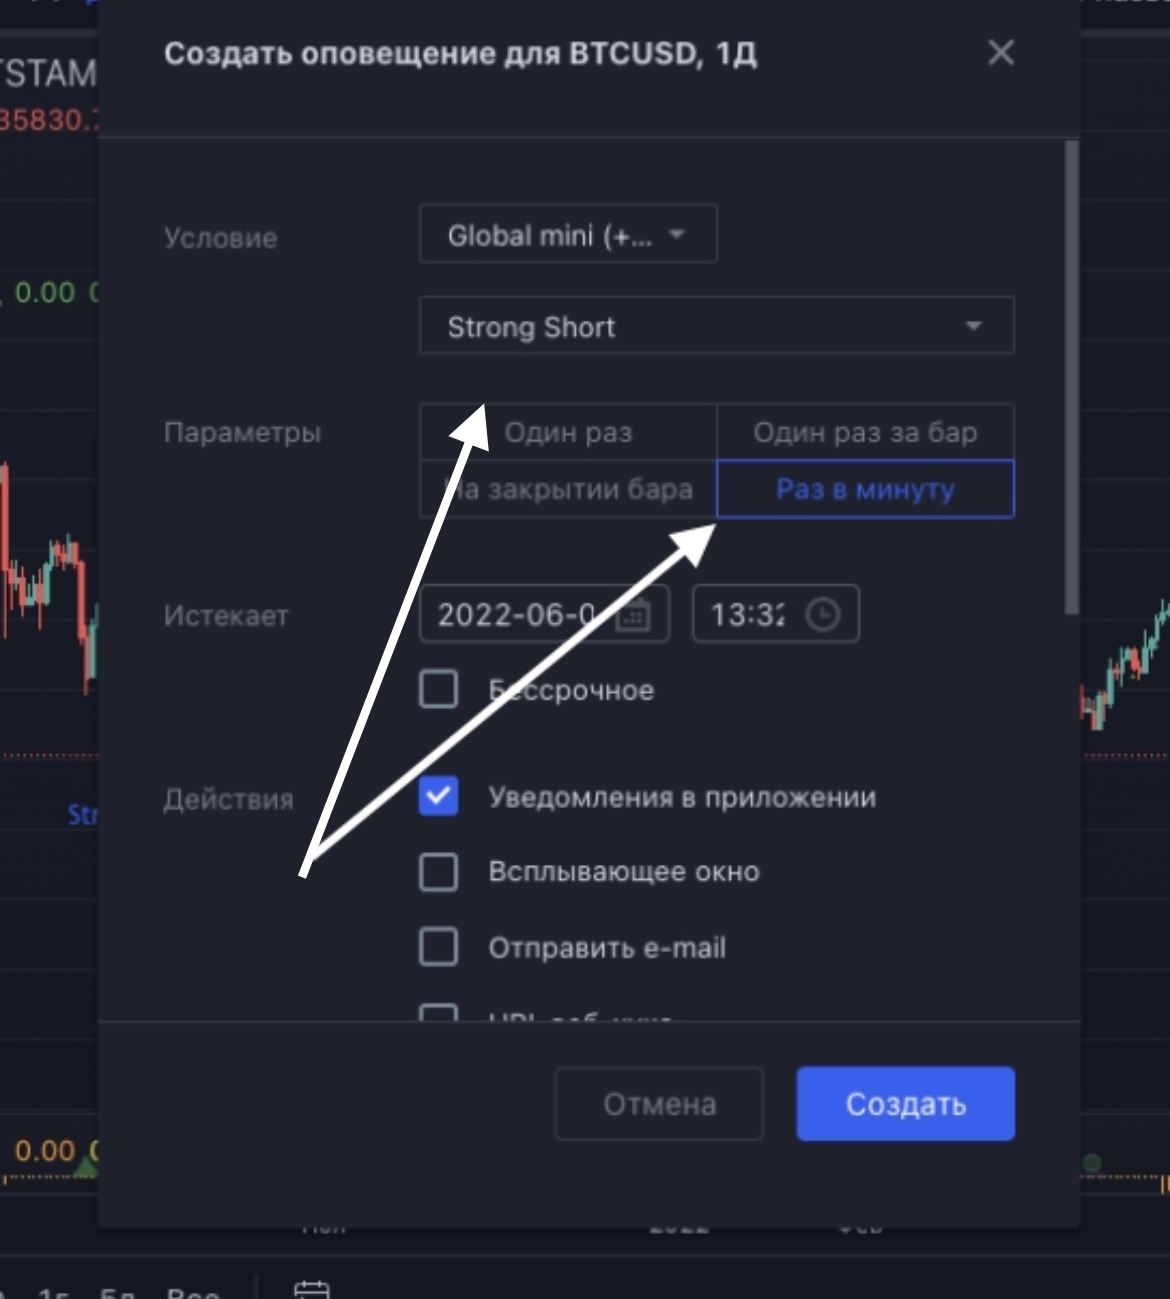
14. Global mini
Global Mini is a lightweight version of the Global indicator without any add-ons. This indicator only displays Strong Long and Strong Short, and you can also set alerts for Strong Short and Strong Long flashes.
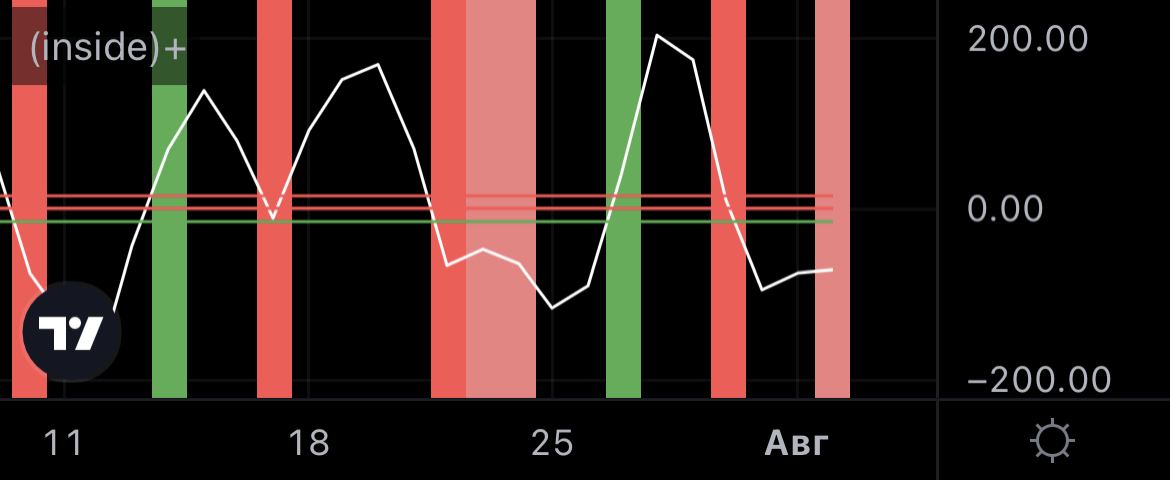
15. INSIDE+
Apply to BTC/USD Bitstamp 1D
We approach the upper line - short positions are added
We approach the lower line - long positions are added
16. Bottom Line
Bottom Line = our deviation of the "realized" price (the price at which each coin was first moved on the blockchain, as opposed to the current market price.)

17. BUY MORE Safety Trade

DISCLAIMER
None of these indicators are 100% guaranteed financial advisors. They are merely mathematical models and patterns based on specific metrics (be it history, on-chain transactions, or anything else) that have proven their effectiveness historically.
Remember that no one in the market knows the future; we only have the past, and by analyzing it, we can identify certain patterns.
Your greatest asset is your brain, the one with which you earned your capital and with which you can increase it.
Your sole responsibility for the trades you open lies with you. And only through personal responsibility can you increase your capital.