Ichimoku cloud
World Wide FuturesIshimoku indicator, Ichimoku Kinko Hyo is a technical indicator developed in the 1930s by Japanese analyst Goichi Hosoda. The Ishimoku indicator combines several approaches to market analysis and is designed to identify trends, support and resistance lines and generate buy/sell signals.
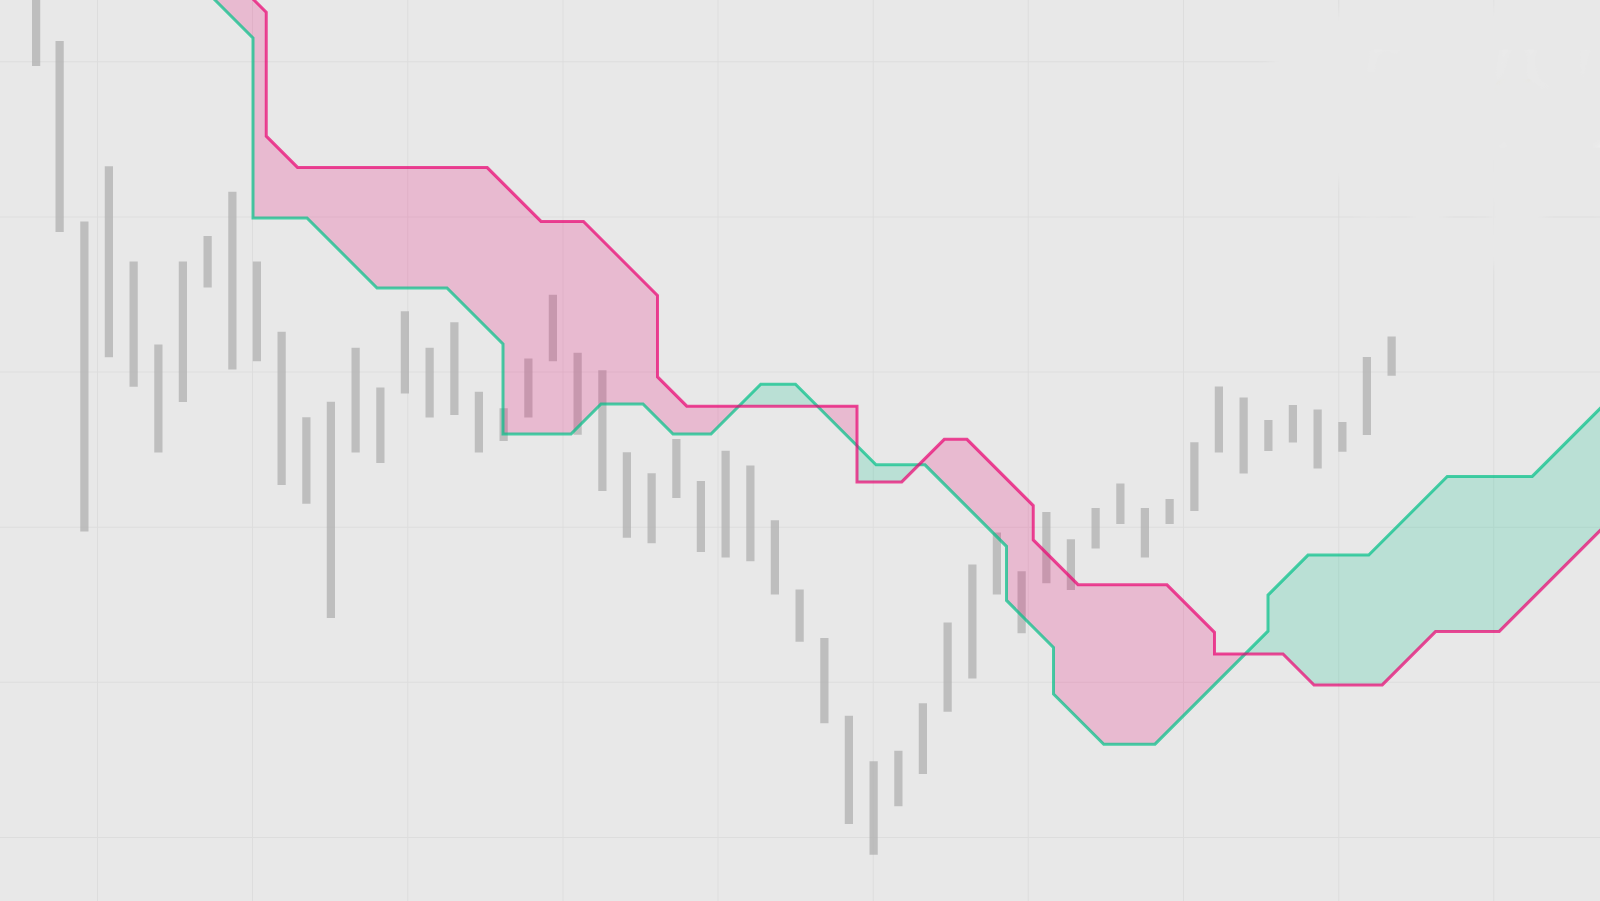
The Ichimoku Cloud system displays data based on leading and lagging indicators. The graph consists of five lines:
1️⃣ Turnover Line (Tenkan-sen): 9 day moving average.
2️⃣ Standard line (Kijun-sen): 26 day moving average.
3️⃣ Senkou Span A: A moving average between the rollover line and the standard line that projects future 26 day periods.
4️⃣ Senkou Span B: 52 day moving average that forecasts future 26 day periods.
5️⃣ Chikou Span: current period closing price, which is based on the past 26 day period.
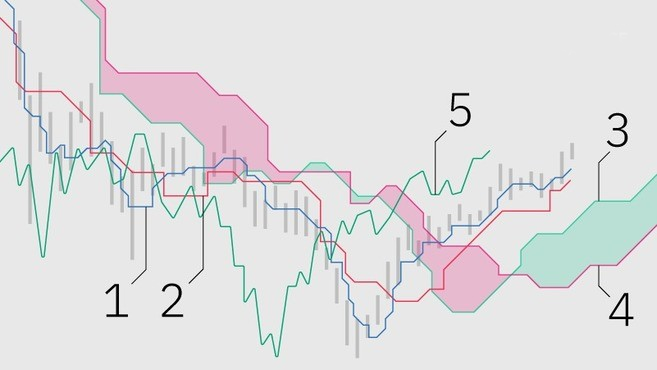
The space between Senkou A (3) and Senkou B (4) is called the cloud (Kumo), which is the most prominent element of the Ishimoku system. The two lines forecast future 26 day periods and as such are considered leading indicators, while the Chikou Span (5) is a lagging indicator and provides data based on the past 26 day period.
Clouds are highlighted in green and red to make them easier to read. The green cloud is created when Senkou A (top line of the green cloud) is higher than Senkou B (bottom line of the red cloud), the red cloud is derived from the opposite interaction of the same lines.
Trading Signals
The Ichimoku Cloud generates different types of signals: momentum direction signals and trend following signals.
☑️ Pulse Direction Determination Signals: generated according to the market price and the intersections of the standard line and the reversal line. A bullish momentum signal is generated when one or both lines move above the standard line. A bearish momentum signal when one or both lines move below the standard line. The intersection of these two lines in the lower direction is commonly referred to as the "dead cross" and in the upper direction as the "golden cross".
☑️ Trend following signals: generated according to the colour of the cloud and the position of the market price. As mentioned above, the colour of the clouds reflects the difference between Senkou span A and B.
When price is consistently above the cloud, there is a higher probability that the asset is in an uptrend. In turn, if price moves below it, it can be interpreted as a bearish signal indicating a downtrend. Except for some factors, a trend can change to flat when the price is moving sideways within the cloud.
❗️Ichimoku can also be used to identify support and resistance zones. Senkou A (the green cloud line) acts as a support line during an uptrend and as a resistance line during a downtrend. In both cases the candlesticks tend to approach Senkou A, but if the price moves towards the cloud, Senkou B can act as both a support and resistance line.
Profit, everyone!