How to trade candlestick patterns like a pro
You’ve likely heard of candlestick patterns and price action trading more than you can count. Yet, these are essential concepts in technical analysis. You’ll learn all you need about candlestick patterns for Binomo and how they can help in trading them in this piece.
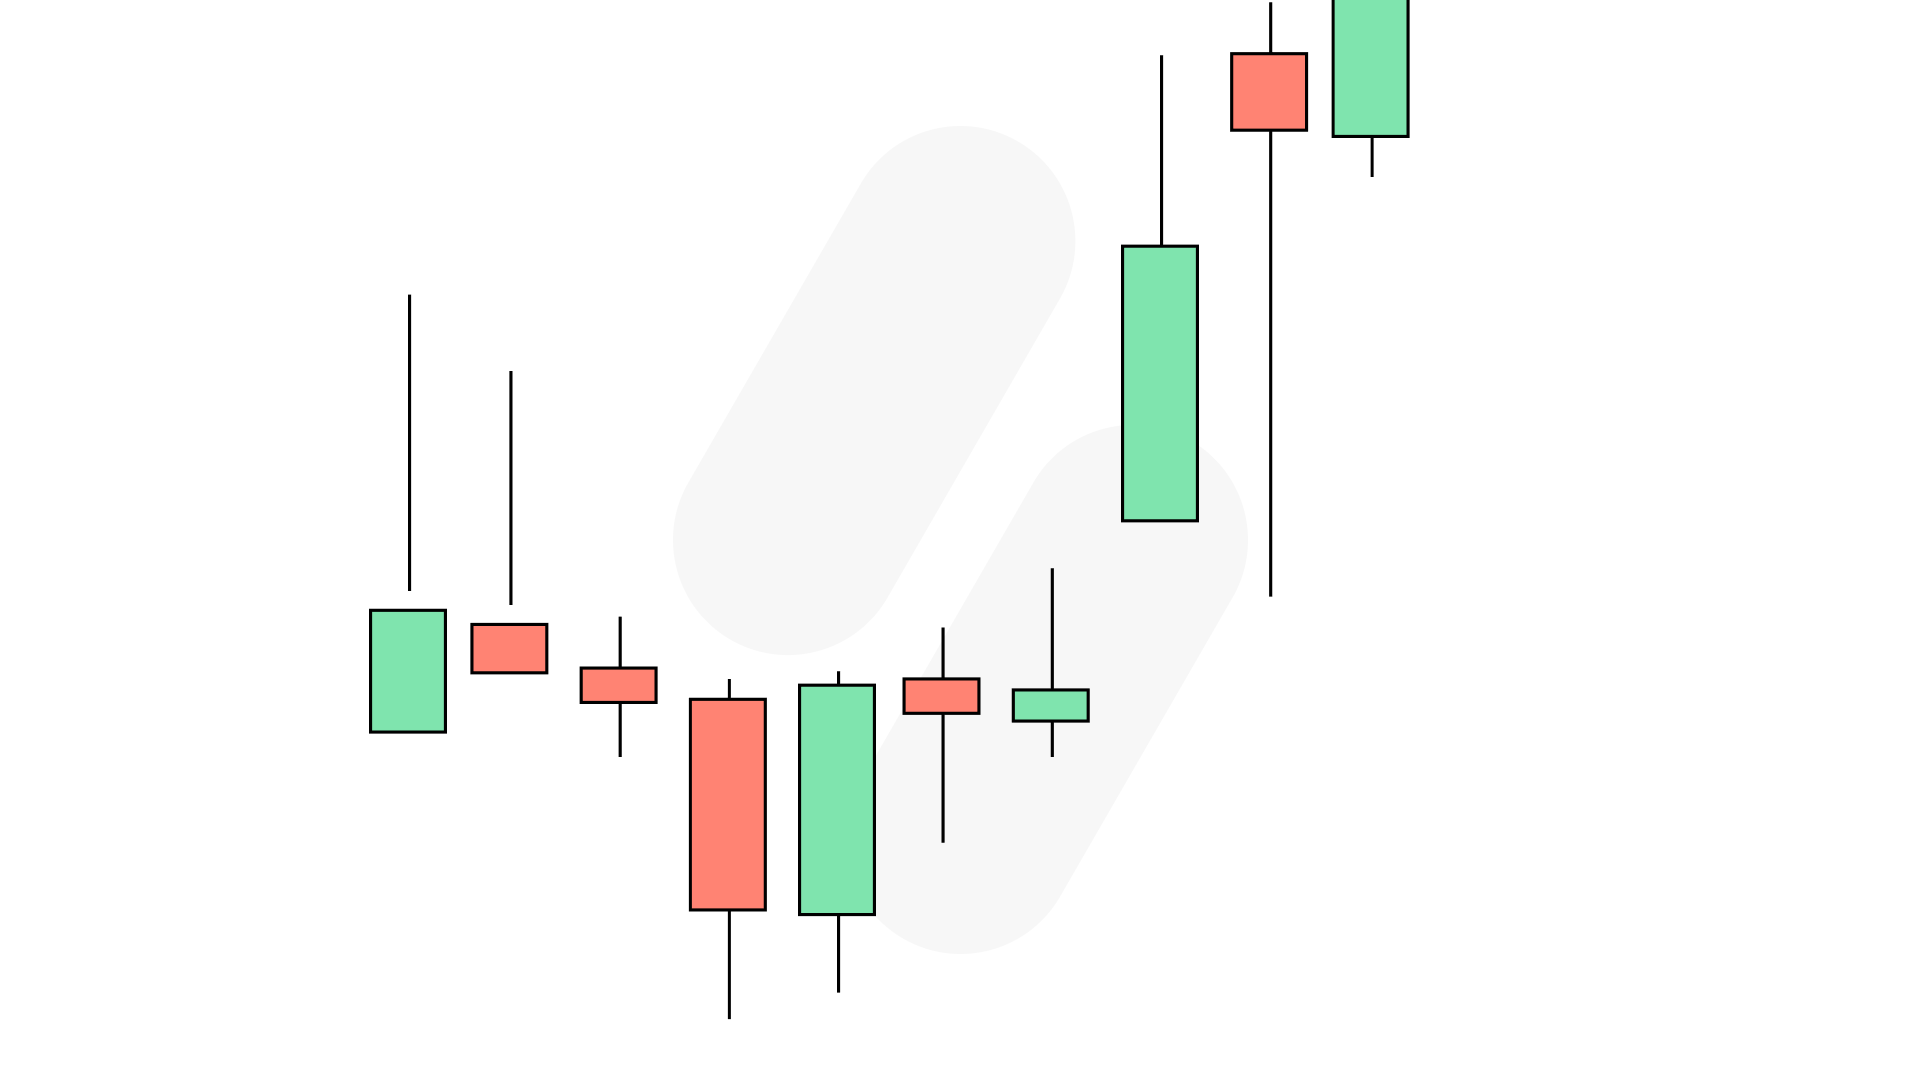
What is a candle on the chart?
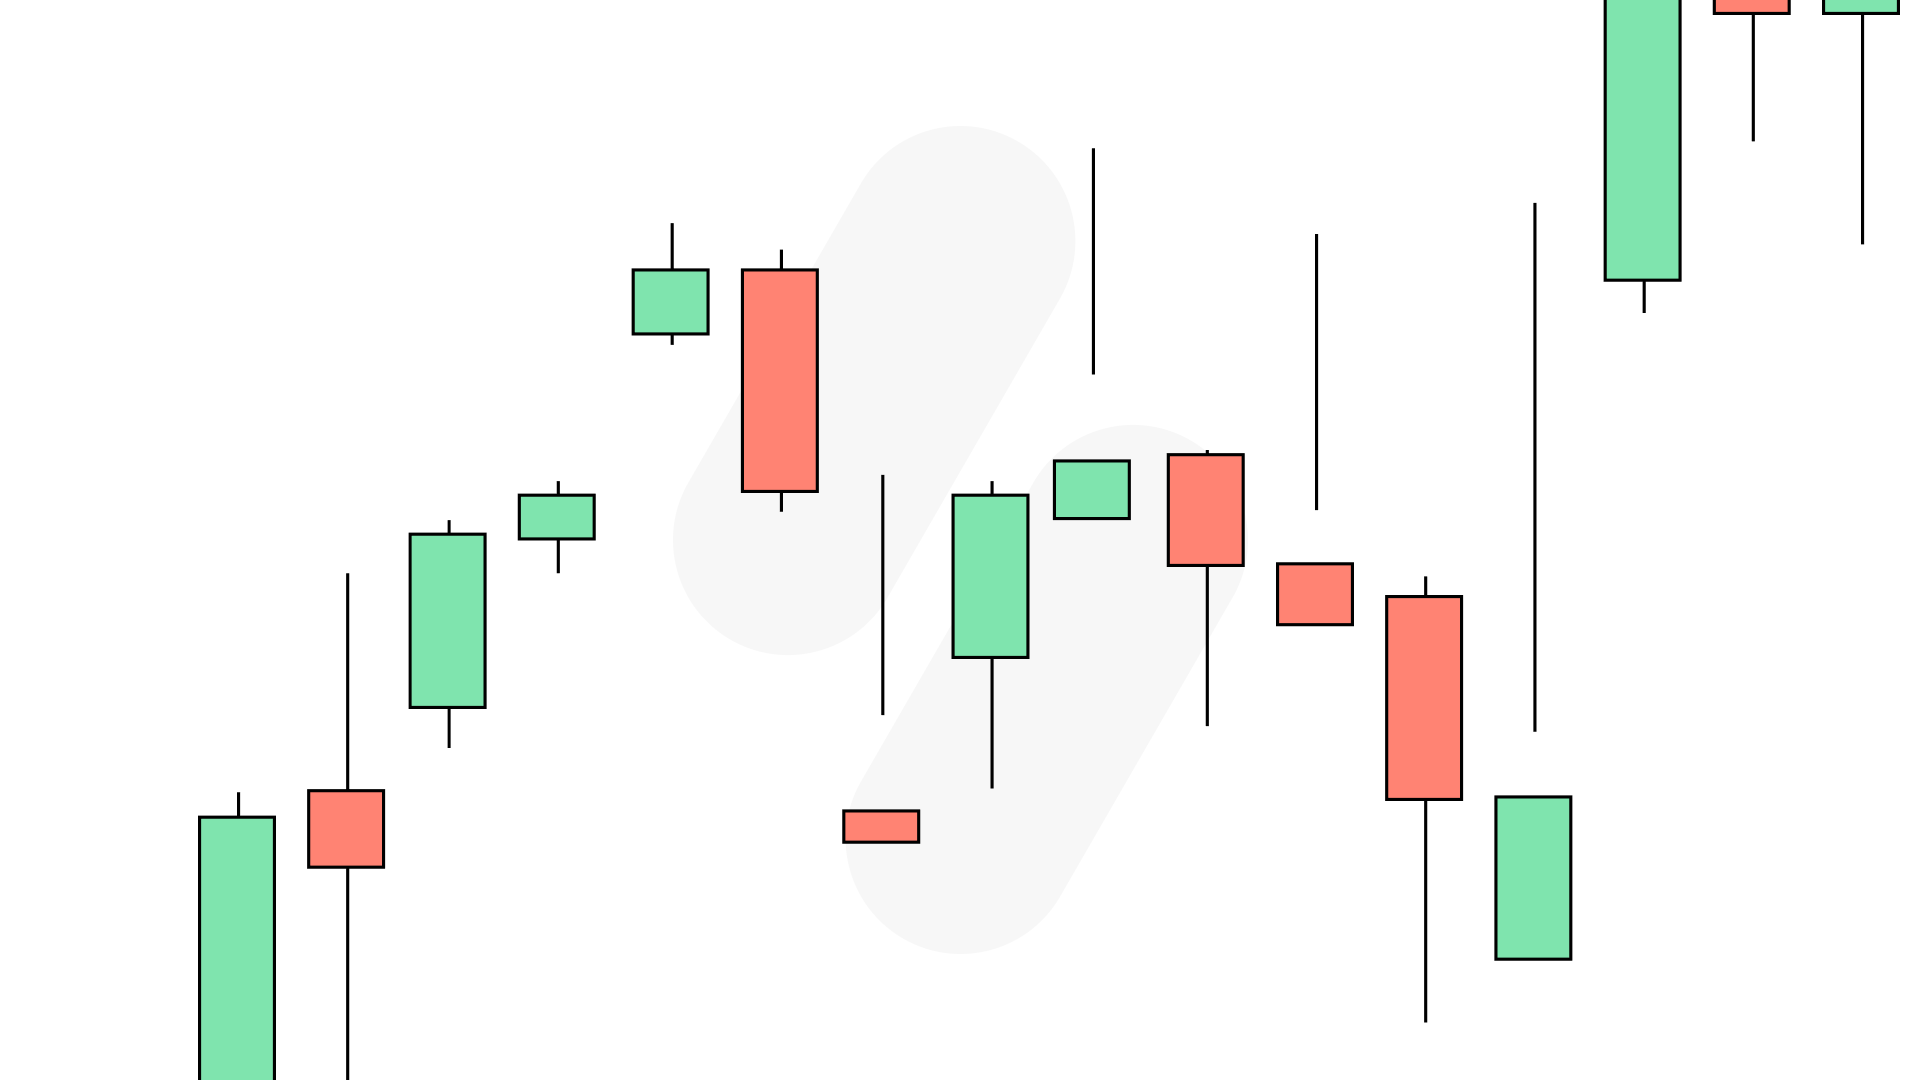
As the name implies, the candle on the chart looks like a candle with a wide part and wicks below and above it. These parts indicate open, close, low, and high market prices.
What is a candlestick pattern, and how to read it?
Like other technical analysis tools, candlestick patterns predict price direction for various time frames. They pack information for the numerous time frames into single-price bars. As a result, they’re more functional than bar charts or lines that merely connect closing price dots.
Note that candlesticks patterns are not future indicators. Instead, they base their results on past and current price fluctuations. Traders make trading decisions following candlestick patterns that forecast price direction in the short term.
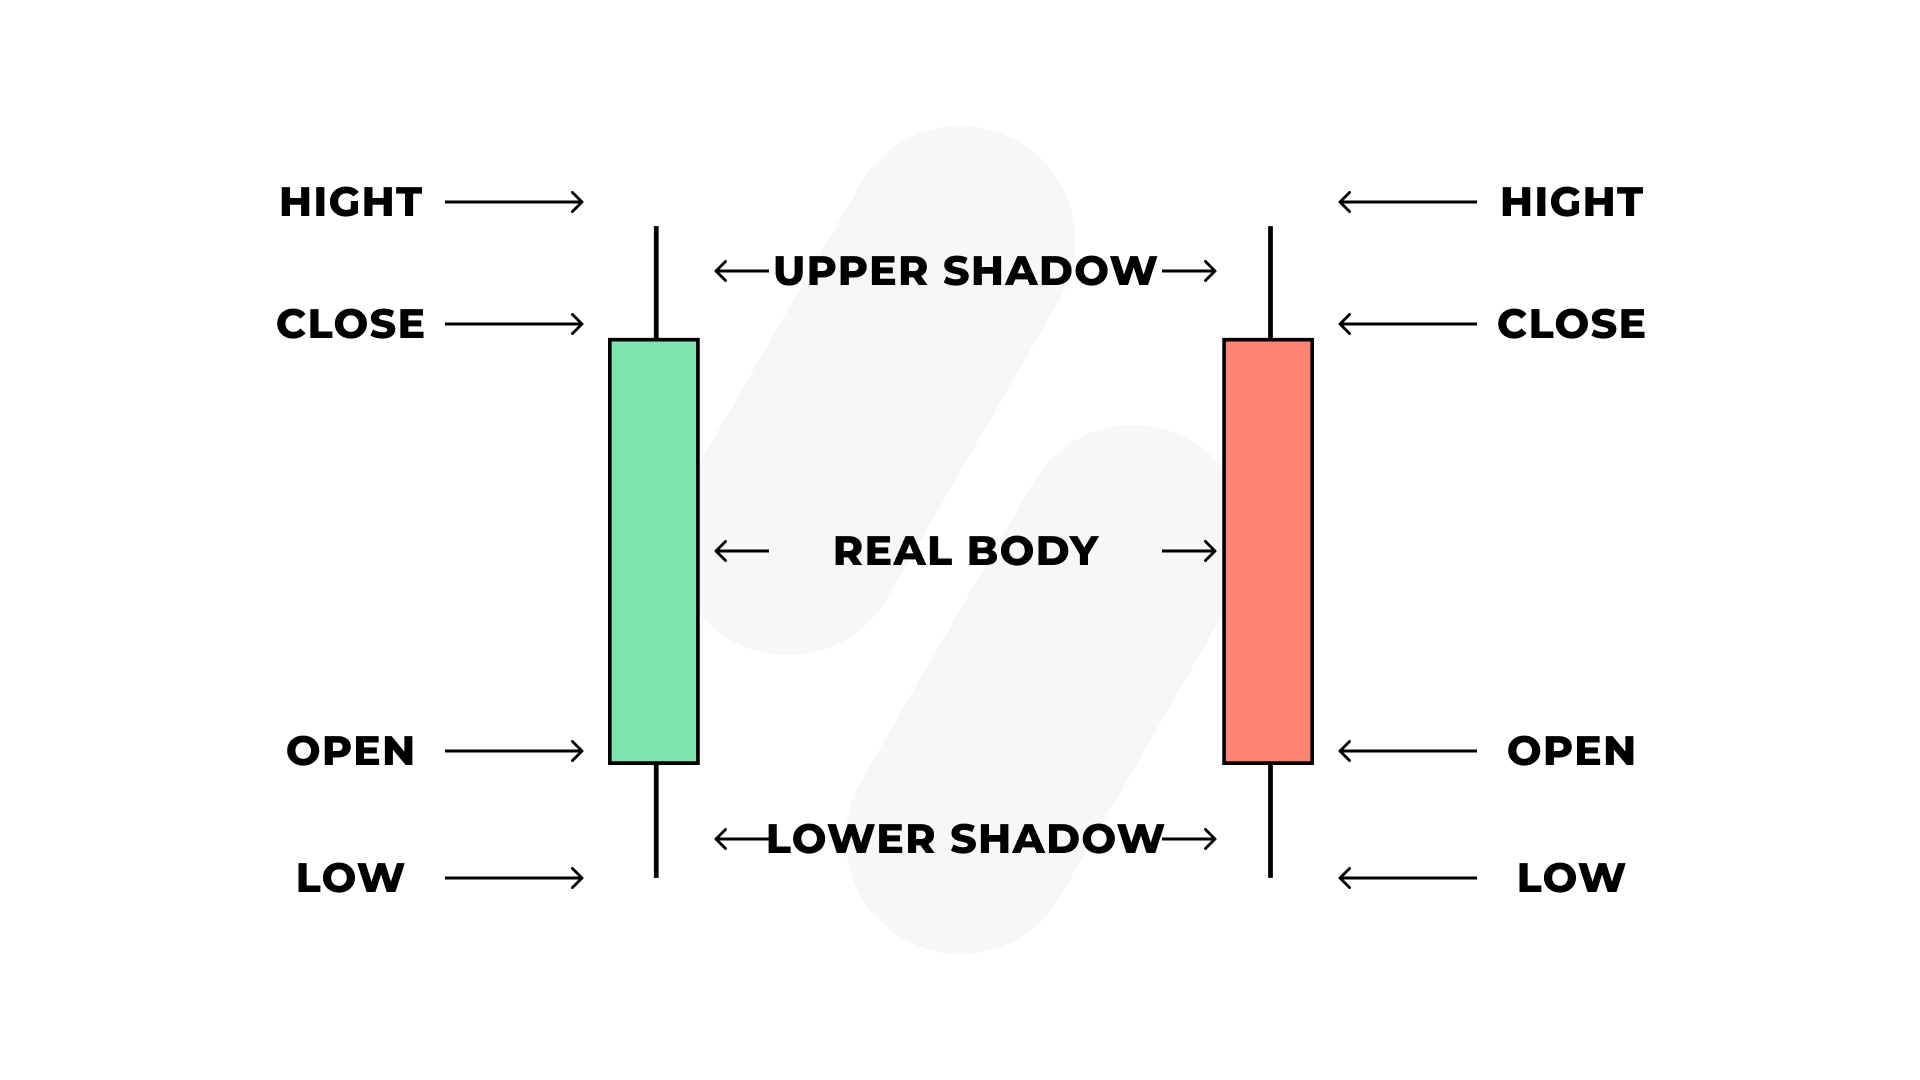
Candlestick patterns are pretty easy to read. The wide rectangular part, also called the ‘real body,’ indicates the open and close prices for the day. For example, a ‘black or filled-in real body’ (red on Binomo charts) shows a higher open than close price. On the other hand, an ‘empty real body’ (green on Binomo charts) shows that the open price is lower than the close price.
Wicks, also called shadows, represents the daily trading of low and high prices, which may be short or long. These lengths indicate the low/high points during a given timeframe.
The top of the candle’s upper wick displays the greatest price realized throughout a specified period. Meanwhile, the lower wick, which has the lowest price as its starting point, rises to the candle’s body during the stated time frame.
What patterns exist in trading?
Candlestick patterns can either be bullish or bearish. While bullish patterns show that prices will likely rise, bearish patterns predict prices that will fall. As such, you’ll notice bullish patterns forming when the price closes at a higher price than it opened. This template is green by default, although some experts prefer to use white.
Meanwhile, bearish candlesticks are present when the closing price is lower than the opening price. The default color is typically red or black.
It’s important to understand that candlestick patterns are not certain and are only based on tendencies. So, you can’t expect them to be correct 100% of the time.
Pattern examples and how to see them on the chart
There are different types of candlestick patterns to note on a chart. These are the most common ones.
Doji
Doji candlestick is a neutral candlestick (neither bullish nor bearish). It represents an equilibrium bearish and bullish stage.
As such, you'll find that this candlestick has no real body and takes the form of a dash. The Doji candle will frequently predict an impending price reversal.
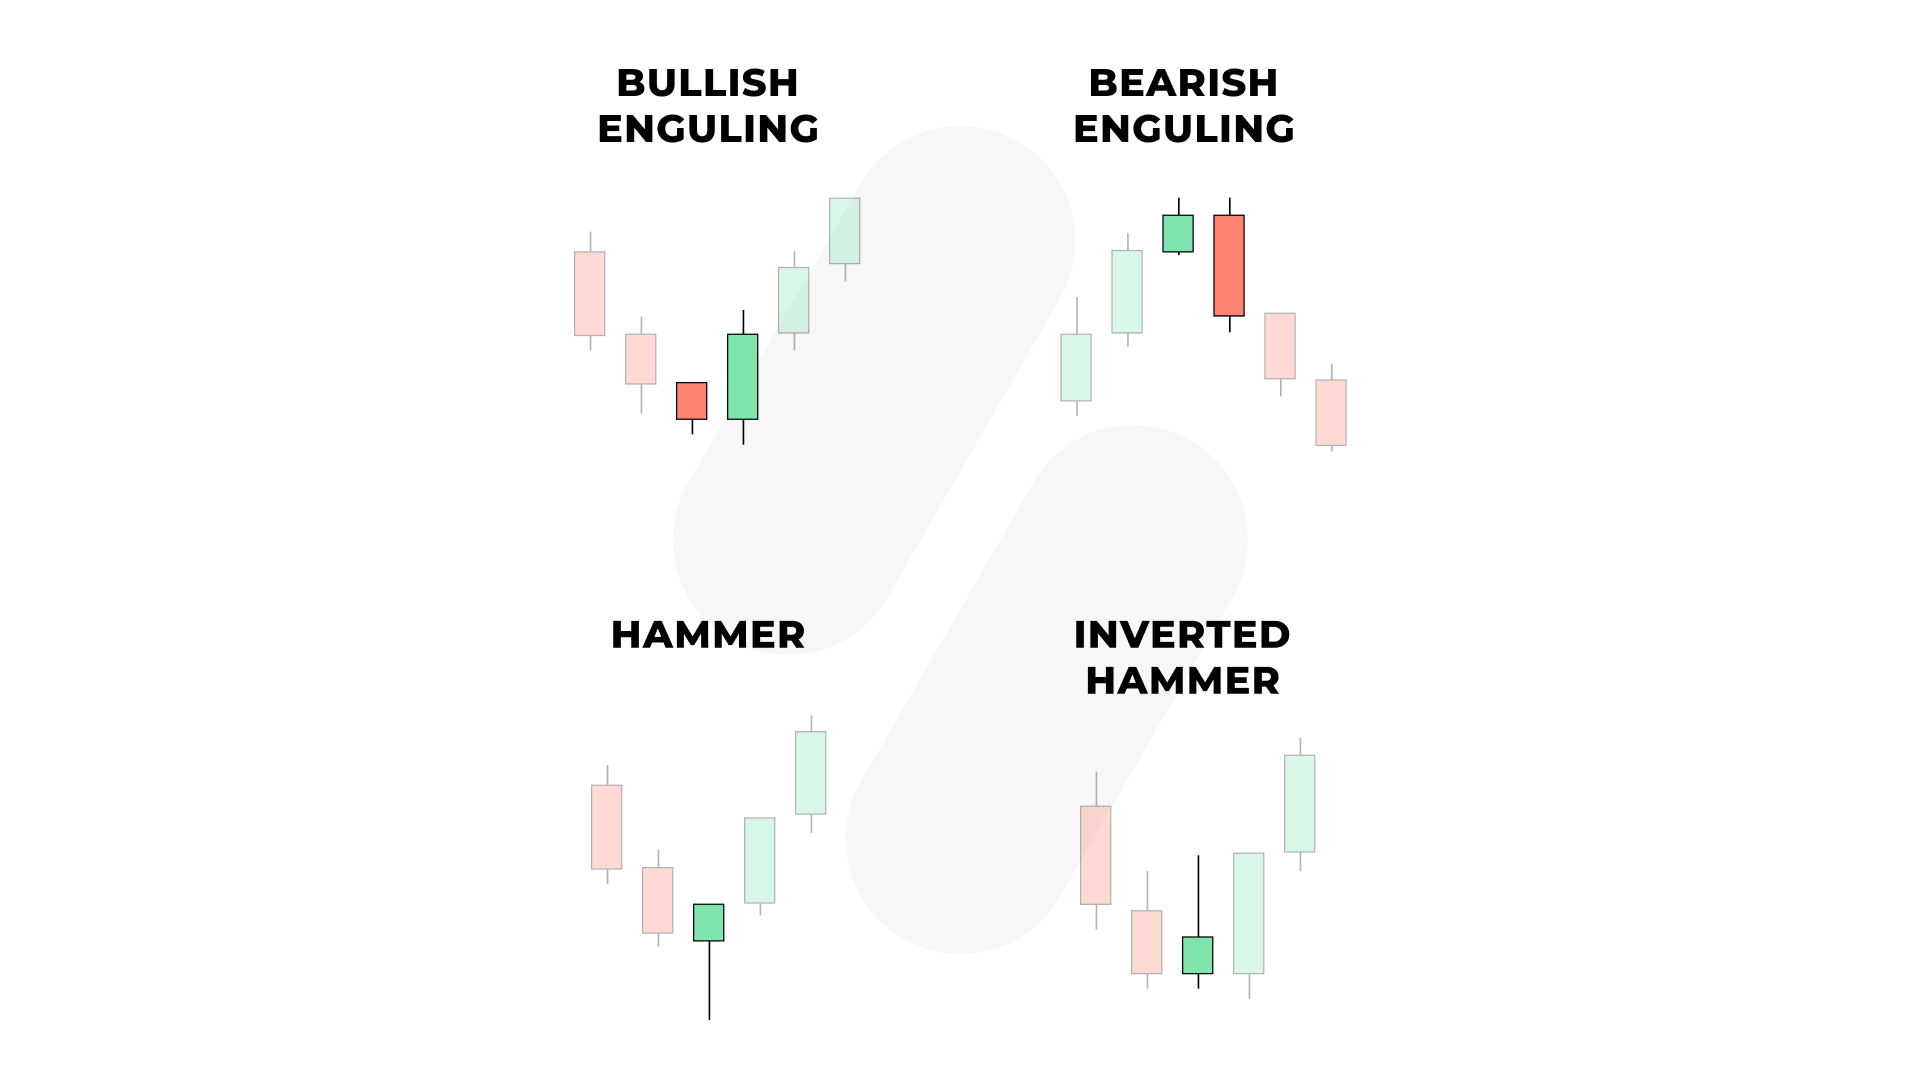
Hammer
The Hammer candlestick family is like Doji in that its presence indicates a price reversal. It comprises the Hammer, Inverted Hammer, Hanging Man, and Shooting Star candlesticks. These candlesticks typically have a small real body and long lower or upper shadows.
Engulfing
Engulfing candlestick patterns comprise a candle that engulfs a smaller candle's price action. They can either be bullish or bearish patterns.
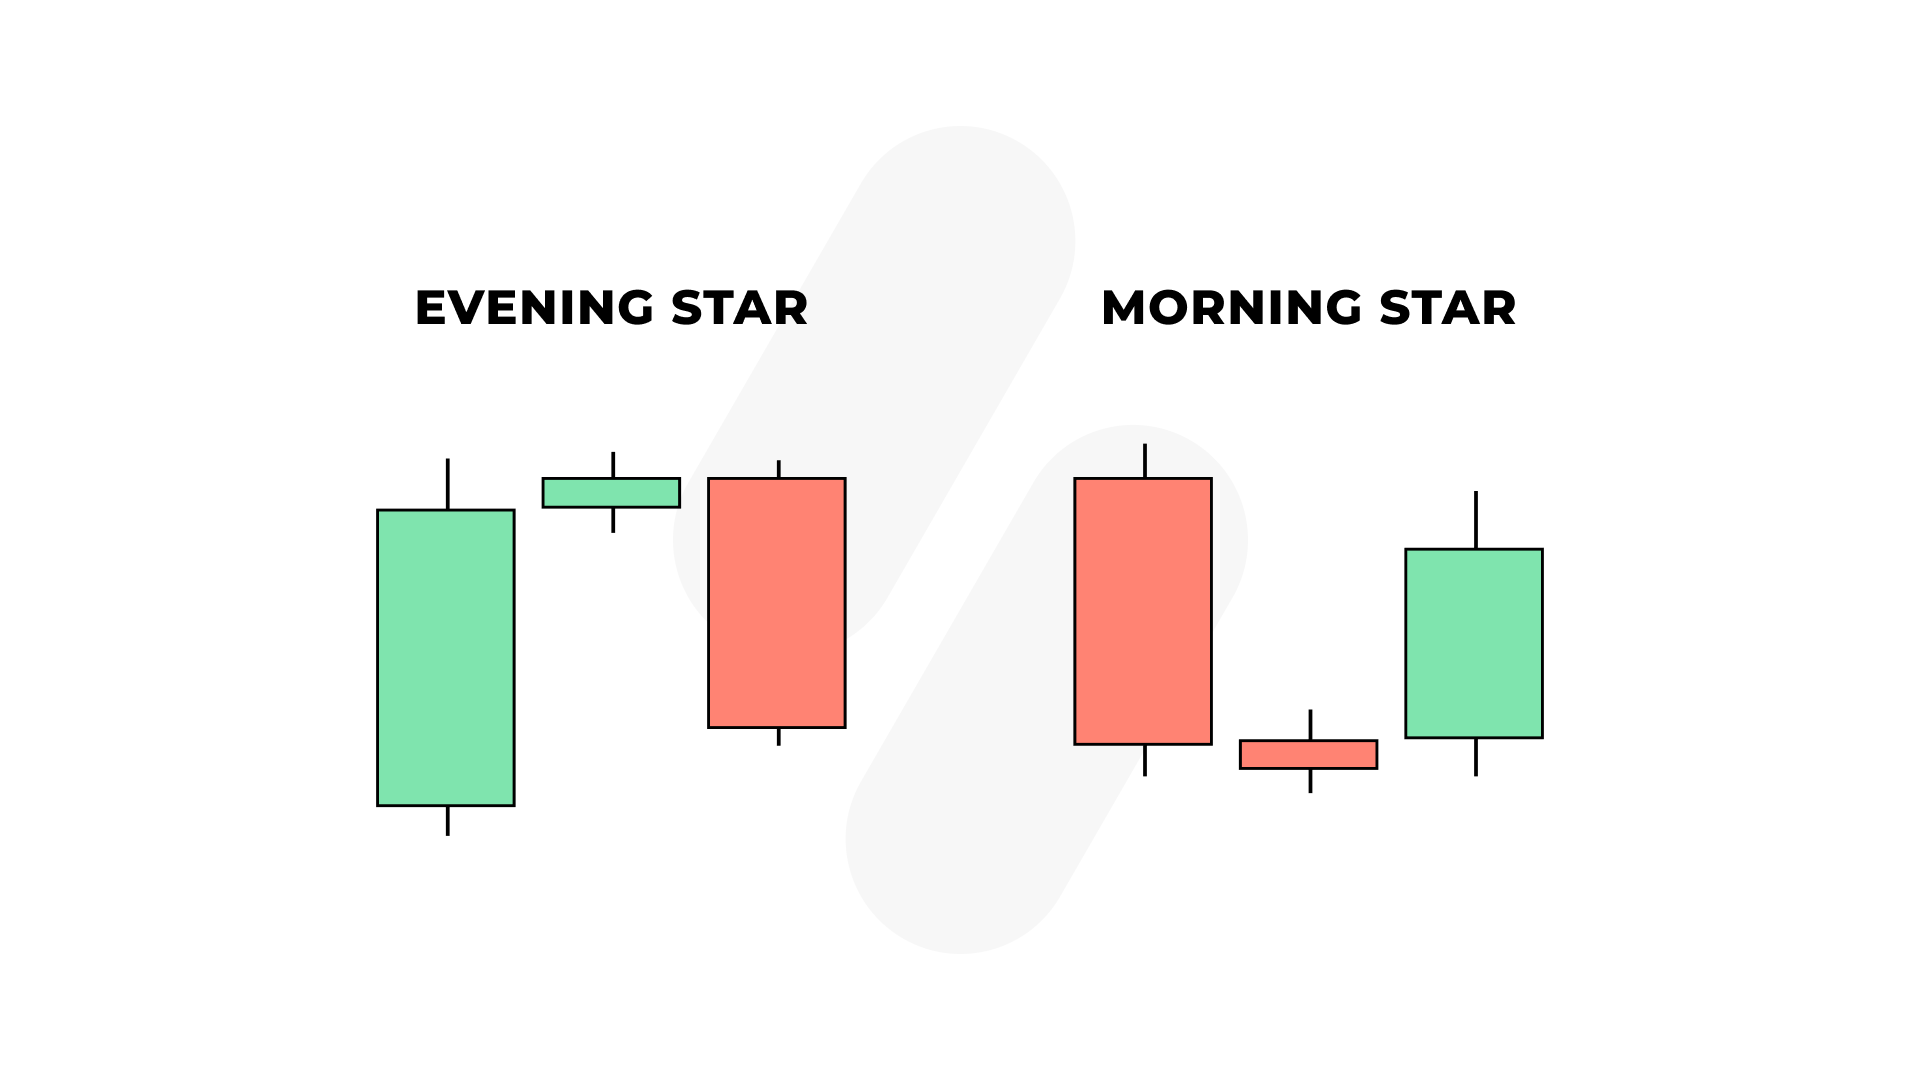
Morning Star
Morning Star candlesticks are visible when there's an upside reversal of bearish signals and trends. This candlestick pattern begins with a bearish candle and a small accompanying bullish or bearish candle. The price then jumps and creates a larger bullish candle.
Evening Star or Abandoned baby
Unlike the Morning Star candlesticks, Evening Stars indicate a downside reversal and occur during bullish trends. It's the direct opposite of morning star candlesticks.
These candlestick patterns can be single as in Doji, double as in engulfing patterns, and triple as in Evening Star.
Essentials tips for trading candlestick patterns
These are essential tips on how to trade candlestick patterns like a professional:
- Size
You can easily determine price trends, momentum, and strength by studying the size of a candlestick. Strong trends usually display larger candles suddenly, while small candles depict a trend’s end or a reversal. So, be sure always to study candle size.
- Location
Location matters a great deal when trading candlesticks. A good rule of thumb is to trade candlesticks only at prime price levels.
- Context
When trading candlesticks, it’s essential to always focus on the context. You must never forget to evaluate the most recent price movement compared to the present candlestick.
- Body
Always interpret the body in relation to the size and wicks. An indecisive candlestick will typically have large wicks and a small body, while long wicks and large bodies indicate numerous trading activities and high volatility. If the candlestick has a small body and no wicks, that’s a no-interest indication.
Summary
Candlestick patterns are essential trading concepts you must know to get ahead in trading. With these tips above, you can use candlesticks like an expert.
Now you know so much about candlestick patterns. Come to the platform and start trading!