Free Pifagoras indicators
December 19, 2021July 10, 2023
How to add any indicator to yourself in tradingview
All these indicators are a lot of work and they are free for you.
We do not have donations, but if you want to thank us, you can register via our link on the Bybit exchange and get up to $3,500 bonus to your account. The guys send all the money earned through the referral program to charity, you can see video reports here .
1. BIG GUY
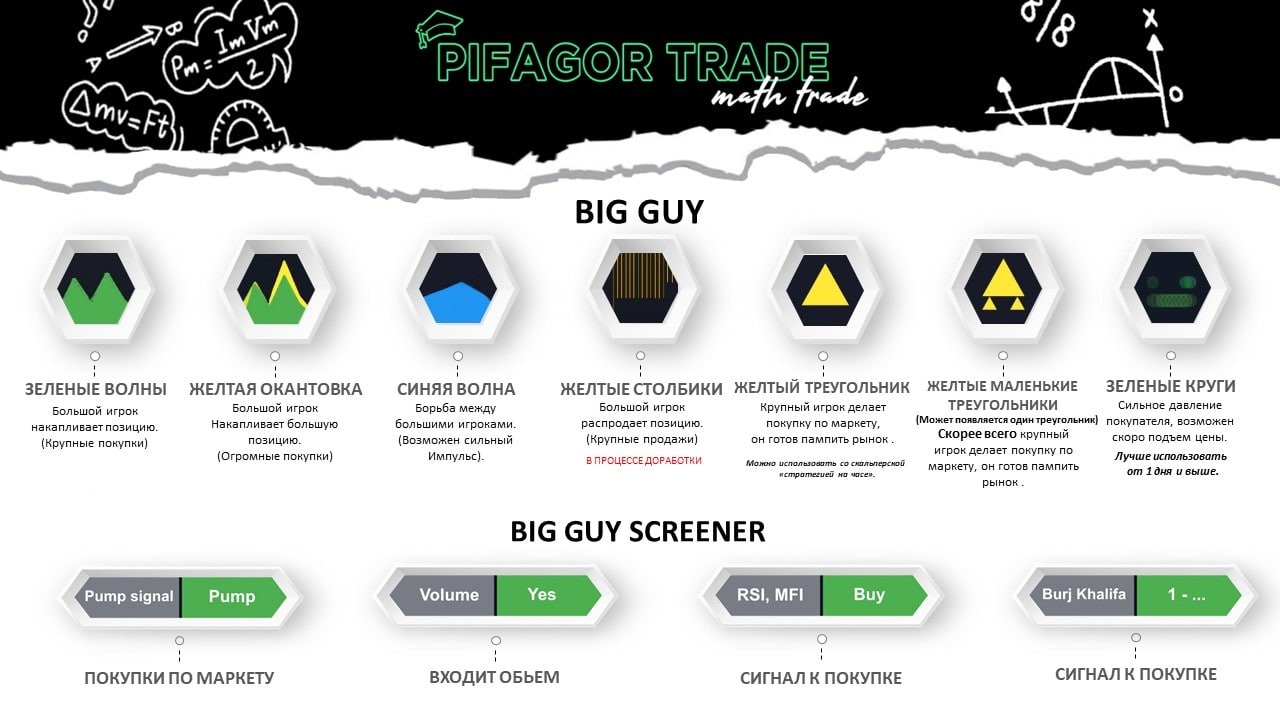


The indicator can be used on any coin. Shows whether a major player buys an asset, also has many add-ons. Suitable for positional and scalping trading.
How to scalp with this indicator
Find an exit point with "big guy"
2. MFI Pifagor

The indicator includes the idea of cash flows, but with many of our observations and additions. You can use it on any asset and timeframe.
3 Opportunity
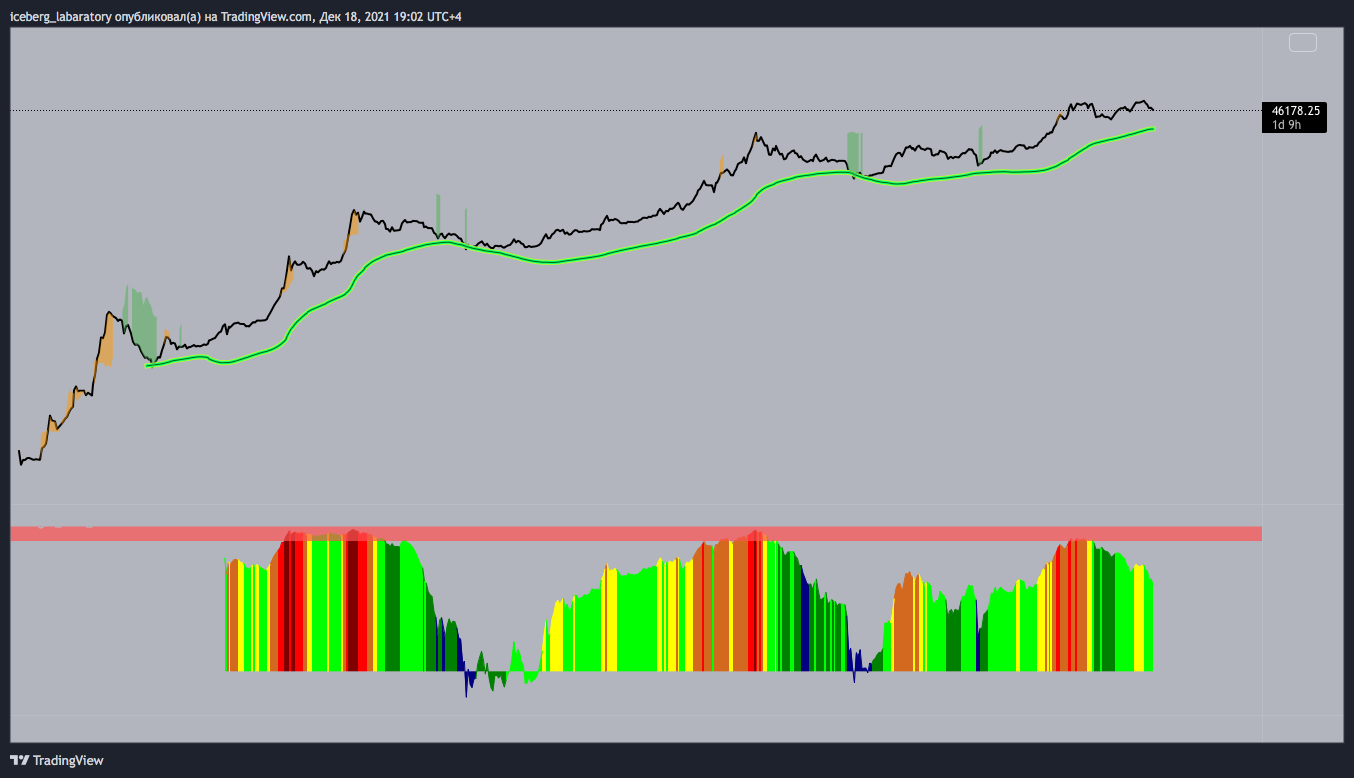
For any investor, the most important thing is to buy when the price of an asset (price) is below its value (value) and when the market is experiencing extreme fear. On this indicator, we show, according to the formula we created, where is the current value of the asset (green line). The green background also marks the places where a large player buys, and small speculators sell in a panic. Orange, on the contrary, places where a large player sells, and small speculators and the crowd eagerly buy. Below is a bar graph showing the current psychological state of the crowd. From extreme fear to euphoria. Applies to BTC only.
4. Radar (4h)

This indicator is suitable for all beginners for safe trading without leverage, if you still do not have a trading strategy and you act at random (it is free for everyone on the channel). Works with any altcoin on any timeframe, including 12 hours and a day. Combines well with alts, big guy, MFI. It tends to work out better/worse on different pairs (see working out on history).
5. Seven Days

The indicator was created for trading in the BTCUSD pair on the 1 week timeframe.
6. Risk Metric (Benjamin Cowen)

7. What are people in
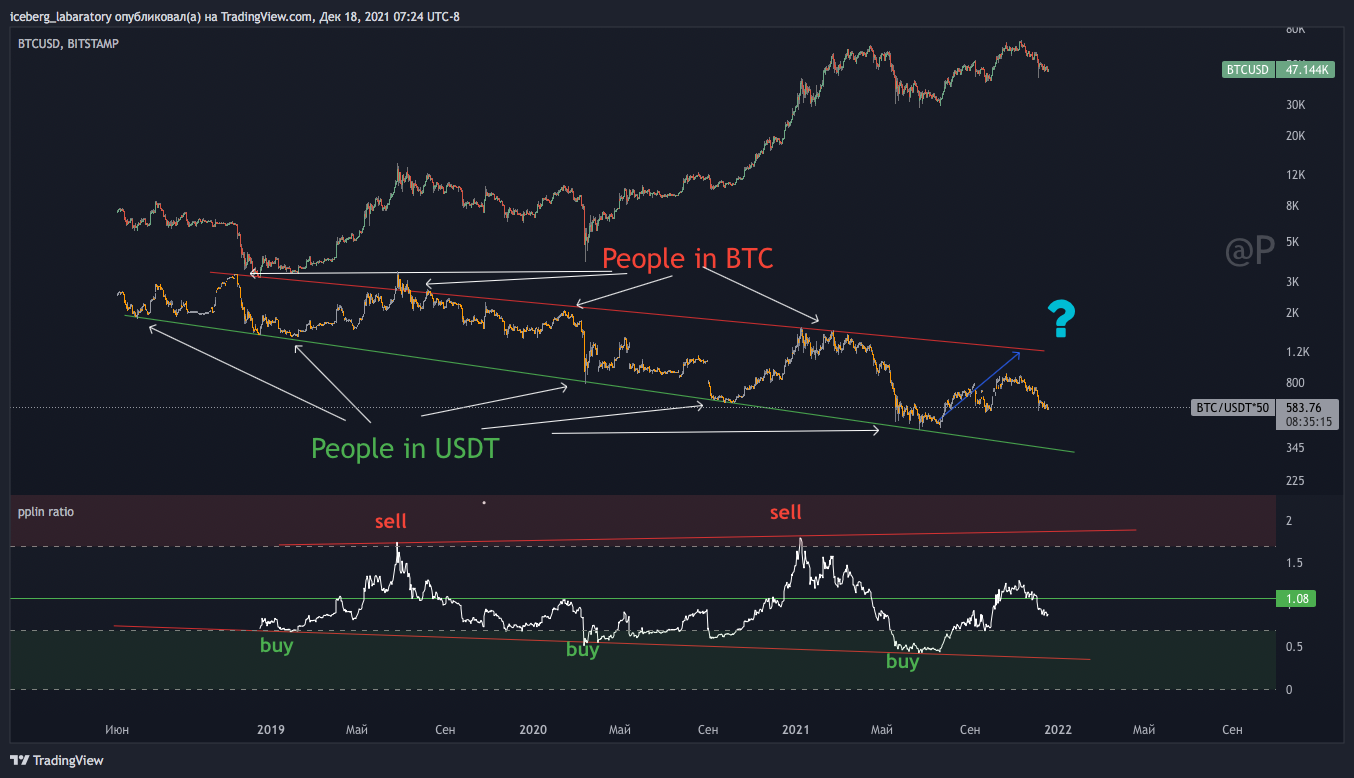
A metric that calculates where people are. Dollar dominance (buying) = up, bitcoin dominance = down (selling). Be sure to check out the example. There is also an oscillator showing the climax.
8. BTC MOOD

The indicator shows the mood of the crowd in BTC and displays it as a specific color on the chart. Apply only to BLX 1 day!
9. Bottom indicators
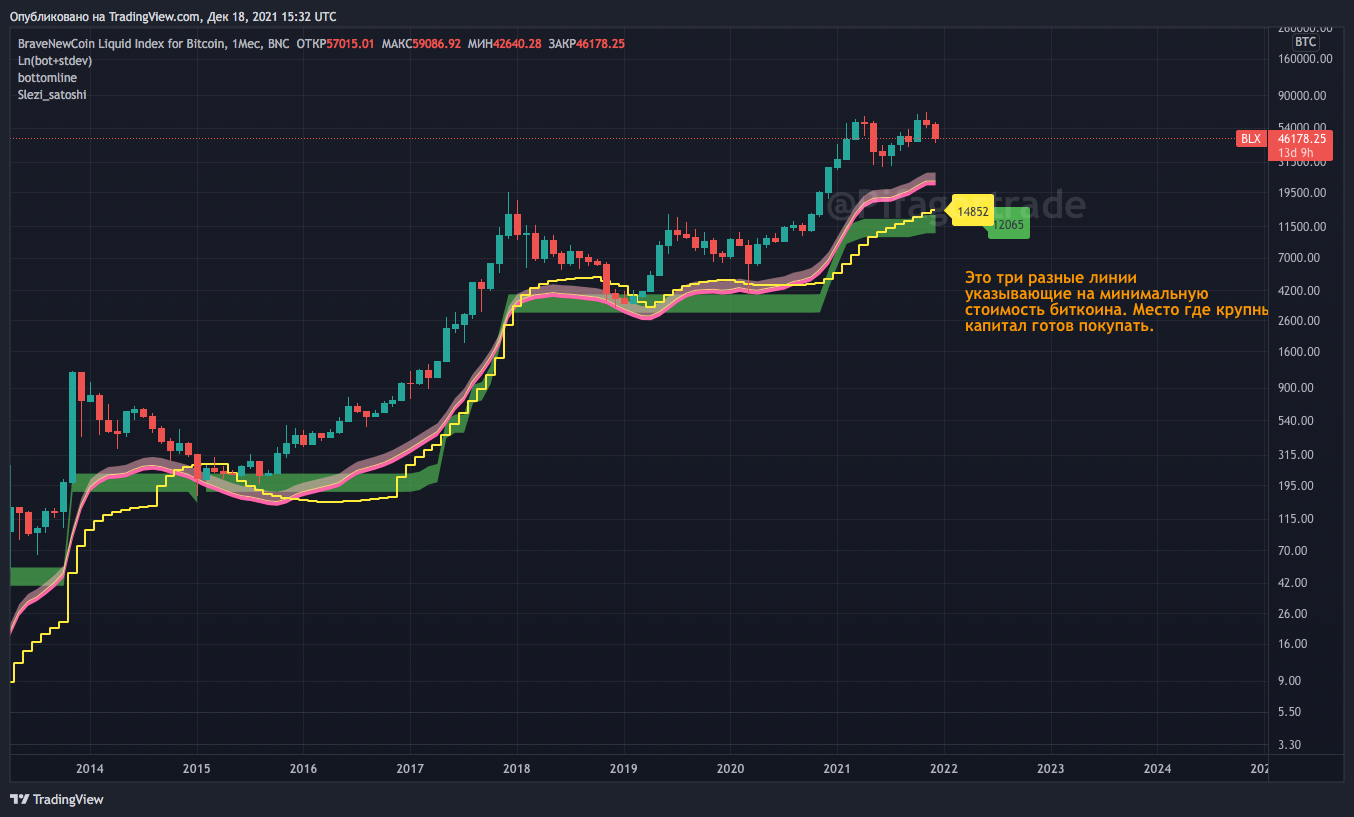
Three indicators on the BLX ticker, which, together with increased accuracy, can show the lowest price for bitcoin. Why so many indicators? We do not know which formula is more accurate.
10. Profit/loss(sopr)

The indicator shows based on data from the blockchain (unspent UTXO inputs), ie when people sell at a loss, when in a plus. Selling at a loss - capitulations, which means possible good entry points.
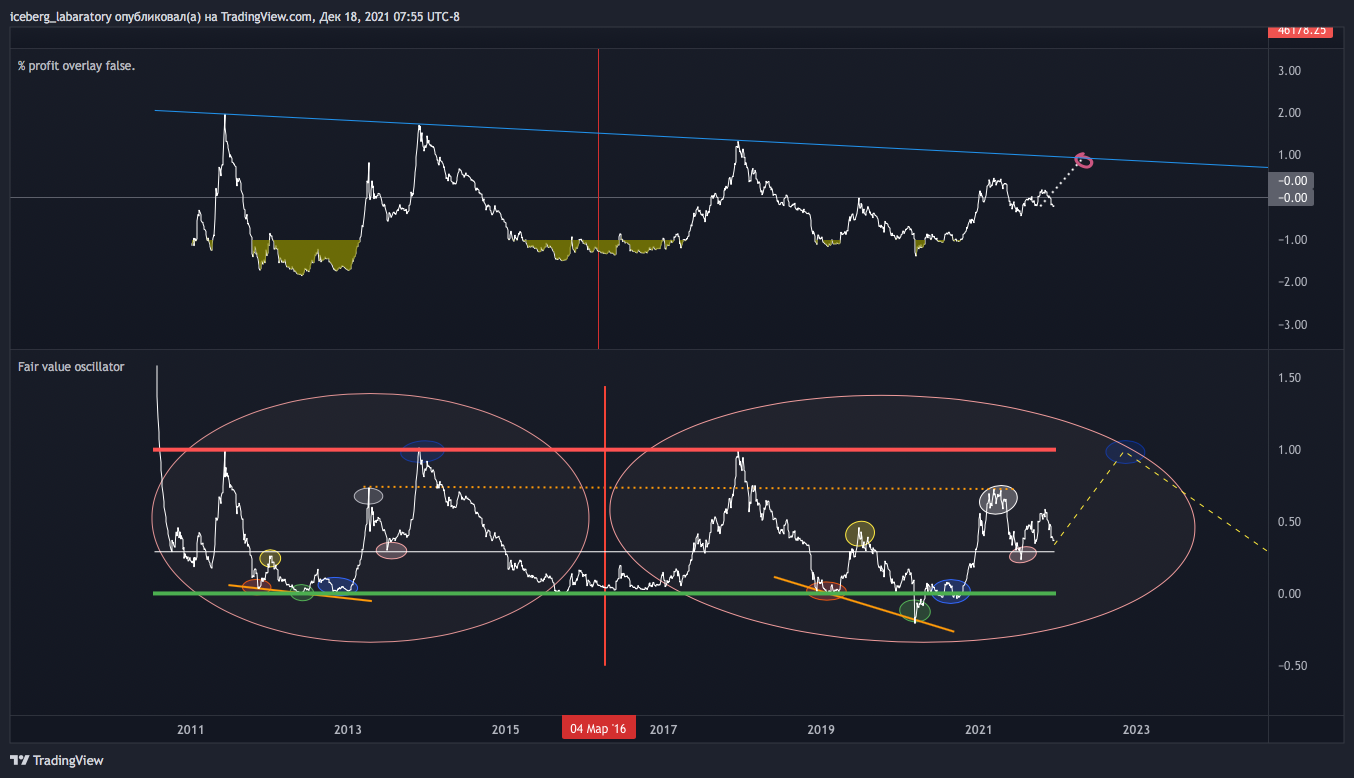
11. Logarithms of the price per transaction

An indicator that will help sell / buy back BTC depending on the risk metric. + Touching the lower trend line is buying, the upper one is selling.
12. Technical variant of realized price (Thermocap)

The indicator shows a good price to buy BTC in the long term. The Realized price is an indicator that is calculated based on the realized capitalization. That, in turn, differs from market capitalization in that it is considered as the sum of the values of each coin at the time of its last transfer from one crypto wallet to another. This indicator allows you to estimate the value of coins in circulation, excluding coins on inactive wallets.
13. Pi Cycle for BTC (modified)

The indicator was able to accurately determine the top of the market for BTC several times, was originally developed by Philip Swift, after which it was finalized by our team (buy zones appeared and sell zones for XRP were finalized).
-
For XRP:
14. Forever Cap By Willy Wu

The indicator was developed by Willy Wu. It shows the market capitalization for the entire history multiplied by 35, which was previously the peak of the market. There are also bottom and middle values.
15. Global RSI + Global Fibonacci


The global RSI shows where the big money is buying. Global Fibonacci levels show BTC targets per cycle.
16. Log Price/Fair Price (Benjamin Cowan)
The logarithm of the price divided by the fair (average) value. Explanation in example work.
17. Chart of BTC levels in grams of gold

Measures BTC relative to gold. Sometimes it works with surgical precision.
18. Div indicator
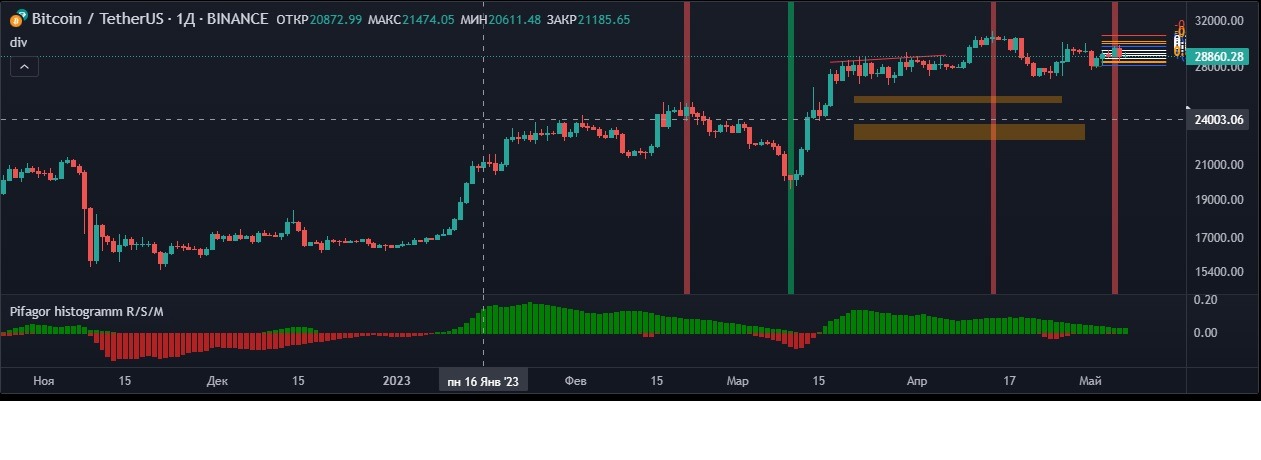
Created relatively recently. Testing was carried out on timeframes: 1h, 1d, 4h, 12h. Proven performance on the BTC/USDT pair
19. Negative Funding and Price Reaction

This is not ours, but a very useful indicator. Funding reflects the "money" mood of the crowd and the predominance of one or another mass (longists / shortists).
20. NVS

This is a modified NVT indicator.
NVT = capitalization/network activity (number of transactions). We improved the formula, taking into account some other parameters. Divergences mean that small players have a lot of faith in growth, and large players are presumably selling their holdings to them.
21. DCA Pifagor 3.1

It is based on 15 of the strongest on-chain glassnode indicators.
Allows you to buy on average to the price closest to the bottom. Bitcoin, Ethereum and Alts.
For example, when you enter a market with a one-time investment, you risk buying "highs" only to see the price drop and end up with a losing position.
However, if you split your lump sum to invest in smaller chunks, you can buy the asset at different points in time at different prices, thereby getting a better average price for your position, and thus greatly reducing the risks from local price movements.
22. Money waterfall

On-chain indicator showing purchases and sales by major players. Reflects the climax of buying and selling, often meaning a bottom and a peak.
23. Trap Line
This is the average purchase price of small players.

It is usually a strong resistance in a bear market, and in a bull market it is a support move.
DISCLAIMER
None of the indicators is a financial advisor that works with a 100% guarantee. These are just mathematical models and patterns based on certain metrics (be it history, on-chain transactions, or anything else) that have shown their performance on history.
Remember that no one knows the future in the market, we only have the past and by analyzing it we can find certain patterns.
Your main asset is the brains with which you have earned your capital and with which you can increase it.
You are solely responsible for the trades you open. And only through personal responsibility lies the way to increase capital.