Dissecting Stability Killer AI
EA Audit
С чего все началось
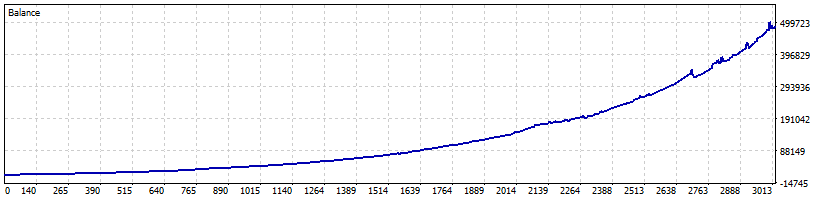
На главной странице MQL5 Market есть советник под названием "Stability Killer AI" — сдержанная обложка на тему стабильности, кривая эквити, идущая строго вверх, цена $399, 4,3 из 5 на основании 144 отзывов. В описании уверенно говорится об «интеграции с реальным машинным обучением через ONNX Runtime», «градиентном бустинге XGBoost», «автоматическом выявлении неблагоприятных условий" и — трижды в разных формулировках — о том, что система "НЕ использует мартингейл или сеточные стратегии".
10 активаций, поставщик BLODSALGO LIMITED (Кипр), пользователь manolotrader, средний рейтинг 4,3. Разработчик пишет: «Стабильность важнее хаоса» и «Механизм долгосрочного накопления капитала».
Я могу получить доступ к исходному коду советника и посмотреть, что там внутри. Когда в описании одного продукта сразу четыре громких заявления — «настоящий искусственный интеллект», «без мартингейла», «без сетки», «автоматическая защита от неблагоприятных условий», — это слишком многообещающе, чтобы пройти мимо.
So I opened up the binary.
Before we dive in — what kind of product is this
Open the EA's Market page and check the basic facts:
Параметр | Значение
---------------+-------------------------------------------
Название | Stability Killer AI
Версия | **1.17**
Дата публикации | **25 января 2026**
Последнее обновление | **6 мая 2026**
Разработчик | BLODSALGO LIMITED (Кипр), `manolotrader`
Цена | **$399**
Рейтинг | 5 / 5 (144 отзыва)
Активаций | 10
Указанный профиль | AUDCAD, H1, возврат к среднему + ML
Рейтинг 4,3 на основе 144 отзывов — это уже сформированный уровень социального доказательства: 144 человека увидели обложку, прочитали описание XGBoost и поставили оценку, не имея перед глазами исходного кода.
В Strategy Tester советник предоставляет 20 настраиваемых параметров:
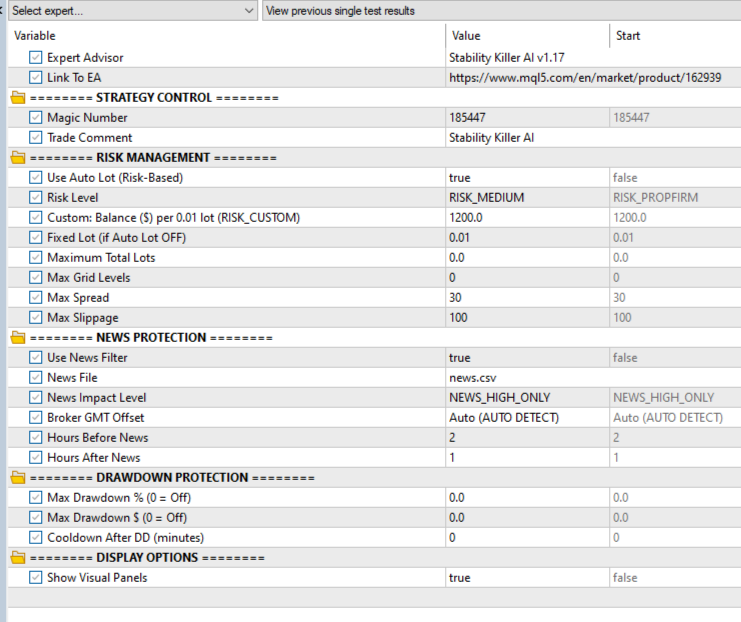
Несколько строк, к которым мы еще вернемся:
Max Grid Levels = 0Maximum Total Lots = 0.0Max Drawdown % = 0.0Max Drawdown $ = 0.0
Запомни это.
Недостаток №1. «Не использует мартингейл или сетку» — но в интерфейсе есть «максимальные уровни сетки»
Формулировка на странице «Рынок» предельно ясна:
"No Risky Methods: Explicitly states the system does NOT use martingale or grid strategies"
The seller explicitly promises the buyer two things: no martingale and no grid. This is the anchor of the whole marketing pitch — without it, a $399 EA would be no different from any martingale EA on MQL5 Market at $50.
Now back to the Inputs screenshot above:
Parameter in the EA's own UI | Default
-----------------------------+----------------------
**Max Grid Levels**          | 0 *(0 = unlimited)*
Maximum Total Lots           | 0.0 *(0 = unlimited)*
"Max Grid Levels". The developer himself, in English, in the UI of his own product, called this parameter "Grid Levels" — i.e. "grid levels". And set it to 0 = unlimited depth by default.
If the strategy doesn't use a grid — why is there a "max grid depth" setting at all? If the parameter defaults to 0 (unlimited) — that means out of the box every buyer is trading with a grid that can grow to any depth.
This is item one in the list, and it's the simplest. No need to look at code, no need to run the tester. Just compare the Market page with the EA's settings in Strategy Tester — 30 seconds of work:
What the description says              | What the EA's UI shows
---------------------------------------+------------------------------------------------------
"No martingale"                        | `Max Grid Levels = 0` (no depth limit)
"No grid"                              | `Maximum Total Lots = 0.0` (no total volume limit)
"consistency over chaos"               | `Max Drawdown % = 0.0` (drawdown protection disabled)
"long-term capital compounding engine" | `Max Drawdown $ = 0.0` (also disabled)
144 buyers didn't do this — otherwise the average rating wouldn't be 4.3.
And to leave no room for the argument "maybe the name is incidental and there's no grid in there", let's look at how the EA actually behaves in Strategy Tester. Here's a fragment of the Journal from a regular run on default parameters (the last deals before the test closed):
2020.06.01 00:02:00   deal #384 buy 1.68 AUDCAD ...
2020.06.01 00:02:00   deal #385 buy 1.20 AUDCAD ...
2020.06.01 00:02:00   deal #386 buy 0.72 AUDCAD ...
2020.06.01 00:02:00   deal #387 buy 0.24 AUDCAD ...
This is one basket of four positions, opened in the same direction (buy), on the same instrument, with growing lots 0.24 → 0.72 → 1.20 → 1.68 — multiples of ×3, ×5, ×7 over the base. No single-entry mean-reversion strategy at work here — this is a classic martingale grid in action.
If you've seen enough from this single point — you can close the article and go check the other EAs on your shortlist. This would already be sufficient.
What follows is the detail: what exact lot progression is hardcoded in the binary, what's actually inside the "real AI", and why the vendor's backtest shows a flat equity curve while real trading after the release will behave very differently.
Flaw #2. "Real ML / XGBoost / ONNX" — the badge is there, but the engine isn't wired up
The headline promise in the description isn't "mean-reversion" — it's AI. Said five times in different phrasing:
"Real Machine Learning Integration" "Genuine XGBoost Gradient Boosting model via ONNX Runtime" "Real-Time Probability Scoring with continuous market condition evaluation" "Automatic Bad Conditions Detection" "Proprietary Features analyzing price action, volatility regimes, and session dynamics"
When the EA starts in the tester, the Journal does show a plausible ONNX initialization message:
2019.01.01 00:00:00   api version 1.24.4 initialized
2019.01.01 00:00:00   ONNX: CPU selected
2019.01.01 00:00:00   AI Module v2.1.0 ready
2019.01.01 00:00:00   Stability Killer AI initialized
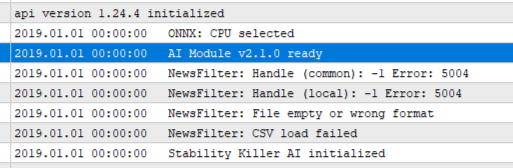
The message is real, the ONNX runtime is initialized, the model is loaded. And there really is an ML model inside the .ex5 — you can see it in the strings:
BLODSALGO LIMITED          <- vendor signature
StabilityKillerMLZ         <- embedded resource name with the model
TreeEnsembleRegressor      <- node type from the standard ONNX ML spec
ai.onnx.ml                 <- ONNX ML namespace marker
The embedded model is 839 bytes. For reference, real production XGBoost models for market prediction start at tens of kilobytes.
And here is where it gets interesting. I went through every ONNX API call in the EA's code. The full table is short:
Action                                  | Where                    | Calls
--------------------------+--------------------------+------
Create session            | `OnInit`, at load time   | 1
Set input shape           | same place               | 1
Set output shape          | same place               | 1
Release session           | `OnDeinit` + error paths | 4
**Run inference           | **nowhere**              | 0
That's everything the code does with the model: it loads it, declares input and output shapes, sets the "ready" flag, prints to the Journal — and never runs it once. The model just sits in memory until the EA shuts down.
The model handle is stored in a variable. No trading function ever references it. Entry and exit decisions are made by a completely different mechanism — with no involvement of this model.
Analogy: a car is sold as a "hybrid", in the engine bay there really is an electric motor, the dashboard lights up "Hybrid ready". But no wires run to either the gearbox or the wheels. The car only drives on the gasoline engine. The electric motor is for the indicator and for the marketing.
Same thing here: loading ONNX is for the "AI Module v2.1.0 ready" line in the Journal and for the marketing banner on the Market page. Real decisions are made by completely different code.
What if the EA actually called OnnxRun?
The suspicion can be taken all the way: extract the model from the binary (it's 839 bytes), save it as a regular .onnx file, and run it through standard onnxruntime in Python — exactly what the EA would technically do if it called inference.
The model's structure is standard ML: input market_features of shape [1, 10] (ten float features), output ai_prediction of shape [1, 3] (three probabilities, e.g. "BUY / HOLD / SELL"), operator TreeEnsembleRegressor from ai.onnx.ml (standard tree-ensemble classifier).
Feed in 12 different test vectors: zeros, ones, negatives, extremes, random, realistic "bid-like" prices, a simulated price shock. See what the model returns:
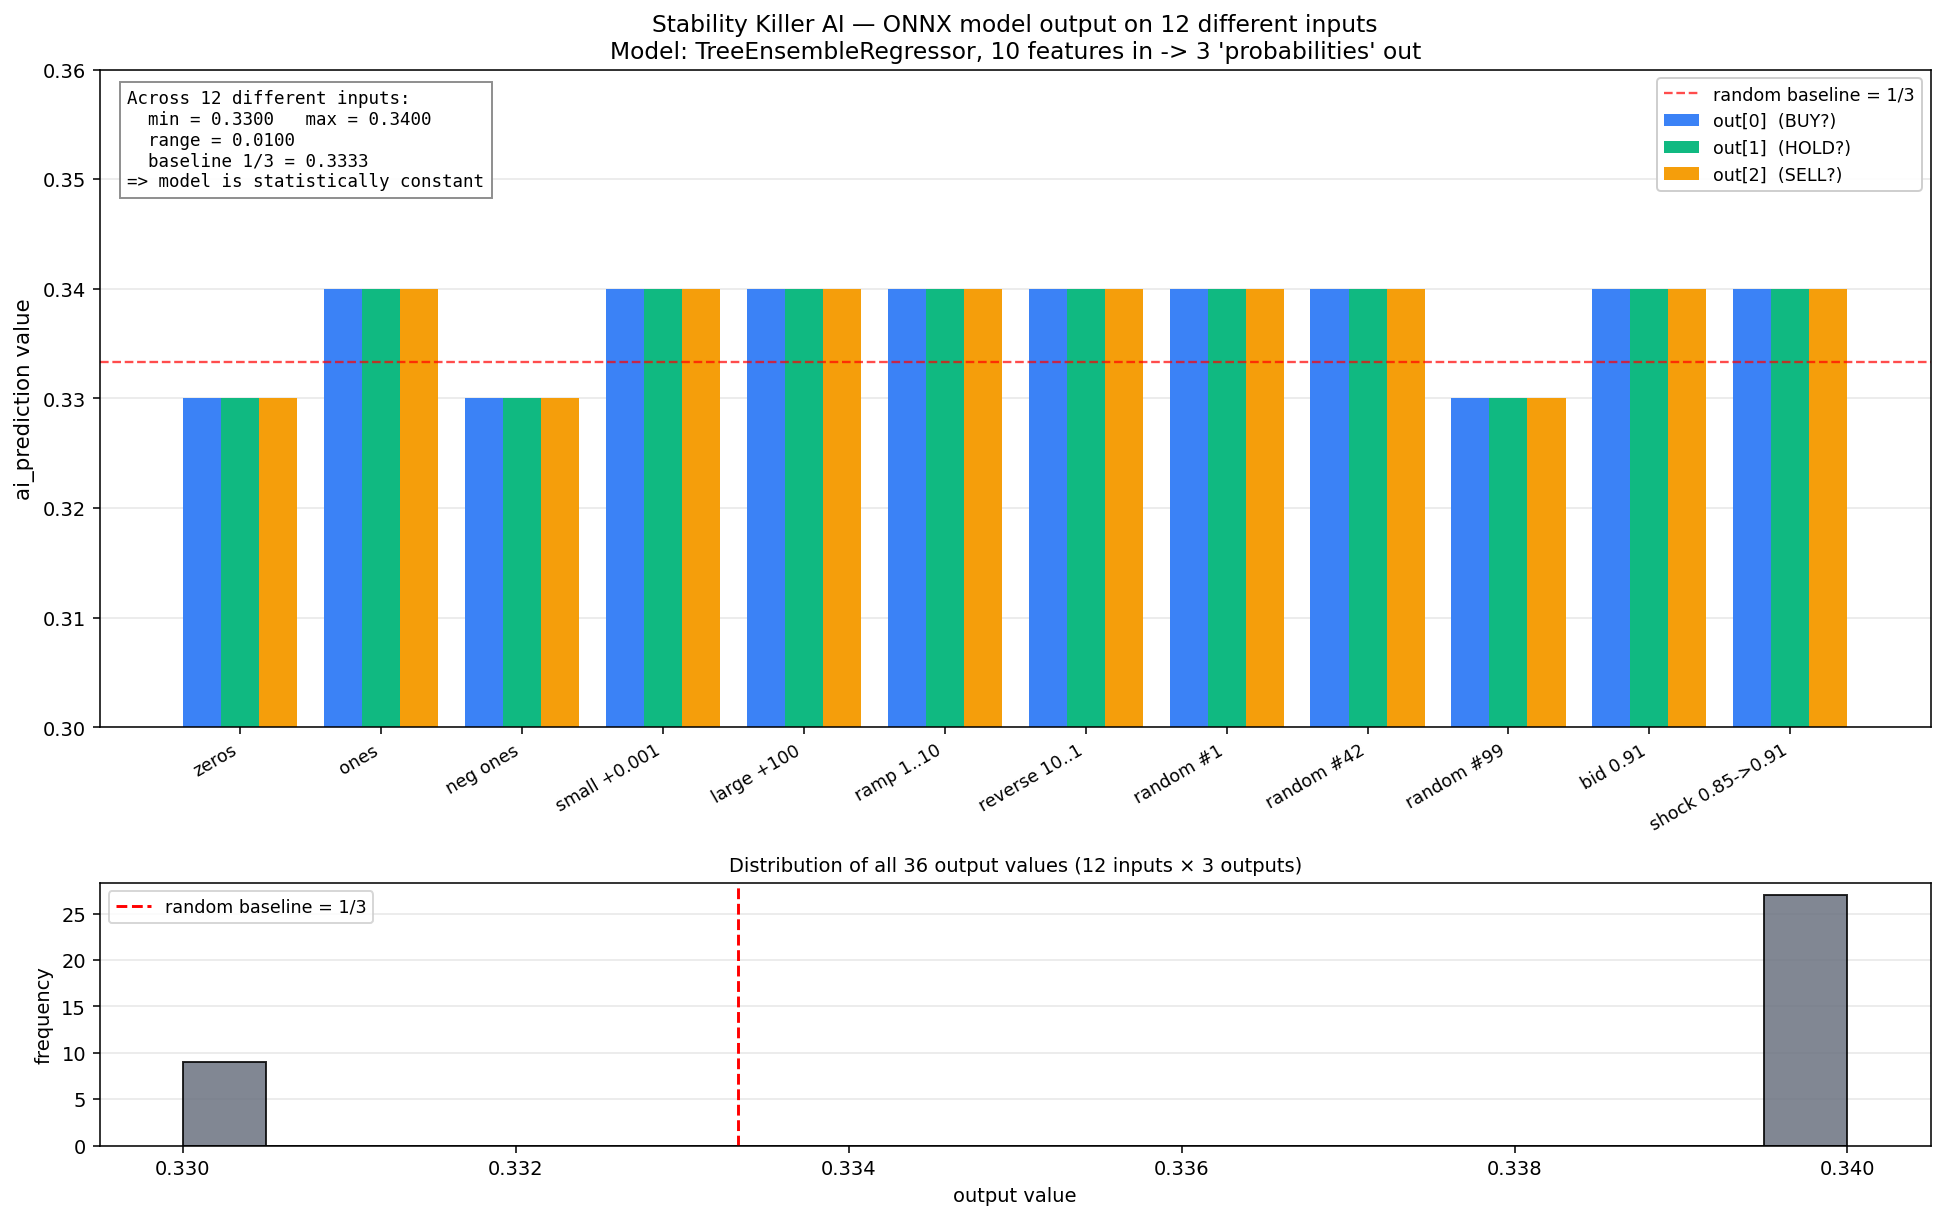
input 'zeros'                  -> ai_prediction = [0.330, 0.330, 0.330]
input 'ones'                   -> ai_prediction = [0.340, 0.340, 0.340]
input 'neg ones'               -> ai_prediction = [0.330, 0.330, 0.330]
input 'small +1e-3'            -> ai_prediction = [0.340, 0.340, 0.340]
input 'large +100'             -> ai_prediction = [0.340, 0.340, 0.340]
input 'ramp 1..10'             -> ai_prediction = [0.340, 0.340, 0.340]
input 'reverse 10..1'          -> ai_prediction = [0.340, 0.340, 0.340]
input 'random seed=1'          -> ai_prediction = [0.340, 0.340, 0.340]
input 'random seed=42'         -> ai_prediction = [0.340, 0.340, 0.340]
input 'random seed=99'         -> ai_prediction = [0.330, 0.330, 0.330]
input 'realistic bid-ish'      -> ai_prediction = [0.340, 0.340, 0.340]
input 'realistic shock'        -> ai_prediction = [0.340, 0.340, 0.340]
Two observations:
- All three output values within each vector are identical. If the model actually classified "BUY / HOLD / SELL", these three numbers would differ (class probabilities). Here they're always equal to each other — i.e. the model does not discriminate between classes.
- On any input the output oscillates between 0.33 and 0.34. Full output range across all 12 tests is 0.01.
1/3 ≈ 0.333— that is exactly the random baseline for three classes. The model carries no useful information on any input.
So even if someone were to add the missing OnnxRun(...) call to Stability Killer AI's code — the output would be the same useless "0.33-0.34, 0.33-0.34, 0.33-0.34" under any market conditions. A trading signal cannot physically be extracted from this model — it was trained on something that makes it always return near-constant.
This closes the last possible counter-argument like "maybe the model is cached and used somewhere else". The model is useless by construction. Its role is to sit inside .ex5 to make the "AI Module v2.1.0 ready" line appear in the Journal and to back the marketing pitch on the page.
What code actually makes trading decisions — that's the next flaw.
Flaw #3. "Real-Time Probability Scoring" — actually one signal indicator on H1
From the description:
"Proprietary Features analyzing price action, volatility regimes, and session dynamics…" "Real-Time Probability Scoring with continuous market condition evaluation"
The implicit promise: an AI engine combines signals from several sources. Inside the .ex5 the APIs of four well-known indicators are indeed called: Bollinger Bands, Stochastic, ADX, Moving Average. Sounds like a normal multi-indicator filter.
But if you look at where these indicators are used in the code, the picture is this:
Indicator                             | Where it's called                       | What it does
--------------------------------------+-----------------------------------------+-------------------------------------
**one signal indicator on PERIOD_H1** | in the entry function                   | **decides whether to open BUY/SELL**
iBands                                | in 8 functions that render the UI panel | fills numbers on the dashboard
iStochastic                           | same panel functions + OnTimer          | fills numbers on the dashboard
iADX                                  | same panel functions                    | fills numbers on the dashboard
iMA                                   | OnInit + UI functions                   | fills numbers on the dashboard
Of the four advertised indicators — none participate in trading decisions. All four are only needed to pour a value into a graphical object — to render the "Stability Killer AI Dashboard" panel in the chart corner.
The entry decision is taken from one indicator handle on H1 with two buffers read (upper / lower band). The condition is literally:
if bid <= lower band (H1)  ->  buy
if upper band (H1) <= ask  ->  sell
This is a mean-reversion entry at a channel boundary — a strategy from a late-1980s technical-analysis textbook. All parameters of this indicator (period, deviation, MA method, applied price) are hardcoded inside .ex5, they are not in Inputs.
Indirect confirmation via Inputs
Back to the Inputs screenshot at the top of the article. There are 20 parameters — magic number, default lot, news filter, drawdown size, panel colors. Not a single parameter of the strategy itself — no indicator period, no deviation, no MA type. These values are hardcoded and inaccessible to the buyer.
Any sane mean-reversion EA — even a free one from a textbook — exposes those 3-4 parameters in Inputs, because without them you can't adapt the strategy to a different pair or timeframe. Here they're hidden. Which means a simple thing: the buyer cannot change the trading logic, only switch the hardcoded setup on or off.
What this means for the buyer
The marketing promises "4 indicators + AI + Real-Time Probability Scoring". That's four layers of promised filter complexity.
In the code:
- AI / ML — model loads but never runs (flaw #2)
- 4 indicators — present, but only in the decorative panel on the chart
- Probability Scoring — replaced by a simple
bid <= lower / upper <= askcheck on one indicator
This is a plain channel mean-reversion entry, wrapped in marketing about XGBoost and multi-indicator fusion. Technically: a class of EAs from the 1990s with 2020s labels stuck on.
Flaw #4. The martingale grid — internal mechanics
In flaw #1 we already saw in the Journal a chain buy 0.24 → 0.72 → 1.20 → 1.68 — the last deals of one basket. Now — how this is built internally.
Lot progression
The EA's code contains an array of 10 values (taken from the binary in IEEE 754 hex and converted to double):
1.0     (level 1)
1.0     (level 2)
2.0     (level 3)
3.0     (level 4)
4.0     (level 5)
5.0     (level 6)
6.0     (level 7)
7.0     (level 8)
8.0     (level 9)
9.0     (level 10)
A table of {1, 1, 2, 3, 4, 5, 6, 7, 8, 9}. Used inside the lot-sizing function as:
lot = base_lot × table[basket level]
That is: the first deal is the base lot, the second is the same, the third is ×2, the fourth is ×3, and so on up to ×9 at level 10. After level 10 the multiplier is "frozen" at 9.
Grid step and basket close
Inside the grid-add function:
If price moved against the basket by >= 200 points from the LAST entry
   -> open one more deal in the same direction, lot from the table above
Inside the basket management (in OnTick):
If the volume-weighted average price (VWAP) recovered by +200 points
   -> close the ENTIRE basket in one shot
This is the classic definition of a martingale grid from any money-management textbook.
Default safety brakes — none
Back to the Inputs screenshot from the start of the article:
Parameter              | Default | Meaning
-----------------------+---------+-----------------------------
**Max Grid Levels**    | 0       | no depth limit
**Maximum Total Lots** | 0.0     | no total basket volume limit
**Max Drawdown %**     | 0.0     | drawdown protection disabled
**Max Drawdown $**     | 0.0     | also disabled
**Cooldown After DD**  | 0       | no pause after losses
So out of the box the grid can grow to any depth until margin runs out. No safety mechanisms are enabled by default.
Confirmation — a real basket from the tester
From the log of one of the runs let's extract the deepest basket — its full life cycle from first entry to close:
SELL basket, 12 levels, lasted from 2020-05-19 03:34 to 2020-06-01 00:02 (~12 days)
cumulative volume: 13.21 lots

  L 1  19.05  03:34   vol=0.24   price=0.86122    <- base lot
  L 2  19.05  13:17   vol=0.24   price=0.86325    <- ×1 (as in table)
  L 3  19.05  14:25   vol=0.48   price=0.86550    <- ×2
  L 4  20.05  01:02   vol=0.72   price=0.87401    <- ×3
  L 5  20.05  15:36   vol=0.96   price=0.87679    <- ×4
  L 6  20.05  15:56   vol=1.20   price=0.87913    <- ×5
  L 7  21.05  08:00   vol=1.44   price=0.89056    <- ×6
  L 8  21.05  18:30   vol=1.68   price=0.89263    <- ×7
  L 9  22.05  15:20   vol=1.92   price=0.89542    <- ×8
  L10  26.05  09:10   vol=2.16   price=0.89846    <- ×9
  L11  26.05  15:30   vol=2.16   price=0.90064    <- ×9 (capped)
  L12  27.05  01:55   vol=0.01   price=0.90913    <- minimum lot

  all closed:
  2020-06-01 00:02  at price 0.91804  (margin call at test end)
Each of the 12 lot values exactly matches the table in the code {1, 1, 2, 3, 4, 5, 6, 7, 8, 9}, multiplied by the base lot of 0.24. At level L11 the multiplier is already "stuck" at 9 (the table doesn't go deeper). At L12 the EA didn't have enough free margin even for a new entry at multiplier 9 — it opened the minimum possible lot of 0.01, after which the price moved another 800+ points against the basket, and the test was force-closed with a final balance of −$304.
Step between entry prices: from 203 to ~850 pt. The base step in the code is 200 pt; the "larger" jumps (L3→L4, L6→L7, L11→L12) are intervals where the price moved against the basket faster, and the EA placed the next entry immediately at the first touch of the 200-pt mark.
Visual confirmation
If you run the tester in visual mode and catch the moment of an unfolded basket, the chart shows several open positions in the same direction at once — each with its own entry price, its own lot, and a shared take-profit level off the VWAP:
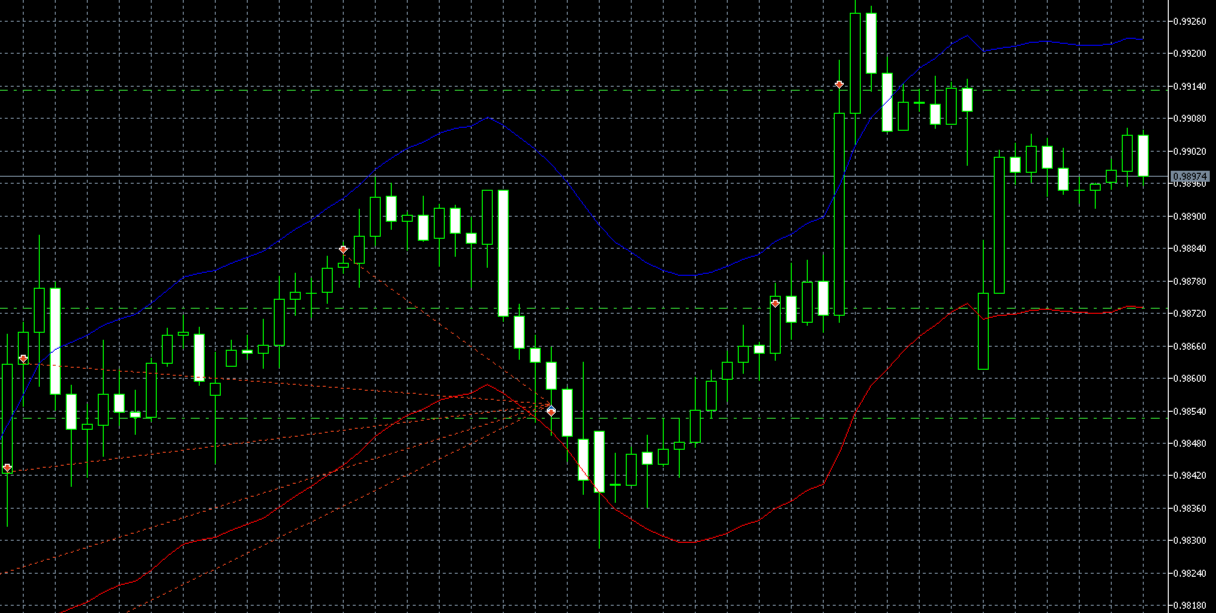
On the screenshot:
- Red dashed lines through the middle of the chart — open prices of positions (multiple levels of the same basket)
- Green dashed horizontal line — common TP (computed from VWAP)
- Markers on the candles — entry points of each new position
What this mechanic does to a $10,000 account
Default lot sizing is "balance-based" (Custom: Balance ($) per 0.01 lot = 1200), which on a $10K account gives a base lot ≈ 0.08. Take a typical AUDCAD pricing (~$0.90 per 0.01 lot for a 100-pt move) and trace how risk grows:
Level  | Lot      | Cumulative volume | Price against VWAP | Current basket loss
-------+----------+-------------------+--------------------+-----------------------------
1      | 0.08     | 0.08              | 0 pt               | $0
2      | 0.08     | 0.16              | -200 pt            | ≈ -$120
3      | 0.16     | 0.32              | -400 pt            | ≈ -$420
4      | 0.24     | 0.56              | -600 pt            | ≈ -$980
5      | 0.32     | 0.88              | -800 pt            | ≈ -$1 820
6      | 0.40     | 1.28              | -1000 pt           | ≈ -$2 980
7      | 0.48     | 1.76              | -1200 pt           | ≈ -$4 540
8      | 0.56     | 2.32              | -1400 pt           | ≈ -$6 540
**9**  | **0.64** | **2.96**          | **-1600 pt**       | **≈ -$9 060**
**10** | **0.72** | **3.68**          | **-1800 pt**       | **≈ -$12 200 → margin call**
A full 10-level basket is only 2000 pt of adverse movement. For AUDCAD H1 that's 5-7 days of trend in one direction (typical range). The real basket from the run above is 1300 pt from L1 to L11 over 7 trading days.
Flaw #5 (the main one). "Automatic Bad Conditions Detection" — a hardcoded list of 175 dates that ends on the release date
Let's take separately one more promise from the page:
"Automatic Bad Conditions Detection: The AI proactively identifies and avoids unfavorable trading situations, protecting your capital during the most critical moments."
Sounds like real protection: AI looks at the market in real time, recognizes "bad" volatility, and stays out at those moments. Any buyer will read it exactly that way.
I found the mechanism in the code that the vendor sells as "AI proactively identifies". It's an array of 175 specific calendar days on which the EA does not open a new basket. There's no AI in there.
What these 175 days are
A decoded summary of the array (the full list — in supplementary materials). The dates fall into very familiar blocks:
Period                            | What happened in the market      | Days in the list
----------------------------------+----------------------------------+-----------------
2020.03.09 – 2020.04.30           | COVID FX crash                   | 35
2020.05 – 2020.12                 | post-COVID tails                 | 21
2021                              | isolated shocks                  | 13
2022.02.12 – 2022.03.25           | Russia-Ukraine, sanctions        | 19
2022.04 – 2022.12                 | inflation shocks, Fed rate cycle | 40
2023.06.15 – 2023.06.23           | the well-known 9-day AUDCAD flat | 9
2024.02.11–13, 07.16–23, 11.11–12 | isolated shocks                  | 13
2025.03.16 – 2025.04.03           | Trump tariff shocks, FX collapse | 13
2025.09                           | isolated shock                   | 4
**2026.01.02, 2026.01.15**        | **last two dates in the list**   | **2**
Each group is a well-known historical FX-market crisis. This isn't "AI recognizes volatility" — these are dates memorized after the fact, exactly the ones where the martingale grid from flaw #4 would have blown up.
The headline — the last date
The last entry in the array is 2026.01.15. Version 1.17 of the EA was published on January 25, 2026 — i.e. the last "protected" date coincides with the approximate build date of the binary.
After 2026.01.15 there is no protection. The list is empty. For any future period the martingale grid runs unblocked.
This is a textbook look-ahead bias from quant-strategy literature: the vendor took data through January 2026, looked for dates where his grid would have ruptured, and hard-wired those dates as "do not trade". Any backtest from 2019 to 2025 now looks flat — because the bad days are cut out. Any real trading after release runs without that cushion.
Confirmation with a "swap-the-days" experiment
You can prove the look-ahead directly: take the original purchased .ex5, the same settings, the same AUDCAD historical data — but swap the OHLCV content of hourly candles between blacklist dates and ordinary dates. The candles stay the same — only the calendar identity of the bars changes.
Then:
- On blacklist days the EA still blocks new entries (timestamps in
.rdatamatch), but the candles now hold calm data — protection is spent for nothing. - On the partner "ordinary" days the EA does not block — but the candles now hold COVID-volatility data. The martingale grid gets a crisis under an "innocent" timestamp.
If the look-ahead is the only mechanism keeping the grid from blowing up, the experiment should produce a completely different test outcome.
What was done. A dump of M1 history for 2020-2026 via the tester → a Python script that swaps OHLCV pairwise between the 175 blacklist dates and 175 calm days (timestamps stay in place) → a Custom Symbol AUDCAD_SWAP created with the swapped bars → the original purchased .ex5, untouched, was run on this symbol with the same defaults.
Result — head-to-head with baseline:
Metric                 | Run #1 (original AUDCAD)            | Run #5 (AUDCAD_SWAP)
-----------------------+-------------------------------------+---------------------------------
Period                 | 2019.01.01 – 2026.05.01             | 2020.01.02 – 2026.05.01
Initial Deposit        | $10 000                             | $10 000
Settings               | default                             | **same default**
Expert                 | original `.ex5`                     | **same original `.ex5`**
Total Net Profit       | **+$476 060** (×47.6 over 7+ years) | **−$10 304** (stop-out)
Profit Factor          | 2.33                                | 0.67
Equity DD Maximal      | 29.85%                              | **101.08%** (account underwater)
Margin Level (min)     | 89.86%                              | **37.90%** (stop-out reached)
Max consecutive losses | 8 trades (-$992)                    | **14 trades (-$28 643)**
Time to blow-up        | —                                   | **~5 months** (6% of test)
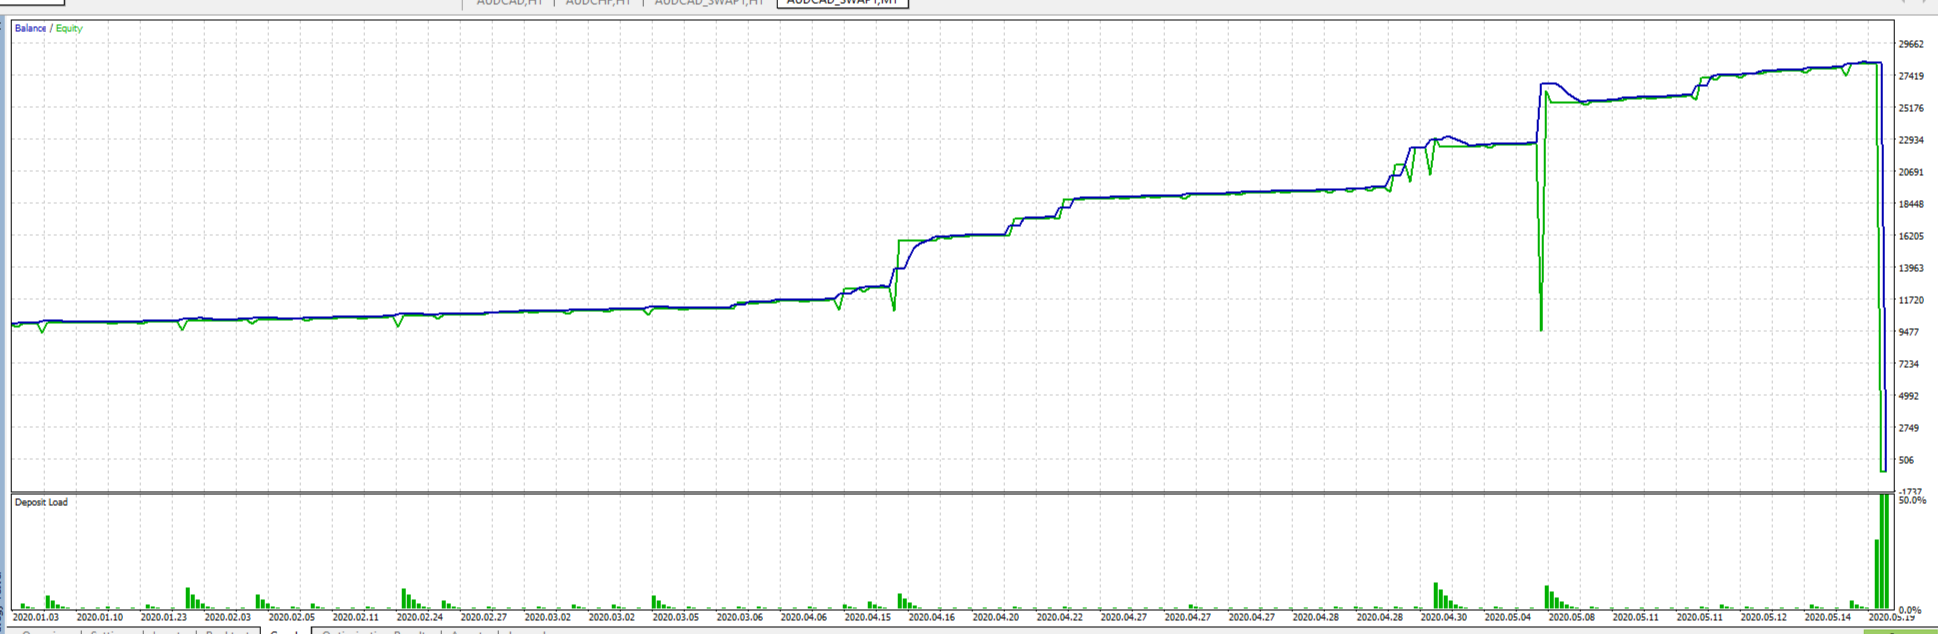
This is the same binary. Same inputs. Same history. Only the calendar identity of part of the days changes — and the strategy goes from "consistency over chaos" to margin call at 6% of the test period.
The experiment closes the obvious counter-arguments:
- "Maybe the EA can recognize the crisis in real time" — no, because under a different timestamp it doesn't;
- "Maybe the blacklist is just bandwidth optimization" — no, because without it the strategy is physically unsustainable;
- "Maybe any mean-reversion system would do the same" — no, because the difference between runs #1 and #5 is not the setup, but exclusively the fact that today's date matches the hardcoded table.
What this means for the buyer
- The vendor's backtest for 2019-2025 shows a smooth equity curve and ~30% DD. That's because the martingale grid did not open during any historical crisis (they're all in the blacklist).
- A buyer attaching the EA to a live account in 2026 is trading a different system — after 2026.01.15 the protection is gone. The first prolonged volatility shock — the basket goes through the grid from flaw #4, the martingale reaches level 9-10, margin call.
This is the main flaw of the EA. Not the AI wrapper, not the Envelope entry, not the lots {1,1,2,3,4,5,6,7,8,9} themselves. The main thing — the vendor's backtest, on which 144 people based their 4.3 rating, is not relevant for projecting real trading with this EA after purchase.
Between backtest and reality — a table of 175 numbers in .rdata. The buyer doesn't see this table, and after 2026.01.15 it is empty.
So what do you get for $399
Let's collect all the findings in one list:
- "No martingale, no grid" in the description vs
Max Grid Levelsin the EA's own UI. The Inputs literally show a parameter "Max Grid Levels = 0" (no limit) — while the marketing text separately promises "does NOT use grid". The Journal of the tester shows a classic gridbuy 0.24 → 0.72 → 1.20 → 1.68on default parameters. - "Real ML / XGBoost via ONNX" — the model is loaded but never run. Among 150 functions in the code — not a single
OnnxRuncall. The Journal does show "AI Module v2.1.0 ready", but the model handle is referenced nowhere else. The model extracted from the binary, fed 12 different inputs, returns a constant of around1/3on all three outputs — i.e. useless by construction. - "Real-Time Probability Scoring" from 4 indicators — actually one signal indicator on H1. Bollinger Bands, Stochastic, ADX, Moving Average — all four are called only in the UI-panel rendering functions. The decision "open BUY/SELL" is taken from one indicator handle with two buffers (upper / lower band). Parameters of that indicator are not present in Inputs at all — hardcoded.
- A martingale grid with progression
{1, 1, 2, 3, 4, 5, 6, 7, 8, 9}× base lot, 200-pt step, close at +200 pt off VWAP. A real basket from the tester — 12 levels over 12 days, cumulative volume 13.21 lots, closed by margin call. By default there is no depth limit (Max Grid Levels = 0), no volume limit (Maximum Total Lots = 0.0), no drawdown stop (Max Drawdown % = 0.0). - 175 hardcoded blackout dates in
.rdata— look-ahead bias. The list is curated against every known historical FX crisis (COVID 2020.03, Russia-Ukraine 2022.02, AUDCAD flat 2023.06, tariffs 2025.03). It ends on 2026.01.15 ≈ the build date of version 1.17. A swap experiment shows: the same binary on the same data without the look-ahead protection gets a margin call in 5 months instead of +$476K over 7 years.
If you had to pick one fact out of all five — it's the fifth. The buyer looks at the vendor's backtests for 2019-2025, sees a flat equity curve, a profit factor of 2.33 and a 30% DD. Pays $399. Attaches the EA to a live account in 2026. Gets a different strategy — one where the 175-date protection has already expired, while the martingale grid {1,1,2,3,4,5,6,7,8,9} is still in place.
Between "the backtest the buyer sees" and "the trading he actually gets" — a table of 175 numbers in the code, hidden from the UI.
And note that each finding in the list above stands on its own. Even if you remove flaw #5 — four direct contradictions to the description remain. Even if the vendor updates the EA tomorrow and adds new dates to the blacklist — that wouldn't fix anything: the open-depth martingale grid hasn't gone anywhere, the AI is still a decoration, and the protection is still after-the-fact.
EA audit before purchase
MQL5 Market has tens of thousands of EAs. Most are repackaged variants of the same martingale grid on different indicators. A few percent actually work. Telling them apart at the purchase stage is almost impossible: the vendor's backtest is always pretty, reviews can be bought, ratings can be inflated.
I do a full audit of EAs before they start trading with your money. What's included:
- I open the source code of the
.ex5file — including for EAs sold as "closed" and "protected" through MQL5 Market; - I read the code end-to-end: trading logic, money management, hidden filters, hardcoded parameters, look-ahead bias, vendor backdoors, ML wrappers running idle;
- I run it in Strategy Tester across multiple years and multiple symbols — finding where the code says one thing and real trading another; I set up custom experiments where the standard backtest is not enough (as with the swap-data experiment in this article);
- I deliver a PDF report with numbers, screenshots, and conclusions — the same kind as this article, only about your EA.
Turnaround: 2-3 days per EA. Price: always less than one average EA from MQL5 Market — so the audit pays for itself even if it saves you from a single wrong purchase.
Don't trust covers with "AI" stamps and equity curves going straight up — audit your EAs before you buy them.

Telegram: @NFS0505
This article is based on the analysis of version 1.17 of Stability Killer AI by BLODSALGO LIMITED (MQL5 Market, product 162939, price $399, published 25 Jan 2026, updated 6 May 2026). All numbers are reproducible — MetaQuotes-Demo account, 1:100 leverage, $10 000 deposit, default parameters, AUDCAD H1 symbol, period 2019.01.01 — 2026.05.01. Full set of reproducible artifacts (extracted ONNX model, swap-experiment script, inference probe script, decompile log, and tester screenshots) — available on request via Telegram.