Dissecting BB Return mt5
EA Audit
How it started
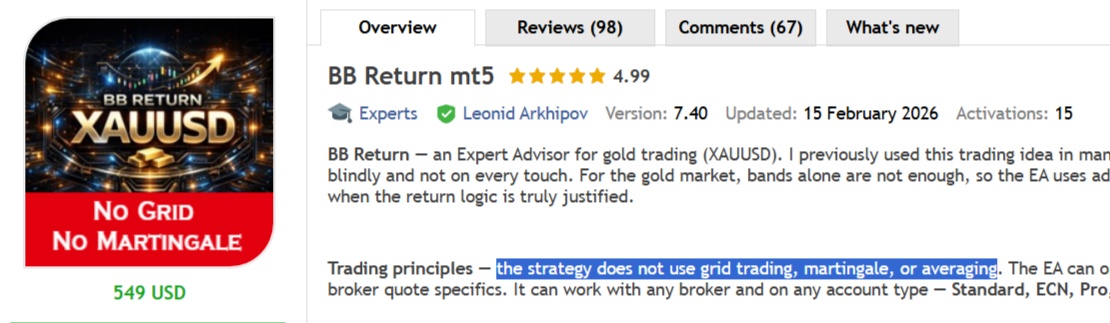
On the MQL5 Market front page there's an EA with a slick cover — gold bar, "No Grid", "No Martingale", 549 USD, 98 reviews, rating 4.99 out of 5. On the description page, in large type: "the strategy does not use grid trading, martingale or averaging". Highlighted in yellow, so you don't miss it.
Sounds solid. The price stings, but reliability is worth it.
I can extract sources from .ex5 EAs and read what's inside. The "No Martingale" label on the cover was the first brick in a wall of bad omens, so I decided to look under the hood.
Before we dive in — product status
Open the What's new tab on the EA's page:
Four updates — all within a single month. After February 15 — silence. As I'm writing this in mid-May — three months without a single update. The author has clearly moved on to the next project.
Buried in the 7.40 changelog: "Fixed EA lockup after changing inputs. In previous builds, after changing parameters and clicking OK the EA could stop trading". So until February 15 every buyer who changed the default settings got a frozen EA. The bug had been there since the January 18 release. A full month.
Worth remembering: a product that hasn't seen an update in three months and, until recently, could stop trading after you changed its settings.
Red flag #1. The main contradiction
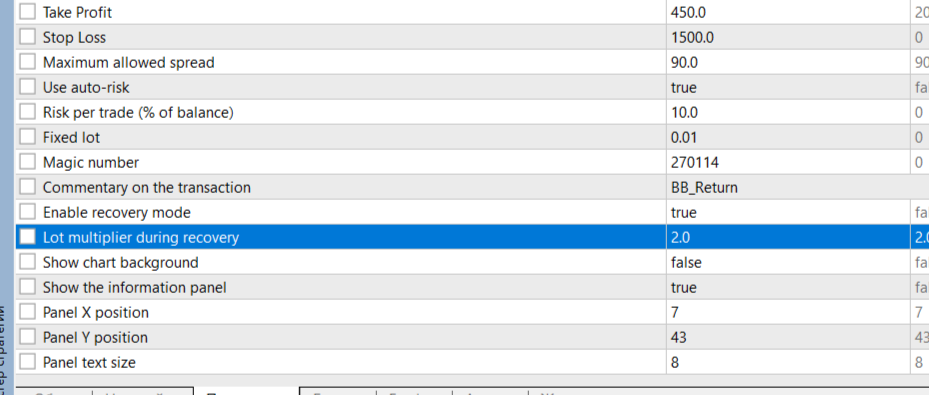
Open the EA in Strategy Tester → the Inputs tab. Among the 15 user-configurable parameters there are two that the author neatly placed side by side and labelled in English himself:
Enable recovery mode             true
Lot multiplier during recovery   2.0
"Lot multiplier during recovery = 2.0". In plain English: "size multiplier for the next lot while recovering = 2.0".
Recovering from what? From a losing trade. The next trade opens with the lot multiplied by 2. Loss again — the lot doubles again. This is the textbook definition of martingale; the Wikipedia "Martingale (betting system)" page opens on exactly this concept.
And this is all before we even open the sources. Just a comparison of the public description with the public EA settings, anything a buyer can see 30 seconds after installation.
98 buyers did not do this comparison. 98 × 549 = $53,802 already paid to the author for a system whose description denies the very features its own interface exposes.
Below I'll prove the martingale isn't just on paper — it's live, and on the right losing streak it can wipe out a deposit. But if this single point is enough to make you close the article and go check the other EAs in your shortlist — that's a perfectly reasonable place to stop.
Red flag #2. Backtests that won't predict live trading
When a buyer is about to part with $549, they look at the backtest. They want to see, with their own eyes, that the system confidently profits across many years of history. More history — better. Smoother equity curve — more credible.
The author knew that's what buyers would look at. And he did two things. The first was ordinary (like everyone else): he tuned parameters so the backtest looked good. The second was unusual: he tuned a separate parameter set for each year and hard-baked it directly into the code.
How it works under the hood
In the code there's a function that, on every bar, fetches the current year and substitutes the "correct" Bollinger Bands parameters. Technically it's a 14-entry jump table — one entry per year from 2011 through 2024. Each entry points to its own block of instructions that overwrites the strategy parameters:
A list of functions, one per year from 2011 through 2024. The 2020 entry points to the same function as 2012 — meaning the parameters for these two years are identical. All other years are unique.
For 2025 onwards there is no dedicated profile — the EA falls back to defaults: period=28, deviation=2.4, BBW=800. Remember this — it fires below.
Full table of hardcoded parameters by year
Year   Period  Deviation  BBW_min  Body_min  Wait
─────  ──────  ─────────  ───────  ────────  ────
2011    22       1.6        900       140      4
2012    18       1.6        400        40      1
2013    18       1.6        140       400      5
2014    18       1.6        550        40      2
2015    32       2.1        500        60      3
2016    36       1.9        550        60      2
2017    34       2.2        400        80      5
2018    30       1.8         40       400      5
2019    24       1.8         40       650      4
2020    18       1.6        400        40      1    ← clone of 2012
2021    18       1.8        800        60      5
2022    18       1.6        400        60      2
2023    28       1.8        550       100      1
2024    20       1.8        600       140      2

2025+   28       2.4        800        80      2    ← defaults
A healthy trading system doesn't have "yearly modes" — the market doesn't reset its properties on January 1. If a strategy needs different parameters for every year, it has no universal edge. What you see in this table is the result of after-the-fact optimization: the author ran the backtest for each year and tuned parameters until the curve looked smooth. Then he hardcoded those optimization results straight into the code.
The most painful part — the last row
Note 2025+ — there are no optimized parameters. The EA falls back to defaults: period=28, deviation=2.4, BBW=800. The author did not tune these against forward data (none existed at the January 2026 release). These are just values that "kind of worked" in backtest.
A buyer who attaches the EA to a live account in February 2026 trades defaults. A buyer who looks at the author's backtests from 2018 to 2024 sees the results of specifically optimized profiles. Those are two different strategies.
These are constants pulled straight from machine instructions — you can't change them through settings, the user has no access.
Verified via Strategy Tester
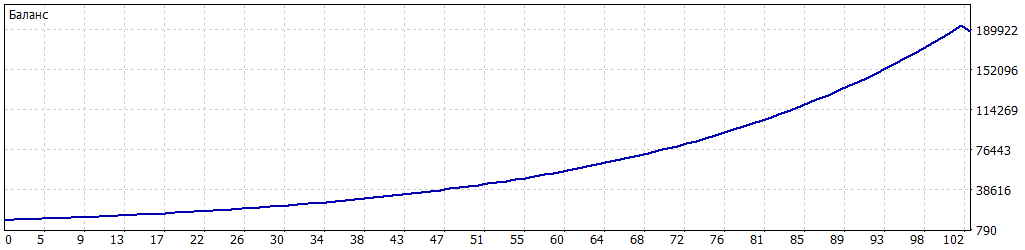
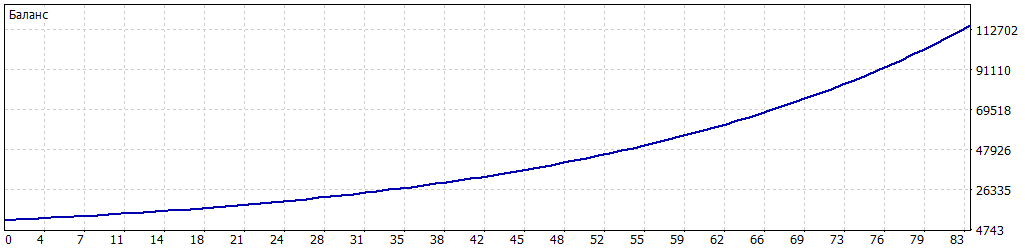
Run 4 single backtests. Identical settings across the board (XAUUSD M5, $10,000 deposit, 1:100 leverage, EA defaults). Only the date range changes:
Period          │  Trades │ Winrate │ Net Profit │ Max DD │ Margin level
────────────────┼─────────┼─────────┼────────────┼────────┼────────
2018 (year)     │   79    │ 100.00% │ +$87,554   │  0.00% │  1016%
2024 (year)     │   102   │  99.02% │ +$177,780  │  3.30% │   518%
2025 (year)     │    83   │ 100.00% │ +$105,142  │  0.00% │   321%
2026 (4 months) │    28   │  89.29% │ +$7,296    │ 23.79% │   110%

Read the right edge of the table. Margin level is "how close the account is to stop out". In 2018 it's 1016% (a bunker), in 2025 it's 321% (comfortable), in 2026 it's already 110%. Stop out at most brokers is 50-100%. One large Recovery (and one has already produced a -$3,330 loss) — and the account punches through.
Now look at the winrate. 100% over 79 trades in 2018 and 100% over 83 trades in 2025 — that's, to put it mildly, non-standard. Professional systems rarely exceed 70-75% annual winrate. 100% over dozens of trades without a break is either martingale that hides losses inside pretty statistics (but then we'd see at least one huge winner covering the recovery sequence — and we don't, recovery never triggered), or parameters tuned so the EA only takes certain-winner setups.
Look at 2018 in the parameter table: BBW=40. That's 20× smaller than the default 800. Translated: "only trade when Bollinger Bands are squeezed to an extremely narrow range". You can sort such moments on historical data by actual outcome and keep only the winners. Live, narrow ranges are rare — and most of those "winner setups" simply won't materialize.
2026 shows the real profile of the system:
- 3 losses appeared (89% winrate instead of 100%)
- one of the losses was -$3,330 — exactly ×2.13 of a normal trade. Martingale fired — the same martingale that in "perfect" years never activated simply because there were no losses
- drawdown 23.79% vs 0% in 2018/2025
- the account is on the brink of margin call after the first recovery trigger — and that's 4 months of trading
A buyer who looked at the 2025 backtest (100% winrate!) and bought in February 2026 for $549, four months in, sees a deposit at -24% and right next to stop out. Backtest and live are two different strategies, separated by a single line of code: "if year < 2025 use the profile, else defaults".
And, in my view, this is the main flaw of this EA — not the martingale, not the SL/TP skew, not the aggressive risk. The main flaw is that the backtests the author uses in his marketing are irrelevant to trading this EA after purchase.
Red flag #3. Martingale in action — not on paper, in the Journal
The parameter exists in the settings. The code matches the martingale formula. But maybe in live trading that checkbox doesn't actually fire and we're sounding a false alarm? Let's check.
Two single backtests on the same history (XAUUSD M5, period 2026.01.01 – 2026.05.05, $10,000 deposit). All parameters identical — except one checkbox, Enable recovery mode. Take the result, open the Journal tab and read what the EA actually does with the lots.
The first case lands on a streak of two losses. The lot of the first losing trade is 0.77. Five days later — a new signal, the EA tries again.
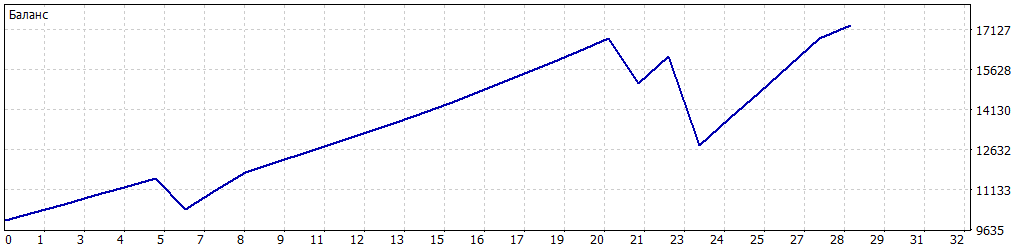
Recovery = OFF (martingale disabled):
2026.01.22 09:16:40  stop loss triggered #12 sell 0.77 XAUUSD ...
2026.01.27 22:25:00  SIGNAL: SELL return -> trying OpenOrder
2026.01.27 22:25:00  AutoRisk | XAUUSD | Balance=10420 | Risk=10.00% | Lot=0.69
2026.01.27 22:25:00  OpenOrder: SELL vol=0.6900 ...
We see the lot being recalculated: balance dropped → AutoRisk takes 10% of the smaller balance → lot 0.69. Smaller. Normal money-management.
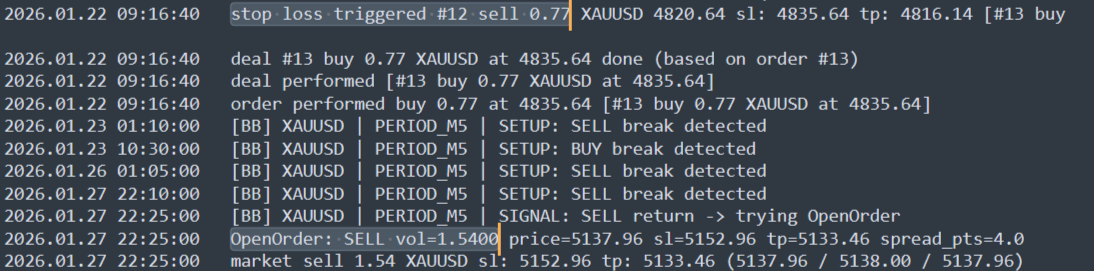
Recovery = ON (martingale enabled) — same trade, same history:
2026.01.22 09:16:40  stop loss triggered #12 sell 0.77 XAUUSD ...
2026.01.27 22:25:00  SIGNAL: SELL return -> trying OpenOrder
2026.01.27 22:25:00  OpenOrder: SELL vol=1.5400 ...
No AutoRisk recalculation, the EA simply takes the previous lot and multiplies it by 2. 0.77 × 2.0 = 1.54. Exactly. That's Lot multiplier during recovery = 2.0 from the settings, live.
The cost of that single checkbox
Before we look at numbers, let's look at the equity curves. Same history, same symbol, everything identical:
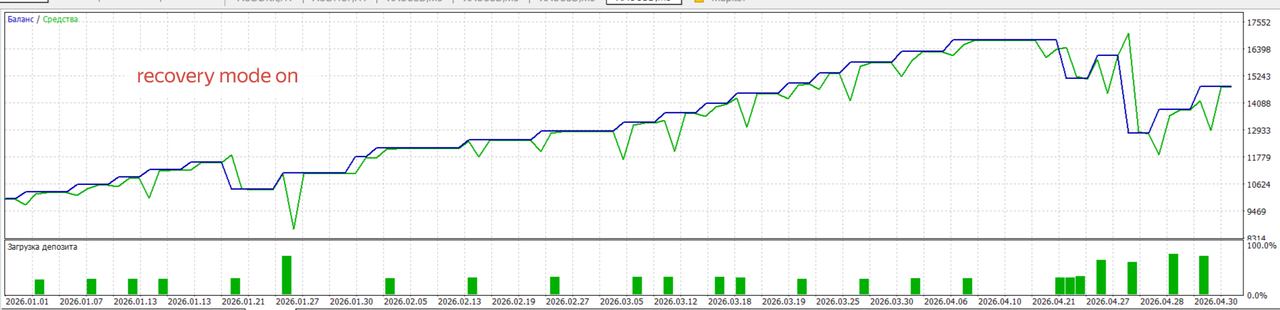
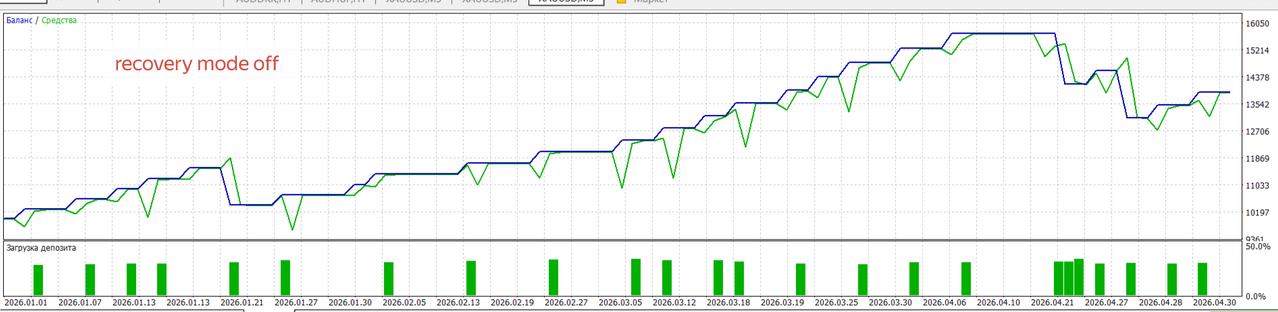
The eye instantly catches it: "the top one looks nicer". That's the bait. Now read the numbers:
                            Recovery ON    Recovery OFF
─────────────────────────  ────────────  ────────────
Total trades                    25            25
Winrate                         88%           88%
Net Profit                    +$4,798       +$3,916
Profit Factor                  1.78          1.94
Recovery Factor                0.92          1.33
Max DD (balance)              23.79%        16.52%
Max DD (equity)               30.38%        18.77%
Margin level (minimum)        110.36%       262.96%
Biggest loss                  -$3,330       -$1,560   ← ×2.13
Biggest win                   +$999         +$454     ← ×2.20
Read it row by row. First — same number of trades (25), same winrate (88%). Which means Recovery is not looking for different setups, not improving the trading logic, not filtering out losers. All 25 entries are the same. Recovery only changes the lot sizes on specific trades.
Next — the biggest loss. In ON mode it's exactly 2.13× larger than in OFF. That's the math when, after a loss, you open the next trade with double the lot, and it also loses. And the biggest win is also 2.2× larger: when recovery did fire, the winning trade came in with double the lot and brought double the profit.
Is that good? On this specific slice of history (4 months) — yes, profit growth of +22% versus OFF. That's the bait the checkbox is sitting on by default: "you'll get more profit".
Is it bad? Minimum margin level dropped from 263% (OFF) to 110% (ON). 110% is on the brink of margin call. At most brokers stop out sits at 50-100%. Meaning after an ON run the account is two large recoveries away from being wiped.
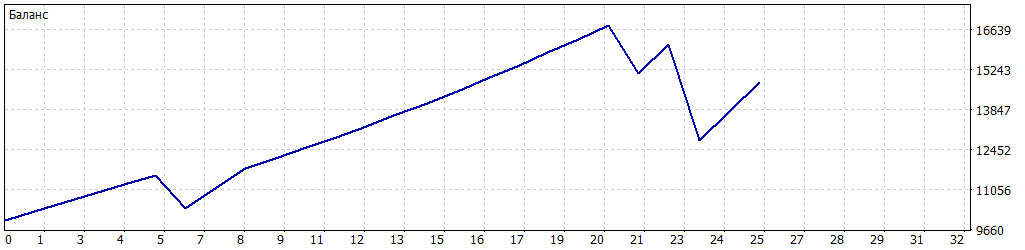
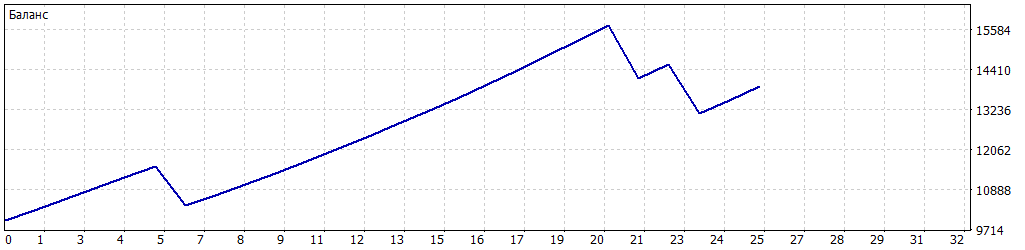
Top — Recovery ON, margin level 110%. Bottom — Recovery OFF, same balance, margin level 263%. More profit, but one bad streak reaches stop out much faster.
What happens on a 5-loss streak
In 2026 we got lucky — three losses in four months, no long streaks. Let's estimate what happens when history goes "the bad way":
Loss #    │  Lot after recovery   │  Loss size
─────────  ────────────────────   ───────────────
  1       │   0.50                │  -$1,500
  2       │   1.00 (×2)           │  -$3,000
  3       │   2.00 (×2)           │  -$6,000
  4       │   4.00 (×2)           │  -$12,000  ← deposit gone
And that's at a starting lot of 0.5. On larger accounts the starting lot is larger, and margin call arrives on the 3rd or 2nd iteration.
"No Martingale" on the cover can now be safely placed in quotes.
Red flag #4. Dangerous defaults that work in tandem
Back to the Inputs screenshot. Beyond the martingale there are two more values that any EA review would flag as "strange".
Take Profit                     450.0
Stop Loss                       1500.0
Risk per trade (% of balance)   10.0
Get out the calculator.
Take Profit / Stop Loss = 450 / 1500
A ratio of 1 : 3.33 in favor of the loss. One Stop Loss "eats" three-and-a-half Take Profits in a row. For such a system to merely break even, the winrate has to be above 77%:
breakeven_winrate = SL / (SL + TP) = 1500 / 1950 ≈ 0.769
The strategy has to win three out of four — otherwise it bleeds by math alone, no martingale needed. A high winrate isn't bad in itself — it's bad when paired with SL > TP. It's the "lots of small wins, rare giant loss" profile. On small samples it looks like a Holy Grail, on long history it regresses to the mean.
Remember the backtests from the yearly-profile chapter? 100% winrate for 2018 and 2025. Not 77% — 100%. That's curve-fitting disguised as "high winrate". When BB parameters are tuned so that only known-winner setups make the cut, the statistics look divine. Live, narrow ranges will be rarer, winrate drops to a realistic 60-70%, and the breakeven math kicks in.
Risk per trade (% of balance) = 10.0
Industry consensus:
0.5–1%    │ conservative (pros, prop firms)
1–2%      │ standard for most public strategies
3–5%      │ aggressive
5%+       │ high blow-up risk
10%+      │ unjustified risk
The BB Return default is 10%. Sequential losses (compounding from the current balance), no recovery:
Losses in a row │ Balance  │ Drawdown
─────────────────────────────────────
       0        │  10,000  │   0%
       3        │   7,290  │ -27%
       5        │   5,905  │ -41%
       7        │   4,783  │ -52%
      10        │   3,487  │ -65%
And that's no martingale. With RecoveryFactor=2.0 you reach the same numbers in 4 consecutive losses, after which margin call arrives on its own.
What "10% + 1:3.33 + martingale" really means
Most buyers don't change the defaults. They attach the EA "out of the box". And they get:
- an asymmetric loss profile (×3.33 vs the win)
- aggressive risk (10% of balance per trade)
- martingale doubling the lot after a loss
These three parameters all push in the same direction — amplify the swing. On a backtest, where BB parameters are tuned to history and losses are rare, this produces beautiful numbers. Live, where the parameters were never tuned, the first long losing streak triggers the cumulative effect of all three flaws at once.
Red flag #5. Where the real strategy parameters are hidden
Open Inputs once more. 15 parameters:
8  money management params       (TP, SL, lot, risk, recovery)
1  filter param                   (MaxSpread)
1  identification param           (Magic number)
5  cosmetic params                (Comment + panel)
See the problem? Not a single parameter belonging to the strategy itself. Bollinger Bands length, its deviation, the bandwidth filter (BBW), candle-size filters — none of them are in Inputs.
And it's precisely these 5 values that decide when the EA opens a trade. Money management is "how much", the spread filter is "under what condition", magic is "how to label". But "when to enter" — the thing that makes a strategy a strategy — is locked away from the user.
Where are they? In the code. Hardcoded. The default set:
Period (BB)          28
Deviation            2.4
BBW_min              800
body_min             80
body_max             750
The user cannot tune them, cannot optimize them, cannot see them. On any timeframe, on any instrument, in any volatility — these 5 values stay the same. With one exception. About that now.
Red flag #6. GBPUSD has its own private profile
The code contains a separate check: if the current symbol's first letter is G (or the full string equals GBPUSD) — overwrite the defaults with its own set:
Parameter      │  Default  │  GBPUSD
───────────────┼───────────┼──────────
BBW_min        │   800     │    60      ← 13× smaller
body_min       │    80     │    10      ← 8× smaller
body_max       │   750     │  2500      ← 3+ × larger
wait           │     2     │     6      ← 3× larger
In other words, for GBPUSD there's a different strategy baked into the EA, one the user has no access to. No other symbols appear in the code — no USDJPY, no EURUSD, no AUDCAD. Just XAUUSD (via the leading letter X and via defaults) and GBPUSD (via G).
A multi-layered parameter cake
Putting it all together. The BB parameters in the code are assembled in three passes:
1. Base defaults:     period=28, deviation=2.4, BBW=800, body 80/750
2. If symbol GBP*  → overwrite with BBW=60, body 10/2500
3. If year 2011-2024 → overwrite with the yearly profile from chapter #2
The buyer sees only 15 parameters — about lot, risk and panel color. The real entry logic is hidden behind three layers of hardcode.
Verifying through the tester
Run 4 single backtests on identical default settings, period 2025.01.01–2025.12.31, M5. Only the symbol changes:

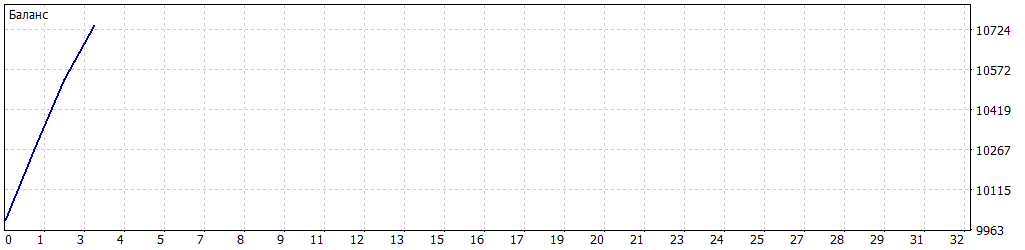
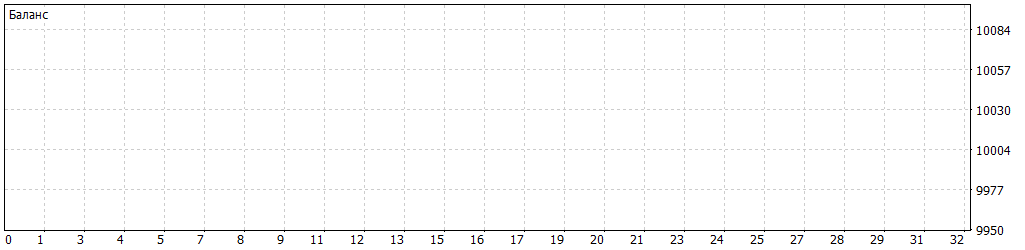
What you can see here without any deep analysis:
- EURUSD and AUDCAD — vanilla FX pairs, zero trades for the whole year. The default BB parameters (BBW ≥ 800 points of width) on FX simply never trigger — 800 points on EURUSD is a half-year range, not a five-minute signal.
- GBPUSD — three trades for the whole year. Not "few", literally 3. If GBPUSD ran on defaults, it would have 0 trades like EURUSD. The fact that there are three is direct proof that the override on letter G fires: the BBW filter drops from 800 to 60 and the pair starts catching occasional setups.
- XAUUSD — 83 trades for the year. The default BB parameters were tuned for gold specifically, and they only work there.
Why did the author add a dedicated GBPUSD profile?
Technically — because different instruments have different volatility and the same BB filters don't fit all of them. That is a valid concern. The correct solution in this situation is adaptive filters via ATR or standard deviation. The author's solution is different: hardcode constants for the second specific symbol.
Yet the GBPUSD profile produced 3 trades and $740 in profit. On a $10,000 deposit that's 0.07% per year. Either the tuning was never finished, or it was added just to check the marketing box — "works not only on gold, on GBPUSD too".
What this means for the buyer
Recall the description on Market: "works 24/7 on any broker and account type".
On two of four symbols tested the EA sits silently and doesn't open a single trade for a full year. No notifications, no log messages about "parameters don't fit" — just silence. The buyer attaches the EA to his EURUSD account, sees an empty journal and thinks "well, the market is what it is" — when in fact the EA's filter is structurally incapable of opening a trade there.
The EA actually trades two instruments: XAUUSD (the main target, around which defaults and yearly profiles are tuned) and GBPUSD (a secondary, almost decorative override). Everything else doesn't trade at all.
What you get for $549
Pulling the whole picture into one list:
- "No martingale" on the Market cover vs Lot multiplier during recovery = 2.0 in Inputs. The description contradicts the EA's own UI.
- 14 different BB parameter profiles — one per year from 2011 to 2024. For 2025+ — defaults. The author's backtests showcase optimized years. A buyer in 2026 is trading a fundamentally different strategy.
- Recovery × 2.0 — a real martingale, confirmed in the Journal (0.77 → 1.54). A streak of 4 losses on defaults → margin call.
- Stop Loss 1500, Take Profit 450 (1:3.33 in favor of the loss) + AutoRiskPercent = 10% by default. One loss eats 3.33 wins. Breakeven needs 77% WR (industry standard for risk is 1-2%).
- The real strategy parameters (BB Period, Deviation, BBW, body) are NOT in Inputs, they're hardcoded. The user sees 15 settings, none of them about the strategy itself.
- Only 2 hardcoded symbol profiles in the code: XAUUSD and GBPUSD. On EURUSD, AUDCAD, USDJPY — zero trades per year.
If you had to pick one fact from all this — it's number two. The buyer looks at the author's backtests for 2018-2024, sees 100% winrate, equity curve as straight as a ruler, drawdown near zero. Pays $549. Attaches it to a live account in 2026. Gets a different strategy — one that runs on defaults, was never tuned against live data, and on the first losing streak fires up the ×2 martingale.
Between the backtest and reality there's one line of code. The one that says "if year is less than 2025, use the optimized profile, otherwise defaults". That line is invisible to the buyer.
Pre-purchase EA audits
There are tens of thousands of EAs on MQL5 Market. Most are copies of each other over different indicators with reworked marketing. A few percent are real. Telling them apart at the moment of purchase is almost impossible: the author's backtest is always pretty, reviews can be bought, ratings can be inflated.
I do full EA audits before they start trading your money. What's included:
- I extract sources from the
.ex5file — even for EAs sold as "closed" and "protected" through MQL5 Market; - I read the code end-to-end: trading logic, money management, hidden filters, hardcoded parameters, author back-doors;
- I run the EA in Strategy Tester across several years and several symbols — finding the places where the code says one thing and live trading does another;
- I deliver a PDF report with numbers, screenshots and conclusions — the same kind you're reading now, but about your specific EA.
Turnaround: 2-3 days per EA. Price: always less than the cost of one average EA on MQL5 Market — meaning the audit pays for itself even if it saves you from a single wrong purchase.
Don't trust covers with gold bars — audit EAs before buying.

Telegram: @NFS0505
This article is based on the analysis of BB Return mt5 version 7.40 by Leonid Arkhipov (MQL5 Market, product 162150). All figures are reproducible — MetaQuotes-Demo account (build 5836), 1:100 leverage, $10,000 deposit, default parameters, symbols XAUUSD/GBPUSD/EURUSD/AUDCAD on M5. The test period is stated in each section.