DJI golden cross through cycle analysis
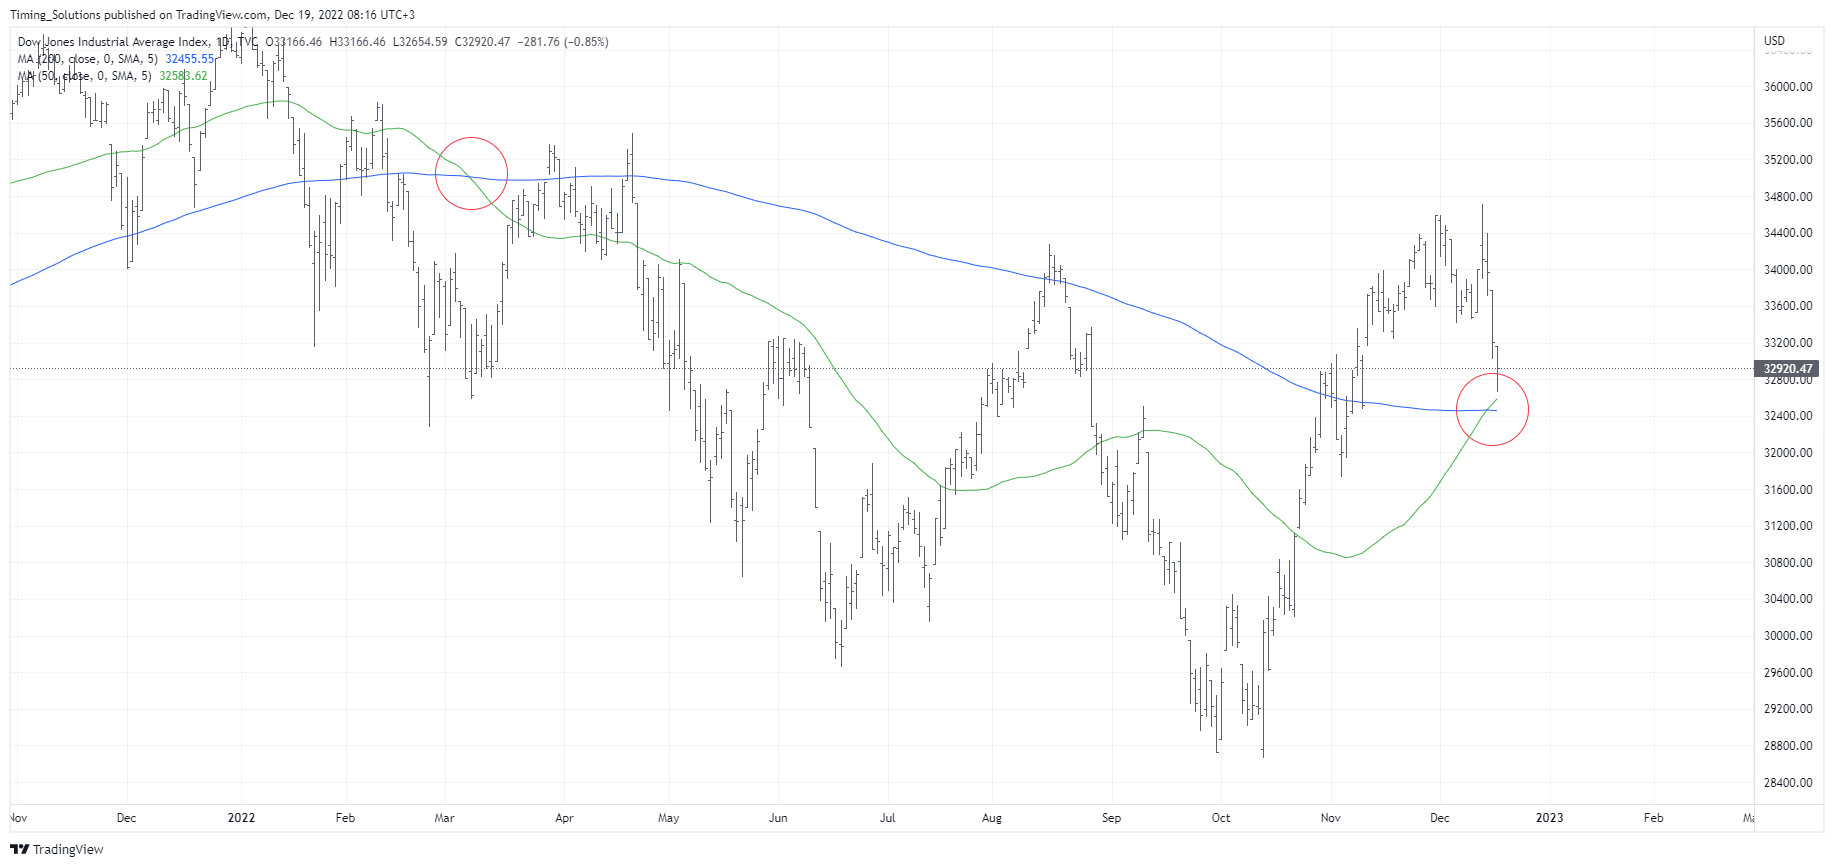
TS Forecasts. Sergey IvanovThe index is currenty followed by so called golden cross: intersaction of 200d MA with 50d MA. This is a strong indicator, but whe we actually may expect further bullish development? Cycles answer.
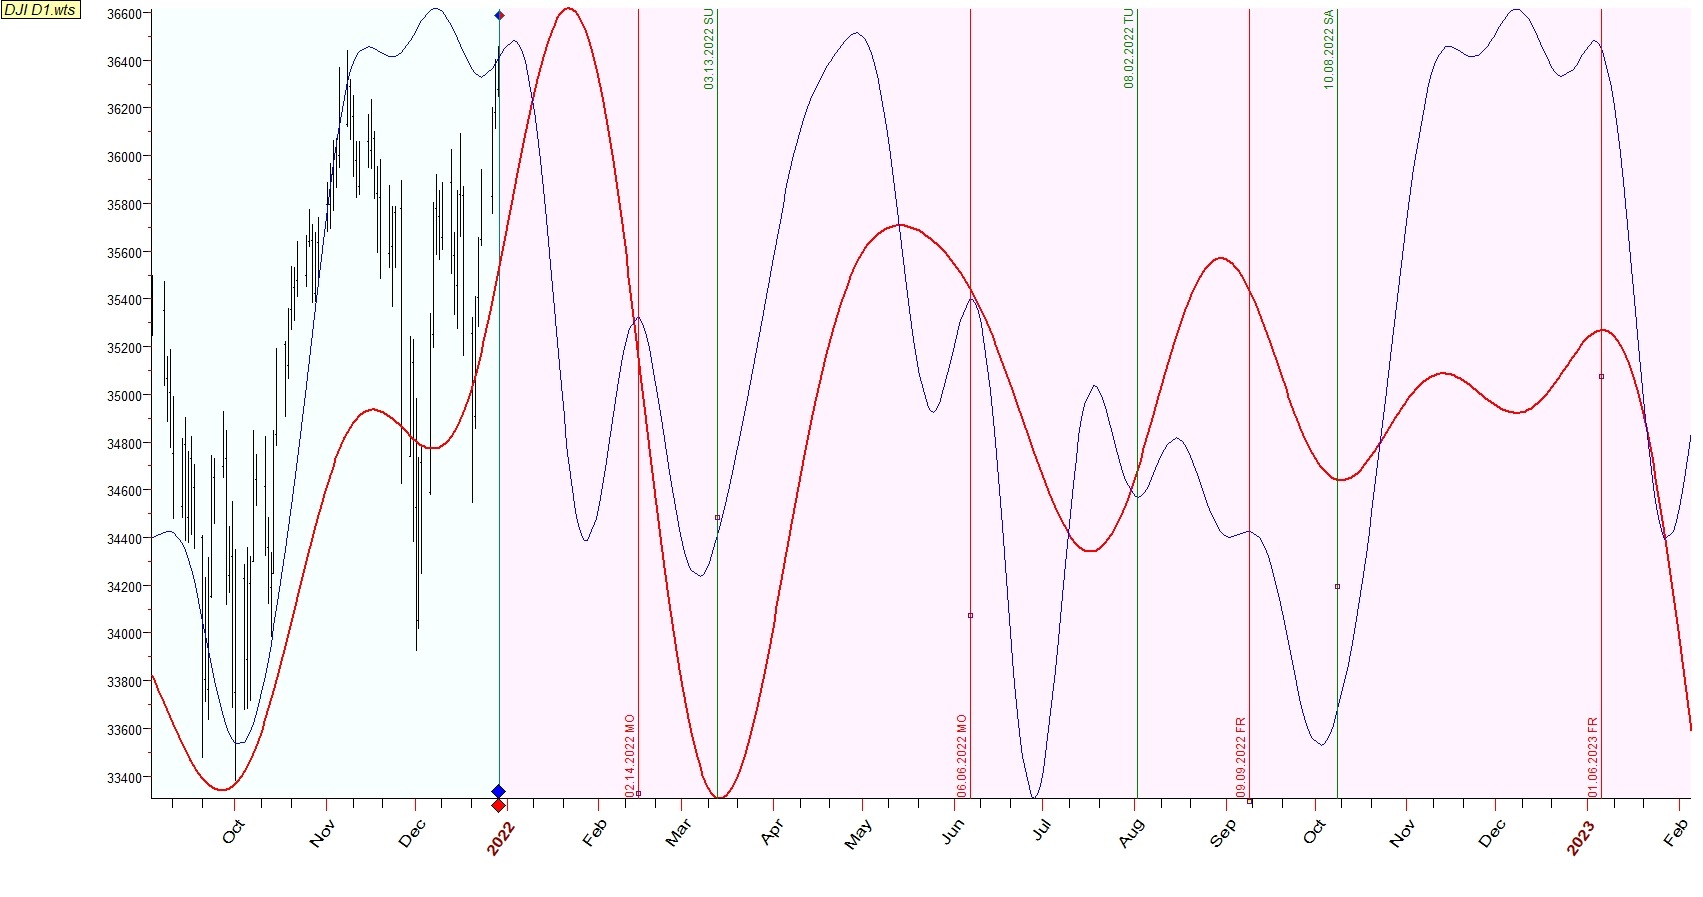
Let's consider we are in Dec 2021 and our target is find the best projection lines for coming 2022. The highest efficiency is demonstrated by fixed cycles composite line and seasonality. Here they are:
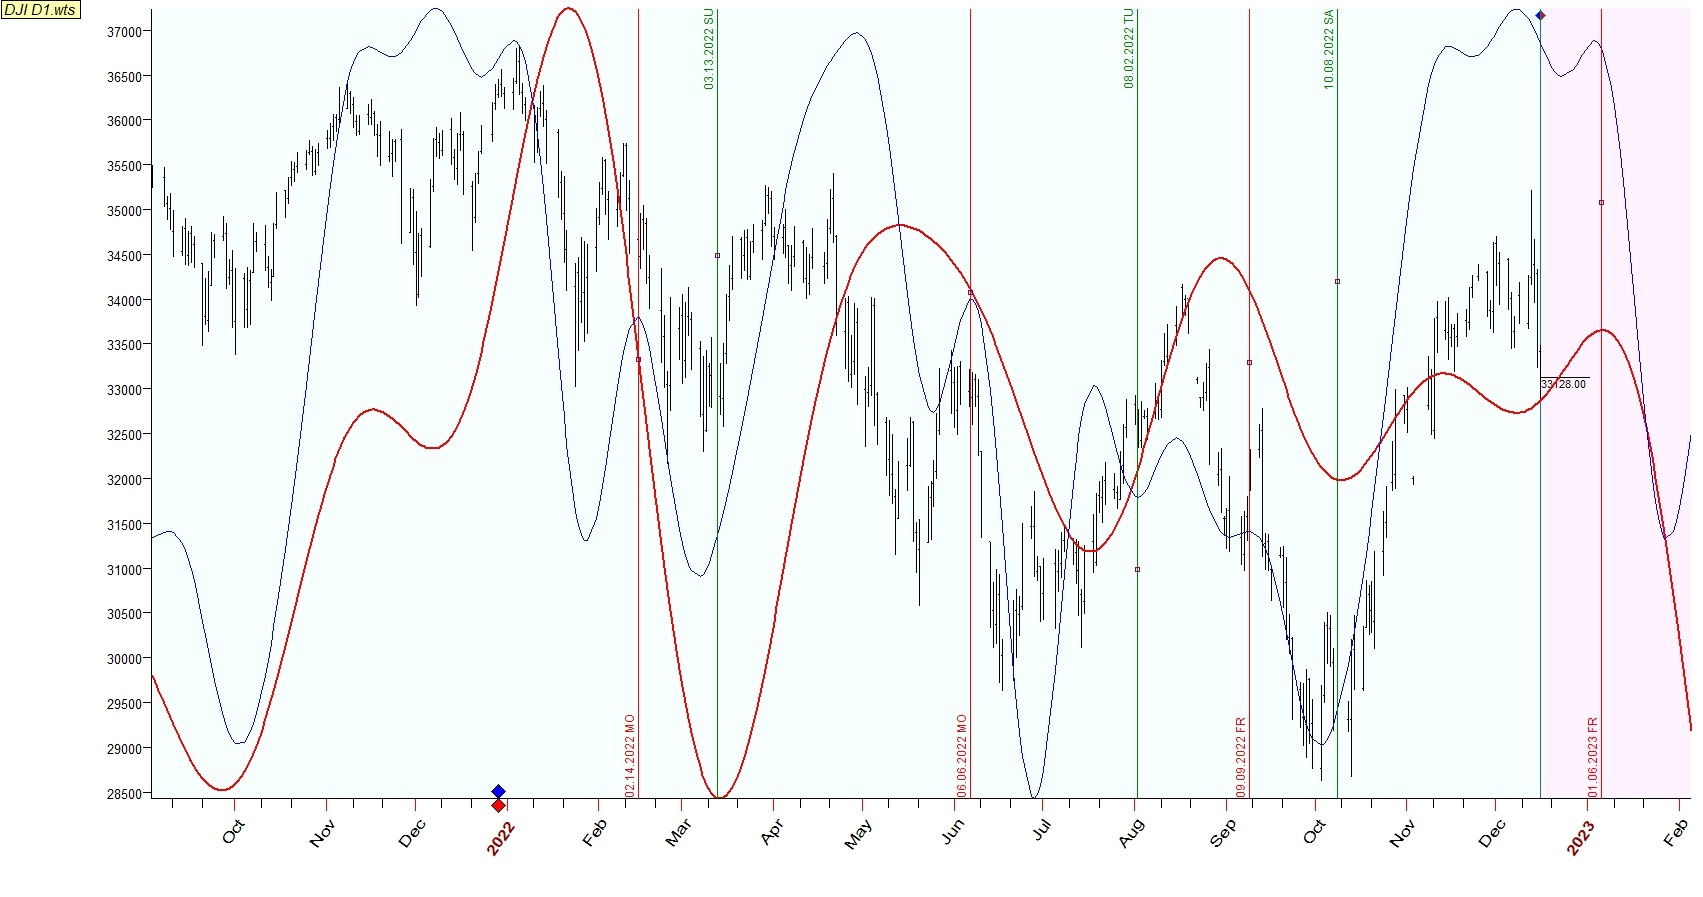
I marked the dates of start the phases when two lines have a common direction. This is what we've got by the end of the year:
Pay attention that red projection line wasn't updated with accumulated price data, which certainly make it sharper:
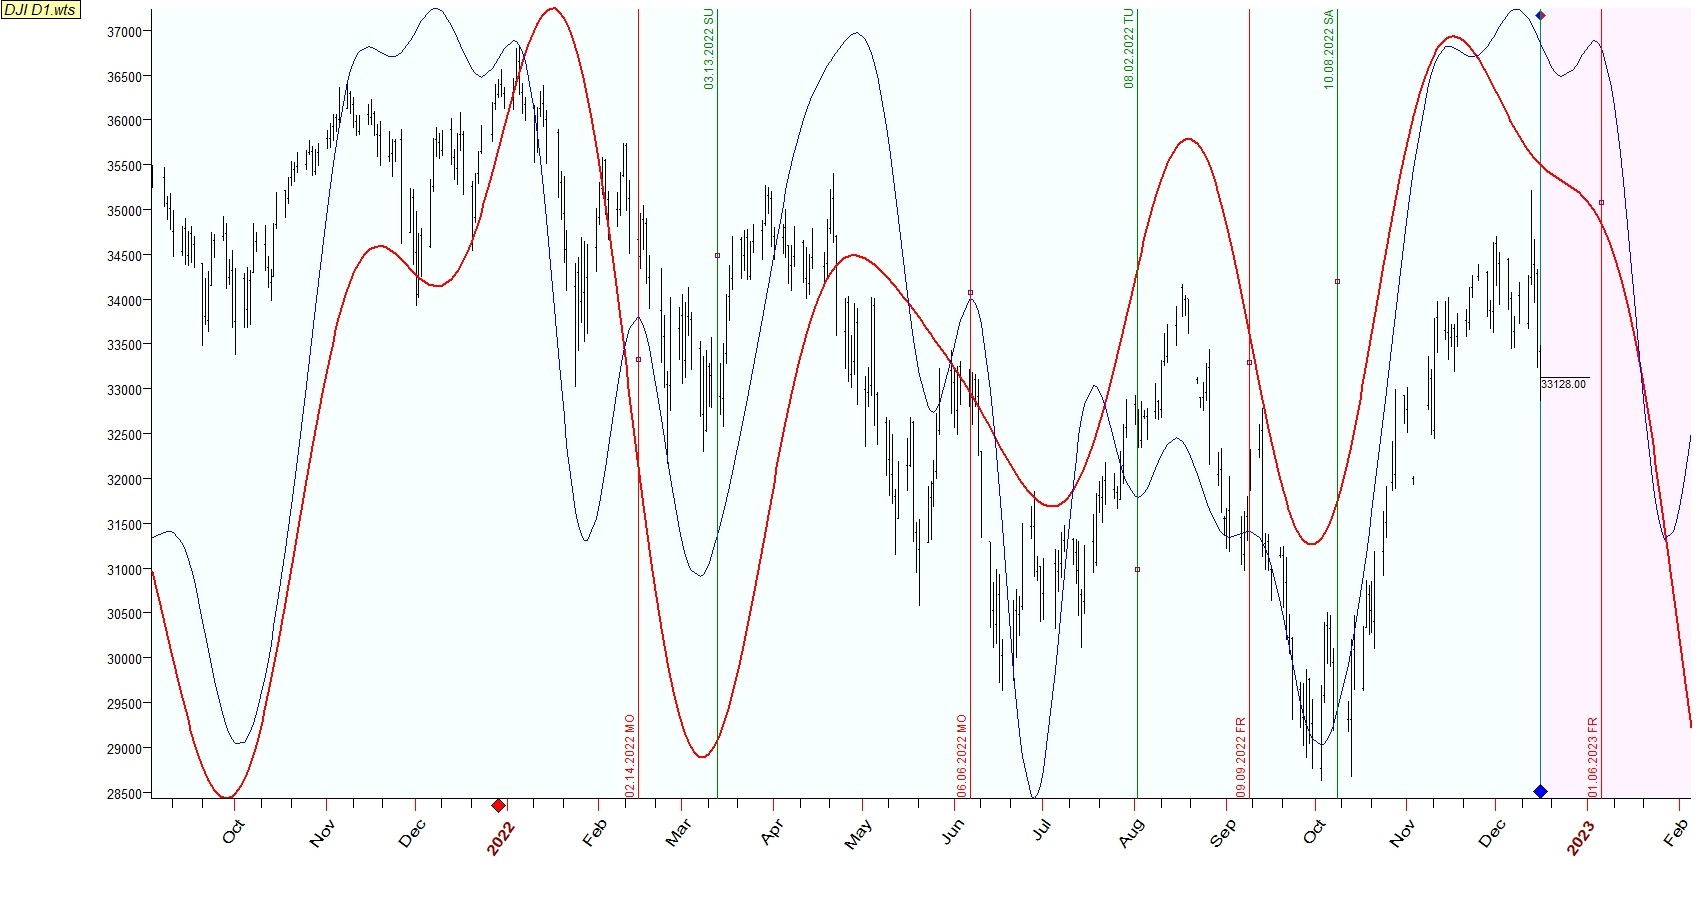
Thus, we came to the conclusion that obtained projections are effective and have to be applied for the next year as well.
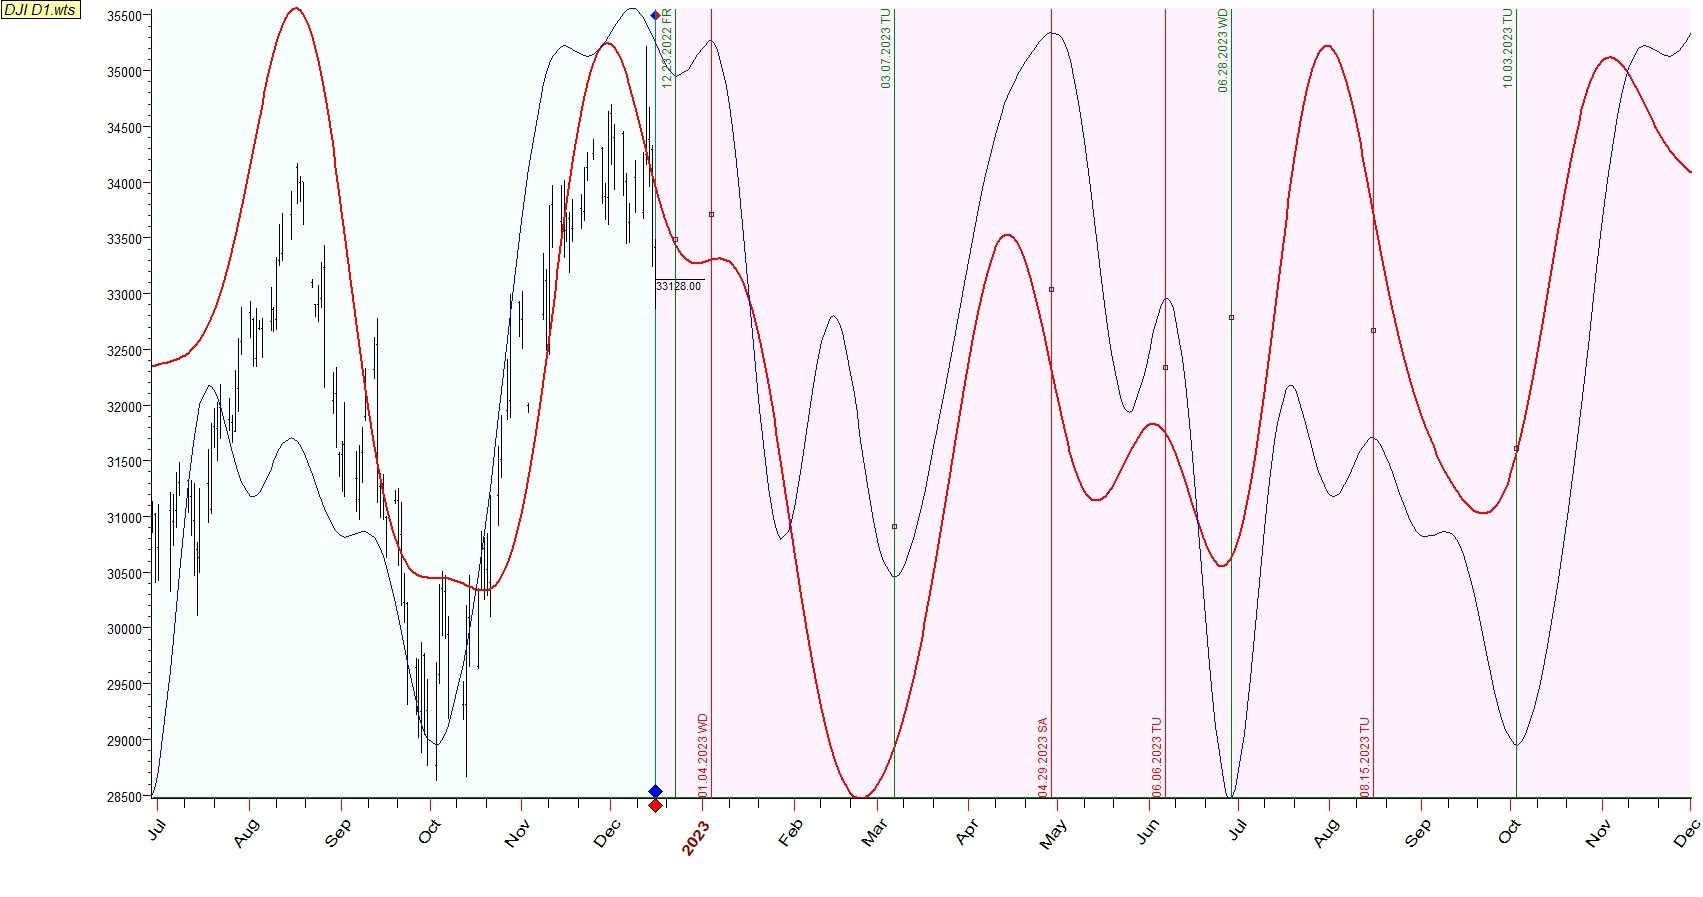
From this preliminary forecast we may assume that considerable bullish turning points are dated on the first half of March and the end of June.
Let's rely to turning points statistics to find the best particular dates of projected bullish/bearish turn:
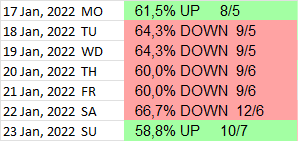
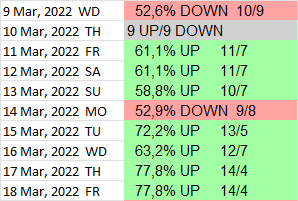

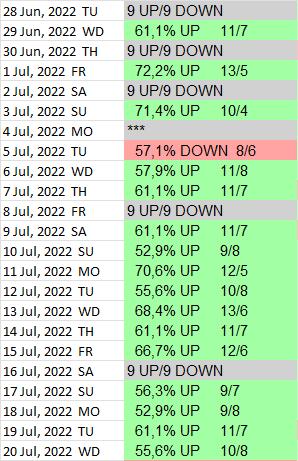
These are the most probable dates of correspondent turning points for the 1st half of 2023. Now let's comlete the 1 quarter of 2023 analysis with similarity vs Crude Oil line to find the phases of projections alignment:
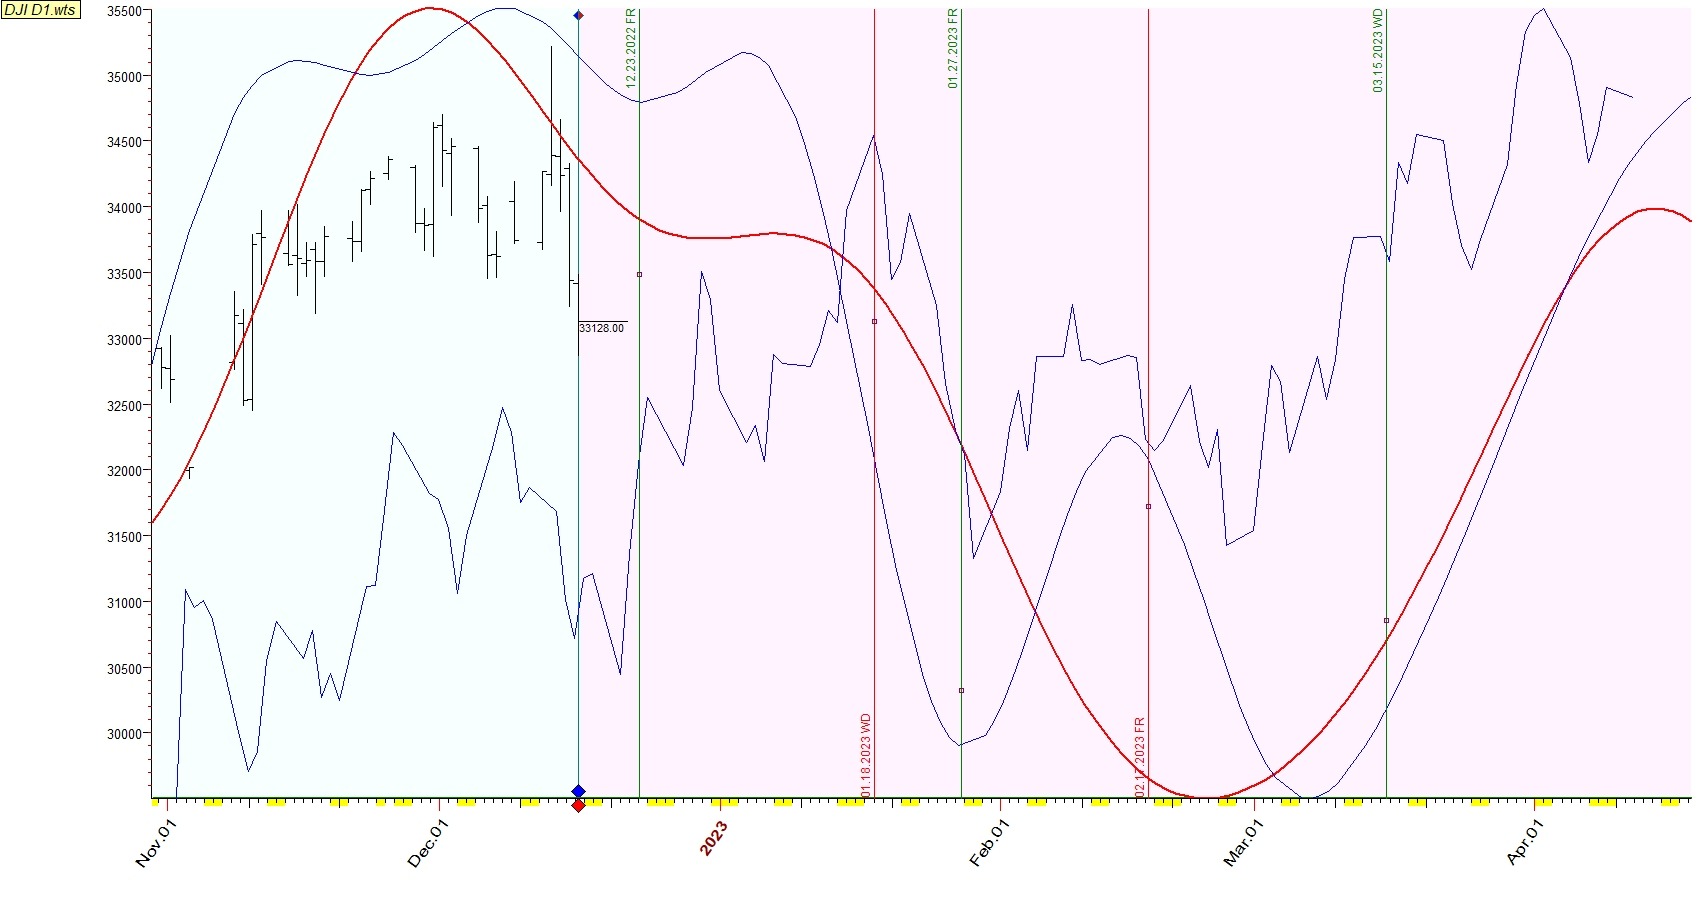
Turning points were also adjusted by statistics to reveal shorter periods of growth and decline. Pay attention that we have phases of all three projections aligment. This means the highest probability of expected movement which, above all, obtain significant magnitude. These periods are:
- decline from the 18th to 26th of Jan;
- decline from the 17th to 24th of Feb:
- growth from the 15th of March.
Finally, I call to pay attention that expected for the end of current year Christmass rally is driven by seasonality only. It is hardly going to be significant and is dedicated to reach more profitable levels prior the further decline in the second half of Jan. Be carefull.