Crypto4light Indicators Pack
Crypto4light
Good day my friends. Yes you read it right, 1 dollar a day can change your life. This is a set of paid indicators. I spent a lot of time with backtesting and leave at this moment 6 indicators which can cut all noise on your charts and bring more light in your trading decisions.
Regardless of your trading style (intraday, scalping, swing trading), you can use all these indicators to increase your win rate. There is no single perfect indicator, so I created a set that will save you a lot of time. This is not a magic button - "money", but by 80% you can more accurately and easily make decisions about buying or selling assets by combining all these indicators. You can set alerts on the indicators, so you don't need to sit all day in front of charts. By combining knowledge of technical and fundamental analysis, world news and this set of indicators, you get a ready-made set for successful trading.
You DO NOT need a paid TradingView membership for these indicators to work.
Detailed video with instruction how to use Indicators

TRADE ON 📊
📌 Link to add Indicator to your favourite

The main indicator with which you can more accurately calculate entry and exit point with a good win rate. The indicator can be used on any timeframes. But everything depends of your trading strategy and risk management. The higher timeframe the more clear signal you'll get. Having calculations of various parameters and data inside, the indicator has 5 alert variations.
➡️Buy/Sell - the signal appears when you can open a position for buying or selling. Stop Loss can be set according to your risk management. Entry into the position can be at the appearance of the Buy/Sell signal and the closing of the candle. Stop Loss by the body or wick of this candle. Another entry option is to wait for the closing of 40-50% of the body of the candle on which you saw the Buy/Sell signal. Stop Loss by the body or wick of the candle on which you saw the Buy/Sell signal. On example you can see 35% profit on spot, 4H timeframe trade. Sometimes you can see signal just blinking, so wait until signal confirmed or try go to lower timeframe to see confirmation for entry by your risk management and strategy.

➡️Red or Green triangles
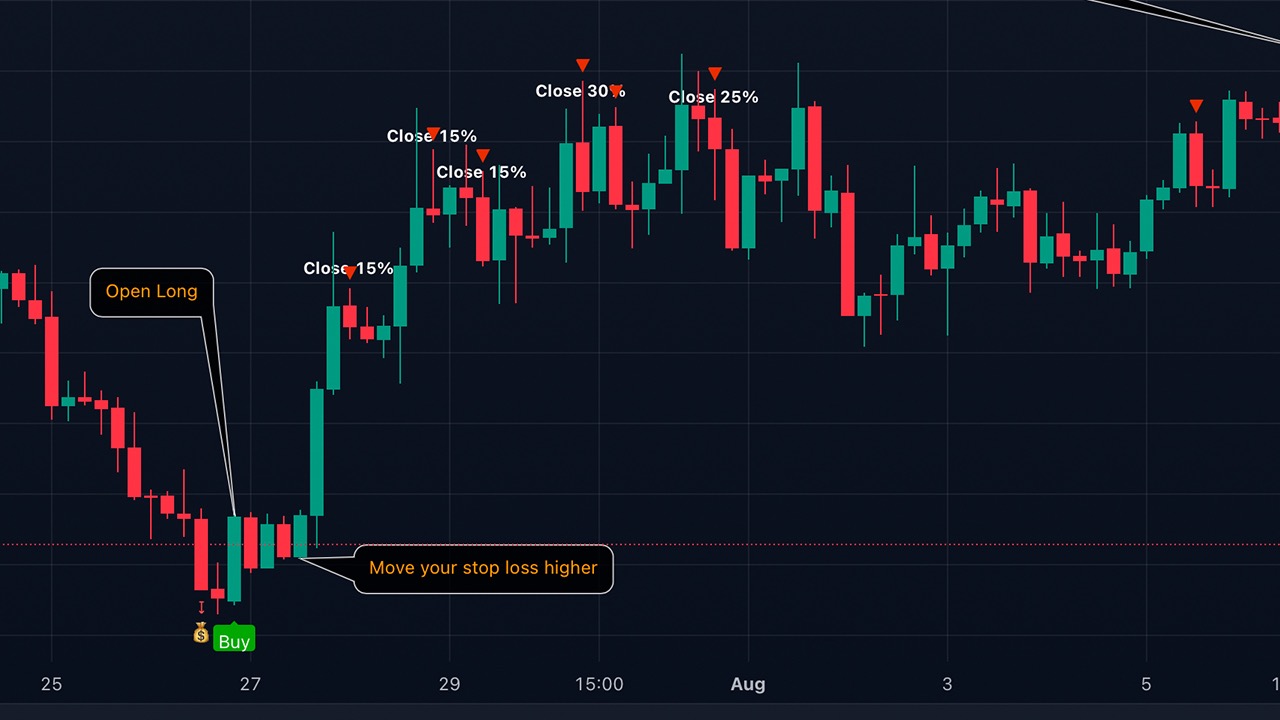
Once a Buy/Sell signal appears and you enter a position, you have several options. It all depends on your trading style and risk management.
- The first option - If, for example, you entered on the Buy signal, you can close the purchase at the appearance of the Take Profit signal, or at the appearance of the Sell signal, and open a position in another direction.
- The second option, after opening a position when triangles appear, this is a signal to close a certain percentage of the position in the plus. With each new triangle, you can close % of your position and move the Stop Loss to breakeven.
- The third option, after opening a position at the appearance of triangles, closing a full position and looking for a possible option to open a position in the other direction, closing the position after the triangles should take place at the appearance of the main Buy/Sell signal.

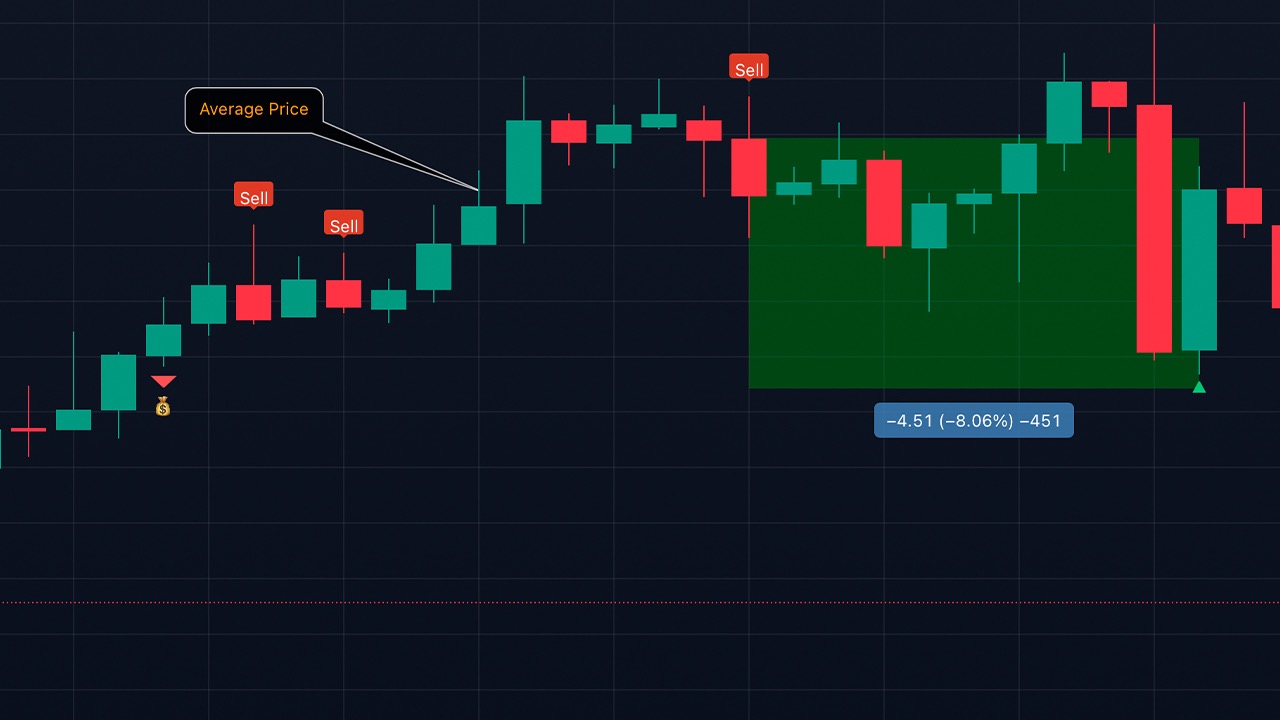
Example in 1st option open manually short position after triangle signal. Usually this positions you can close by hands or wait new signal.
Example in 3rd option open manualy short position after triangle signal, closing the position after the triangles should take place at the appearance of the main Buy/Sell signal.

➡️Take Profit
The signal appears when it is desirable to close 80-100% of your position and wait for the appearance of a new signal or triangles.

➡️Two identical signals in a row
If you see two consecutive Buy/Sell signals, you can take the position in parts and then you will have an average entry point. Stop Loss by the body or wick of the last candle with the last signal.
⏰ Notifications/Alert options

DIRECTION 📊
📌 Link to add Indicator to your favourite
This indicator will help you determine the direction of the trend in the market, depending on the time frame on which you trade! The higher timeframe, the more accurate the direction of market movement. Direction indicator can help you making a decisions to enter or exit a trade. Signals are divided into two types, depending on the direction of the trend,
- Circles will appear from above or below. The circles will signal that the main market makers are starting to reduce or gain their position. Big players always need liquidity, so they can build or reduce a position for quite a long time. Round dots are not the main signal for trading
- A red or green triangle signals a final change in the local or global trend, depending on your timeframe. Market Makers or players with large positions have exited the market, or conversely gained enough position to change the direction of price movement.
- The green and red solid lines are the levels where the trend is most likely to end
The green and red dashed lines are the levels where the big players are more likely to start gradually selling off or gaining a position to change the trend before the momentum. In the style settings, you can change the input positions of each of the lines, for yourself or for a specific asset. But the settings are already set in the most optimal way.
⏰ Notifications/Alert options

MARKET MOOD 📊
📌 Link to add Indicator to your favourite

An indicator that reflects the mood and interest of the crowd in an asset on the market. The older the timeframe, the more clearly the mood of the crowd is visible.
On different timeframes, you can view the mood that is currently present in the market. Trend, euphoria, position selection, or lack of interest.
Red and orange color - fear and overbought in the market
Green - Accumulation and purchases on the market
Yellow - Gradual set of position
White - purchases and lack of interest from small investors
Blue - Neutral mood in the market
⏰ Notifications/Alert options
I rename color zones so you can turn on alerts and easier understand notifications. Some colors got 2 alerts because of gradation based on input data, so you can choose any. You should understand on downtrend for example orange zone can be still be a belief sentiment because traders belief price will not drop.
Dark red - Euphoria
Light red - Thrill
Orange (light and dark) - Belief / Strong Belief
Yellow - Optimism
Green - Hope
Light blue - Disbelief
Dark blue - Capitulation
White - Depression

ADZ (Accumulation/Distribution Zones) 📊
📌 Link to add Indicator to your favourite

An indicator that reflects the accumulation and distribution of an asset.
- The red solid zone shows the zone where the big players will complete the sale of their position.
- The solid green area shows where the big players will accumulate their positions.
- The middle blue zone shows where medium and small players start to accumulate or sell off their positions.
- The yellow zone inside the blue zone shows a trend change and this means that most likely the big players have already gained a position to start selling or gaining it depending on the timeframe in which you are trading.
⏰ Notifications/Alert options

TAKE PROFIT 📊
📌 Link to add Indicator to your favourite
The indicator is ideal for investors and swing traders. An indicator with an extremely good win rate even its a spot or futures. Every asset has a price and a real value. Analysing the data, the indicator gives us the opportunity to enter positions both on the spot market and on the futures market in 4 positions. In the settings, you can choose the color of the lines to your liking under the light and dark theme.

The best win rate in the indicator on the 1D timeframe. Investors can take a position by always buying when the price drops to the fundamental value line. The fundamental value of the asset is displayed only on the 1D timeframe on the lowest line.
- The first lower "Buy" line, when the price drops to this line is a good point to enter a position or gradually build a position.
- The bottom green line "Fundamental price" is the real value of the asset. Sometimes when the media background about the asset is negative and buyers are not interested in the asset, the price can fall below its fundamental price. Then this is the best time to buy the asset.
- The first upper Take Profit line is a line where you can lock part of the profit or close the entire position. There is a possibility of opening a short position if you trade on the futures market
- The very top Exit line is the line where you need to close 100% of the trade position. If you are an investor, you do not need to close the entire position and exit the asset, because all lines are dynamic and change depending on the cycle in which the asset is located.

The indicator is great for analyzing how much an asset is above or below its real price. If an asset soared very high, then usually historically it will still return to its real value. Where you can gradually either gain an investment position or start speculating.
⏰ Notifications/Alert options

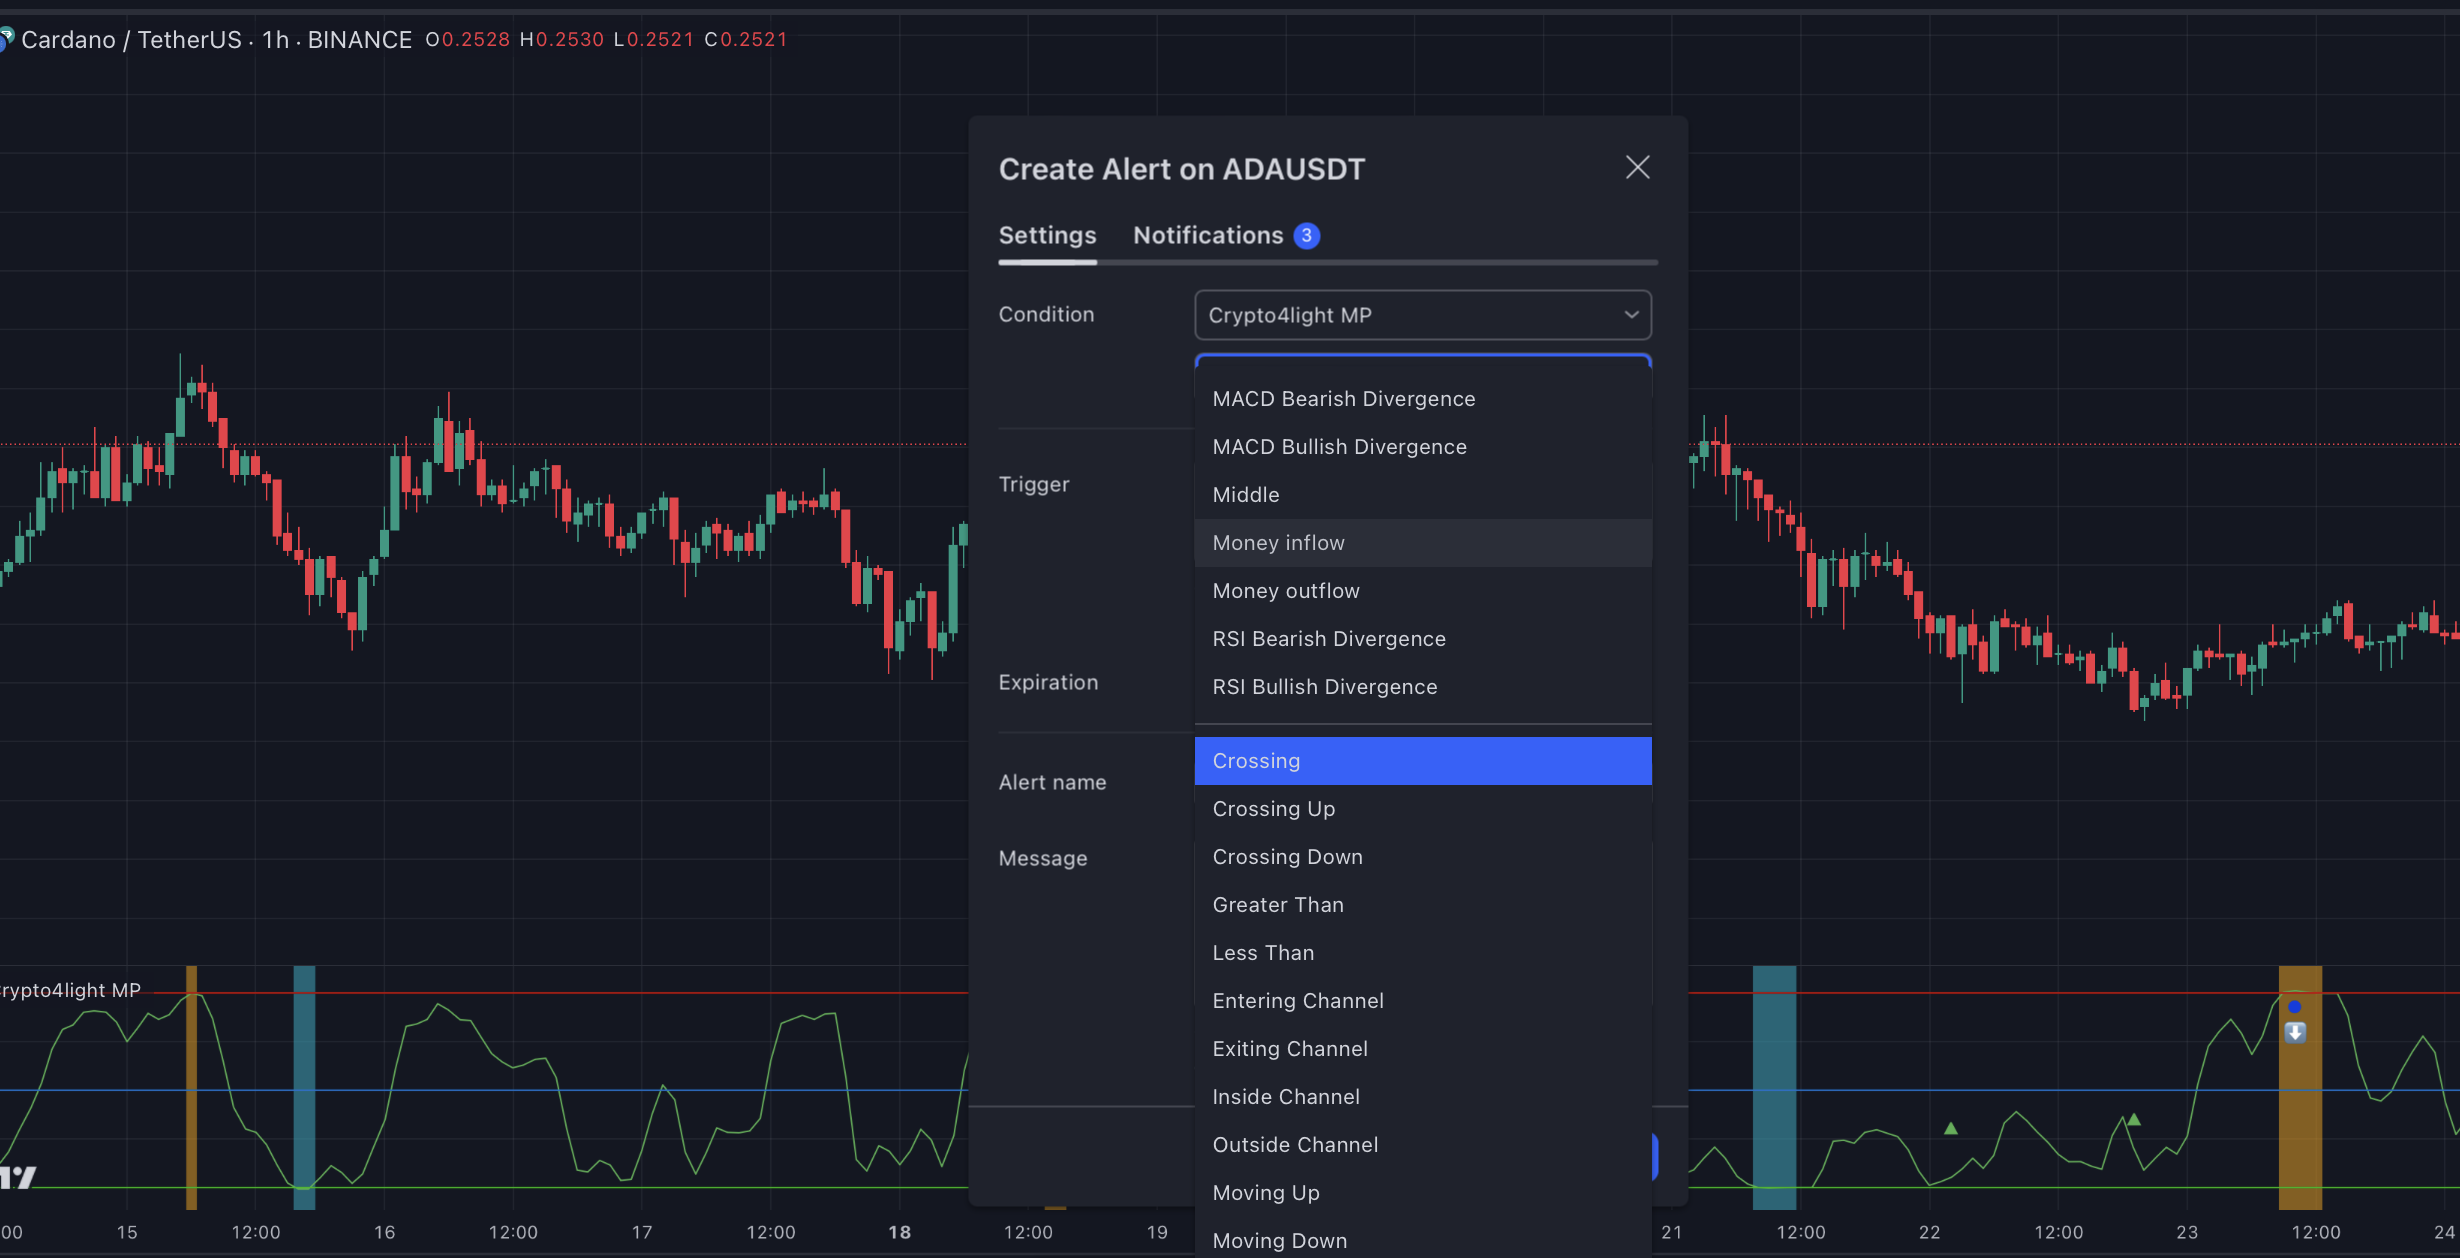
MONEY POWER 📊
📌 Link to add Indicator to your favourite

The indicator has Red (overbought zone) and Green (oversold) edges by default.
This indicator, analysing the data, will show the inflow and outflow of money on different timeframes from big investors. The older the timeframe, the more clearly you can see the investment trend in the asset. Added RSI and MACD divergencies.
When the asset reaches one of the zones, it can serve as a good signal to close a part of the position or to start a gradual acquisition of the position according to your trading timeframe.
An almost ideal signal for deciding whether to enter or exit a position would be a divergence on the price chart and the curve on the Money Power indicator. If you are in a long position, for example, and you see that the price on the chart continues to rise, but in the overbought zone, the lines of the Money Power indicator show lower highs, this is a signal that a large player has almost completely sold out his position on this timeframe.
Of course, the price may continue to grow for some time depending on the timeframe, but such indicators usually indicate the outflow of money from large investors and small players will not be able to keep the asset from falling for a long time. Everything is the same but in a different direction in the oversold zone. When a big player gradually gains a position and we see that the money flow curve goes up, and the price on the chart and candles show lower minimums. This will be a great signal to enter a position. You can enter or close a position by analyzing older timeframes W, 3D 1D depending on your trading style.
In new version you also can find a new signals (explanation with default colors, but you can modify it to your tradingview theme
Yellow block - Whales sell or close % of position
Yellow block with arrow down - Whales strong sell
Blue block - Whales buy
Blue block with arrow up - Whales strong buy
Triangle down - Bearish RSI divergency
Triangle Up - Bullish RSI divergency
Red Circle - Bearish MACD divergency
Green Circle - Bullish MACD divergency
⏰ Notifications/Alert options
I am not a financial advisor. All indicators created with my own personal experience. Do NOT trade or invest based only on indicators. Always do your own research and due diligence before investing. Trading crypto, forex, and stocks are extremely HIGH RISK so please consult a financial advisor before investing.
I understand that there are many beginners who are just starting to trade in the market, so this set of indicators will be available to everyone at a conservative price of 1$ per day.
✅ You can purchase the entire set of indicators for ✅

The usage subscription starts from the day of payment for the set. Subscription fees are non-refundable.
📌 Thank you for reading the Crypto4light indicators instructions.
All indicators can be used on different timeframes. The higher timeframe, the stronger signal. Your entry or exit point should be base on several indicators from the set, your trading strategy and your risk management. Indicators cannot predict or analyze future events in the world, the release of data in economic reports, statements in the media by public figures, so always follow your risk management when you open trades.
☑️ Always follow risk management and this set of indicators will help you. I wish you successful trading.
☑️ You can use this indicators even on free version Trading View just send a your trading view account name for yearly subscription.
☑️ SignUp Tradingview and get instantly 15$ **https://bit.ly/tradingview4light**
☑️ Every subscriber will get an all updates and any new indicators in a future for this pack for free.
☑️ To get a subscription for indicators Pack, please send a direct message. Accept crypto. ⛔ And remember i never DM you first so be aware of scammers.
Telegram - https://t.me/vladi4light
TradingView - https://www.tradingview.com/u/Crypto4light/
Twitter - https://twitter.com/vladi4light
Instagram - https://www.instagram.com/crypto4light/