CPU Usage
DeanHow to Check CPU Usage?
To check CPU Usage, follow these steps:
Go to Settings > About Phone > Tap on Build Number 7 times to enable Developer Options.
Once enabled, go back to main menu and then
Settings > System > Developer Options. Scroll down to find CPU Usage; it should be under Monitoring.
For Video Guide: Click Here
CPU Usage Graph:
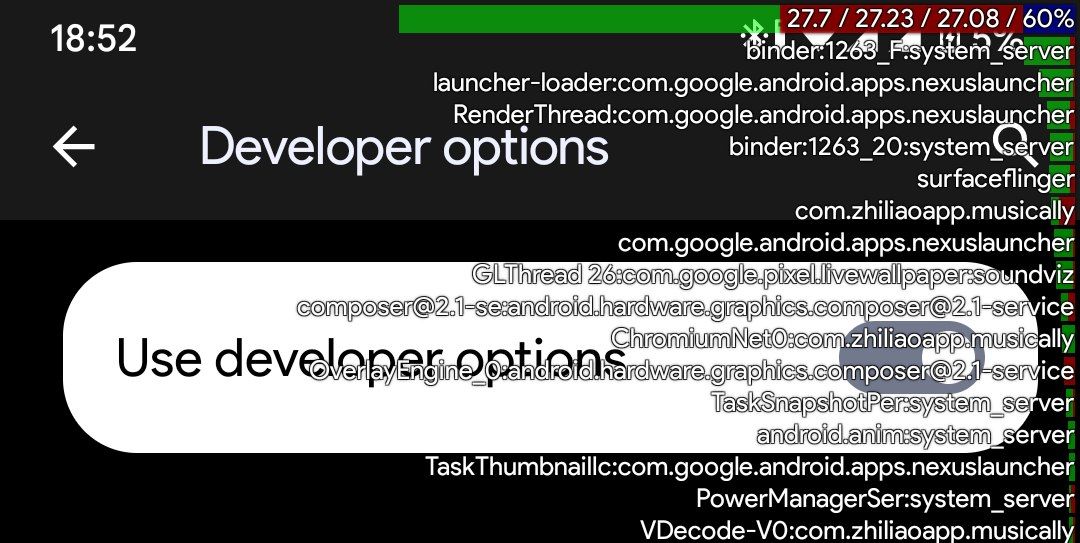
The Bar on Top represents CPU Usage.
Let's Break it down.
Color Significance:
Green: Represents threads with normal priority, usually linked to processes initiated by user apps. This color highlights standard operations that contribute to your device's regular functionality
Red: Marks kernel threads, representing crucial system-level processes. This color signifies essential operations at the core of your device's functioning.
Blue: Indicates I/O threads, specifically related to reads or writes to storage. This color helps you identify when something is writing to the disk, providing insights into storage-related activities
Numerical Metrics:
( 27.7 / 27.23 / 27.07 / 60% )
The numbers show the average load of the CPU at different time intervals, from left to right: last minute, last five minutes, last fifteen minutes. The percentage at the end indicates the total percentage of CPU being used.
CPU Processes:
In the screenshot, you'll notice a cascade of information—line after line, unveiling a real-time display of various processes in action. These lines paint a vivid picture of the dynamic operations occurring on your device at this very moment.
Lets Take this as an example:
" ChromiumNet0:com.zhiliaoapp.musically "
This line breaks down into:
Thread Name: "ChromiumNet0" – This is the identifier for a particular thread, essentially a sequence of instructions that your device is currently executing.
App Package: "com.zhiliaoapp.musically" – This points to the specific app associated with the thread. In this case, it's TikTok.
So, each line essentially tells you which app is doing what, providing insights into the tasks and processes running in the background of your device. This, in turn, lets you know which app is draining your battery or overheating your phone.
Let's Talk about the Toggle:

As you can see from the above Screenshot, CPU Usage isn't a toggle but a slider, and it slides into 4 different options. Let's discuss what each Option does.
Option 1: The first option only shows the CPU bar, which displays the average CPU load over the past 1, 5, and 15 minutes along with CPU Usage in % format.
Option 2: The Second option shows the top three processes using the most CPU power, giving you a clear view of what's eating up your device's resources.
Option 3: The Third Option shows you the top 30 processes, offering a detailed insight into what's happening on your device. This gives you a broader picture of resource usage.
Option 4: The fourth option goes beyond and not only displays the top 30 processes but also provides details about their threads. Threads are like mini-tasks within each process, offering a more detailed peek into the app's activity.