Bitcoin by Ross Ulbricht
@PhoenixGruppeRead This First
After my arrest on October 1st 2013, the price of a bitcoin shot up to over $1,000 from just over $100. After that, it entered its longest bear market up to that point. It dropped ~86% down to ~$175 in a little over a year. I wasn’t paying much attention to it, focused as I was on my case, but every now and then, I’d see a chart or someone would mention the price. From that meager data, I still had a strong intuition around the ~$175 low that the bear market was over and Bitcoin would continue its meteoric rise.
At the time however, I kept my thoughts to myself. I doubted myself because I lacked so much information and didn’t want to mislead anyone on just a hunch. My hunch turned out to be correct and Bitcoin went on a major bull run up to ~$20,000. As it approached this peak, many people around me started asking about how to invest in Bitcoin and other cryptocurrencies. There were magazine articles and radio shows. The hype made it all the way in to maximum security federal prison. Again I had a strong intuition, this time that a major high was near. Unlike last time, I shared my thoughts with some people close to me and was able to help them cash out close to the peak.
I began to wonder how I was able to call with such precision the last two major turning points in Bitcoin’s price. I realized that my distance from the market is more blessing than curse. With all the day-to-day news and market info filtered out, I was only seeing the big picture, so my intuition had a chance to be heard. It also helps that my favorite method of market analysis, based on the Elliot Wave Theory, is perfect for Bitcoin. It provided the right context for these insights to arise.
I don’t think we are at a turning point of the same magnitude as the last two calls I made, but I do have some thoughts about the possible routes the price could take in the coming months and years. I’m not a financial advisor, and this is not financial advice. I am not responsible for any actions you take based on the information provided. I do hope you enjoy it though.
An Elliot Wave Primer
The Elliot Wave Theory is a concept that describes how prices change over time in speculative markets. It combines mass psychology and an area of math called fractal geometry. For those of you afraid of numbers, don’t worry; we won’t be doing anything beyond counting and basic arithmetic. It’s worth taking a moment to understand because it provides an excellent framework with which to understand Bitcoin’s price history up to today and where it may be going next.
Elliot Wave posits that the driving force behind price movements in speculative markets is the expectations investors have about future prices. This makes sense because investors only buy if they think the price will go up so they can sell at a profit later, and when they buy, that pushes the market higher. So, optimism drives the prices higher.
Mass psychology comes into play when other investors see the price rise and it causes them to be optimistic, so they buy in too, pushing the price still higher. A feedback loop sets in between higher prices and higher optimism as more and more investors get drawn in. Eventually — at peak optimism — everyone who is going to buy in already has, and there is no money left to drive the price higher. Then, the few sellers left in the market start to push the price back down. As they do, optimism turns to pessimism and the reverse feedback loop takes hold. Pessimism drives prices lower which creates more pessimism.
Over and over these cycles of peak optimism and peak pessimism coincide with the major tops and bottoms in the price. Thus, buying when you — and everyone else — are most optimistic (high prices) and selling when you are most pessimistic (low prices) is a recipe for losses.
Elliot Wave therefore leads one to become contrarian. It is profitable — though not popular — to be pessimistic when everyone else is most convinced the future looks good for a given asset and to be optimistic when everyone has written it off.
Many look to the news to get an idea of why prices have been going up or down and to find the reasons for why they’ll be higher or lower in the future. This is counter productive because the news is caught up in the same cycles as investors, so you’ll see good news and rosy projections at price peaks, with bad news and projections near lows. It’s the blind leading the blind because no one knows the future. That’s not to say Elliot Wave is a magic bullet, but it can help you step back and not get caught up in popular opinion.
Elliot Wave also uses fractal geometry to track these waves of optimism and pessimism as they unfold. Fractals are shapes that have small features nested within larger ones, and the small features look similar to the large ones. Examples abound in nature such as ferns with leaves within leaves within leaves, or clouds with puffs within puffs within puffs. Fractal patterns often emerge from chaotic systems, and speculative markets — such as Bitcoin — are nothing if not chaotic.
In these markets, the fractal is waves within waves within waves of optimism and pessimism, pushing prices up and down on every scale, from years and decades down to hours and seconds. A wave is just a sustained movement in price, either up or down. The basic pattern is five waves up three waves down. (See Fig. 1)
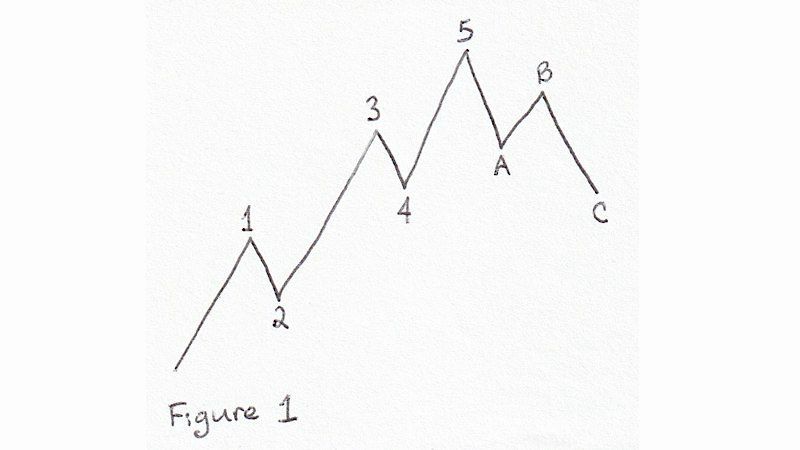
Waves moving in the direction of the next larger trend in prices are called impulse waves. They are labeled with numbers at their end points and subdivide into five smaller waves (1, 2, 3, 4 and 5 in Fig.1). Waves moving against the next larger trend are called corrections. They are labeled with letters and usually subdivide into three smaller waves (A, B and C in Fig. 1) This pattern is not arbitrary. It is the minimum number of waves necessary to allow for both cycles (ups and downs) and trends (sustained moves) within a fractal progression of prices. It can be seen as an efficient form, even elegant.
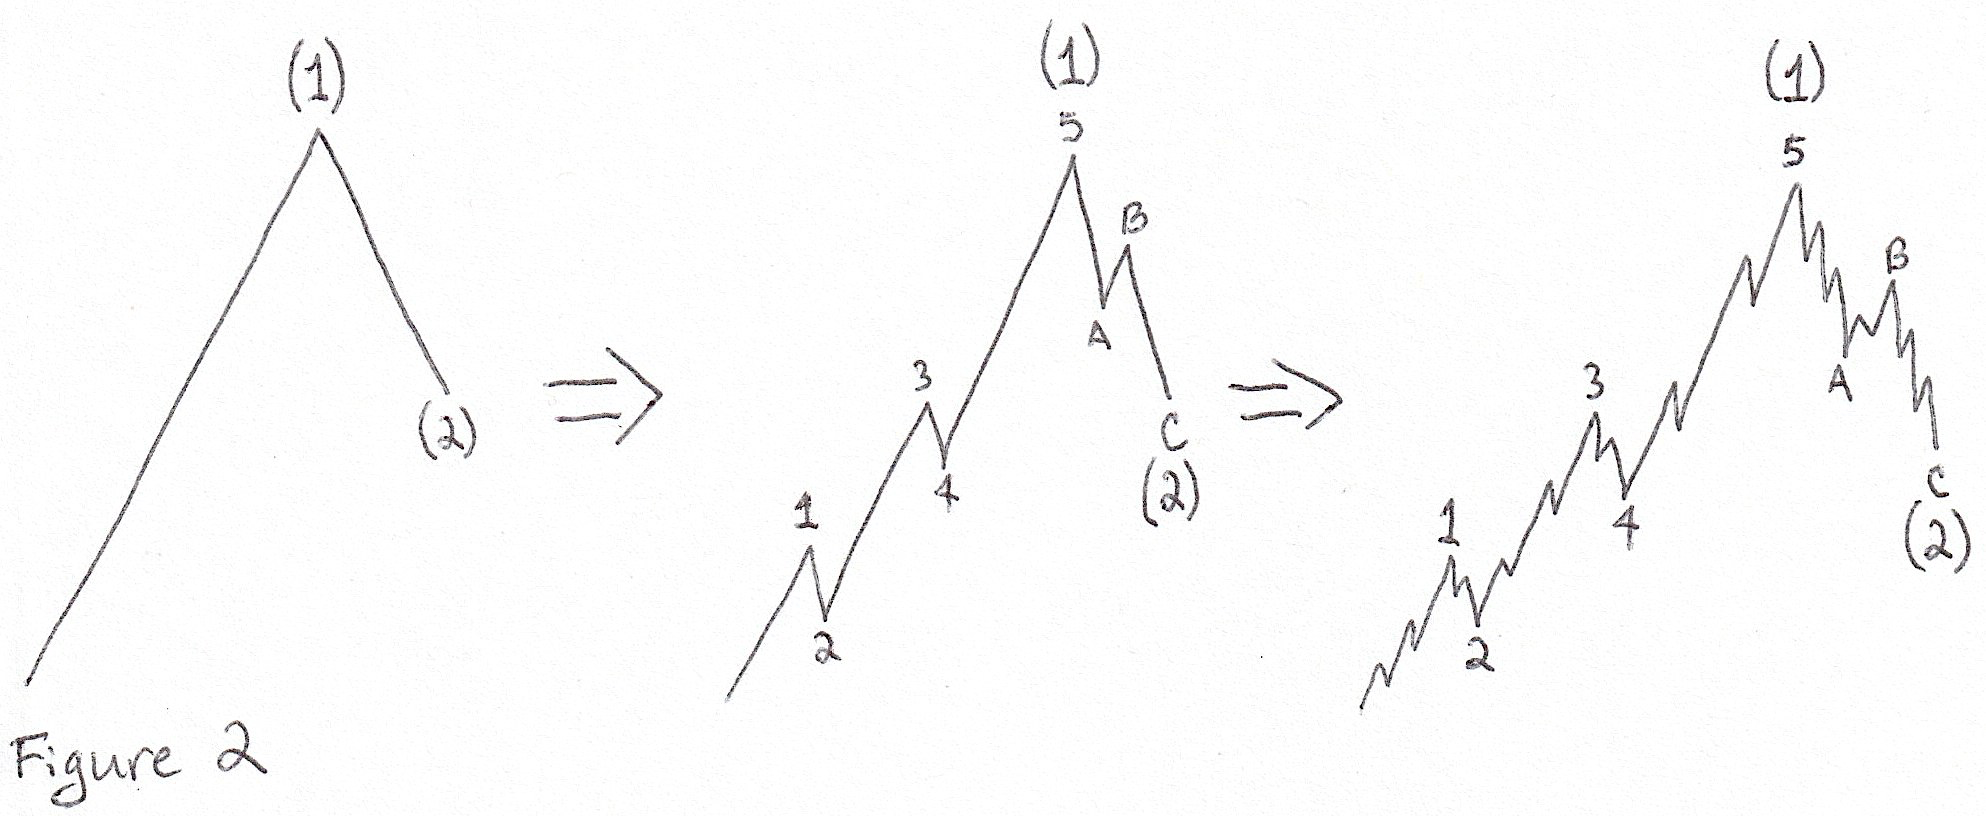
Every wave is both part of a larger wave and composed of smaller waves as can be seen in Fig. 2. In this figure, the trend is up (the price ends higher than it starts), so wave (1) is an impulse because it moves up with the larger trend. Wave (2) is a correction because it moves down against the trend. Waves (1) and (2) subdivide the same as in Fig. 1 and then those waves subdivide one level further. Waves 1, 3 and 5 move in the same direction as wave (1), so they are impulse waves and thus subdivide into five smaller waves. Waves 2 and 4 move down, against the direction of wave (1), so they are corrections and subdivide into three waves. Waves A and C are subdivisions of wave (2). They move down, in the same direction as wave (2), so they are impulses and subdivide into five waves. And finally wave B is a correction, subdividing into three waves because it moves up, against wave (2). So, whether a wave subdivides into three or five does not depend on whether it moves up or down, but whether it moves with or against its parent wave.
There are a number of rules and guidelines governing how to correctly count these waves in actual markets. There is plenty of literature online and books covering Elliot Wave, so I won’t go into all the details here. I’ll only cover a few that I have found to be most important.
Rule 1: The end of wave 2 in an impulse can never extend beyond the beginning of wave 1.
Rule 2: The end of wave 4 in an impulse can never extend beyond the beginning of wave 2.
Rule 3: Wave 3 is never the smallest wave in an impulse.
Guideline 1: Corrections tend to be choppy, overlapping and hard to count.
Guideline 2: Impulses tend to be clear, dramatic and easier to identify than corrections.
There are many more details and subtleties to Elliot Wave than what I have covered in this post. As the need arises, I will delve into these details as we analyze the Bitcoin market in future posts.
Combining a sense of where investor psychology is (optimistic or pessimistic) with a clear wave count can yield a moment’s confidence in the future direction of prices, but it takes patience, humility (no one is right every time) and a willingness to be decisive.
On Charts
Every week I have several Bitcoin charts sent in to the prison so I can do my analysis and stay up-to-date. They take a few days to get to me and a few days to get back and put up online, so everything you see is at least a week out of date. This is fine though because we will only be looking at large movements in the market on the scale of months, years and even decades. My analysis should still be relevant regardless of what has happened while it’s in the mail, but I will be mindful of this limitation and make note of scenarios that could play out during that time just in case.
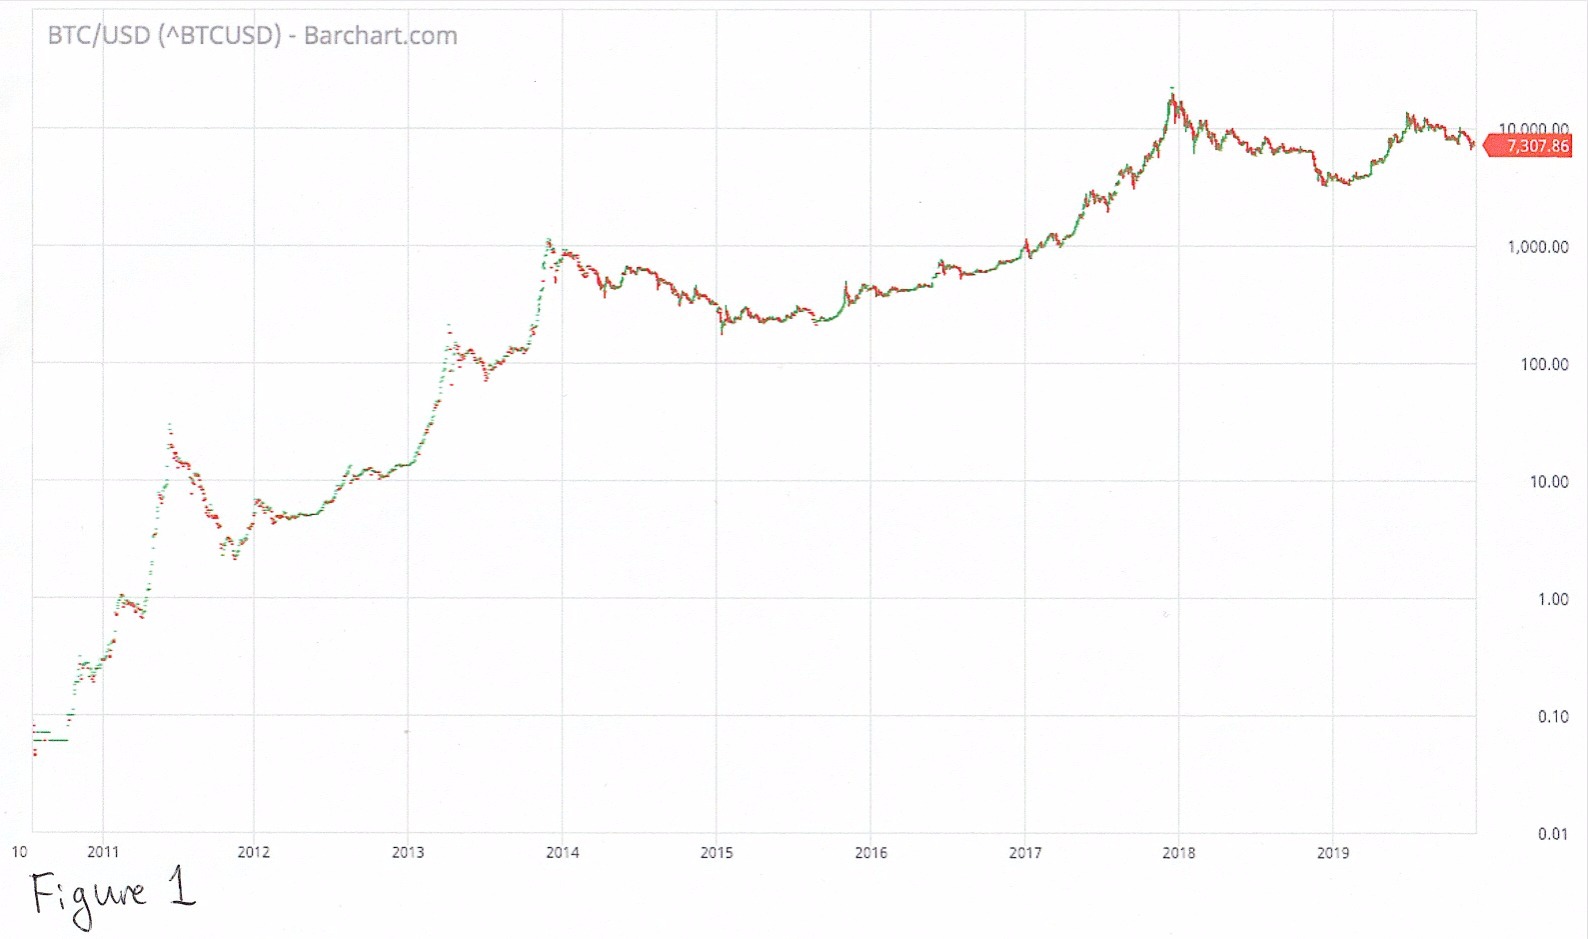
The charts we will be looking at show the price of a bitcoin in US dollars over time. (See Fig 1). We are looking at the price in dollars rather than euros or anything else because the highest volume of trade throughout Bitcoin’s history has been in dollars. Our method of analysis, Elliot Wave, is based on mass psychology, so the bigger the market the better.
The charts will be bar charts with the bars set close together. This display shows the full price range at every point, so we can determine if waves overlap (important for Elliot Wave), and it packs in relevant data. I will have to write wave labels and other notes on the charts by hand, but that will be part of the fun.
Finally, the charts will be in log scale. The vertical axis (the price) will increment by powers of ten (10, 100, 1000, etc…) rather than linearly (10, 20, 30, etc…). We do this because the log scale reveals movement in prices relevant to investors, and our thesis is that price movements are driven by the mass psychology of investors.
Let me illustrate with an example. Let’s say you bought $100 worth of bitcoins back when the price was $1. You would have ₿100. If you sold them at $18, you would have ₿1,800 (and you would be very sad today). Now let’s fast forward and the price is $1,000. Again you buy $100 worth, but this time you end up with only ₿0.1. If you sold this at $18,000, you would again have $1,800.
So the move from the $1 to $18 is just as significant as the move from $1,000 to $18,000 because an investor can make the same amount of money from it. On a log chart, these two moves are the exact same size vertically. On a linear chart, the $18 move would be dwarfed by the $18,000 move. You wouldn’t even see it. With the enormous price ranges Bitcoin has been through over the years, linear charts are practically useless for our purposes.
The Big Picture
In case it isn’t abundantly clear yet, the overall trend in the price of bitcoins is up. Bitcoin started its rise from about $0.06 in late 2010 and peaked a couple of years ago at ~$20,000. Bitcoin is special in that we have its complete price history. We have a measure of its value as it went from nothing to something on its way to something big.
This fact is particularly helpful as we apply Elliot Wave analysis to this market. We have an absolute point of origin followed by a clear upward trend, so there is no question of context. What we see is not part of some unseen bigger picture. We have access to 100% of the price information (except future prices of course).
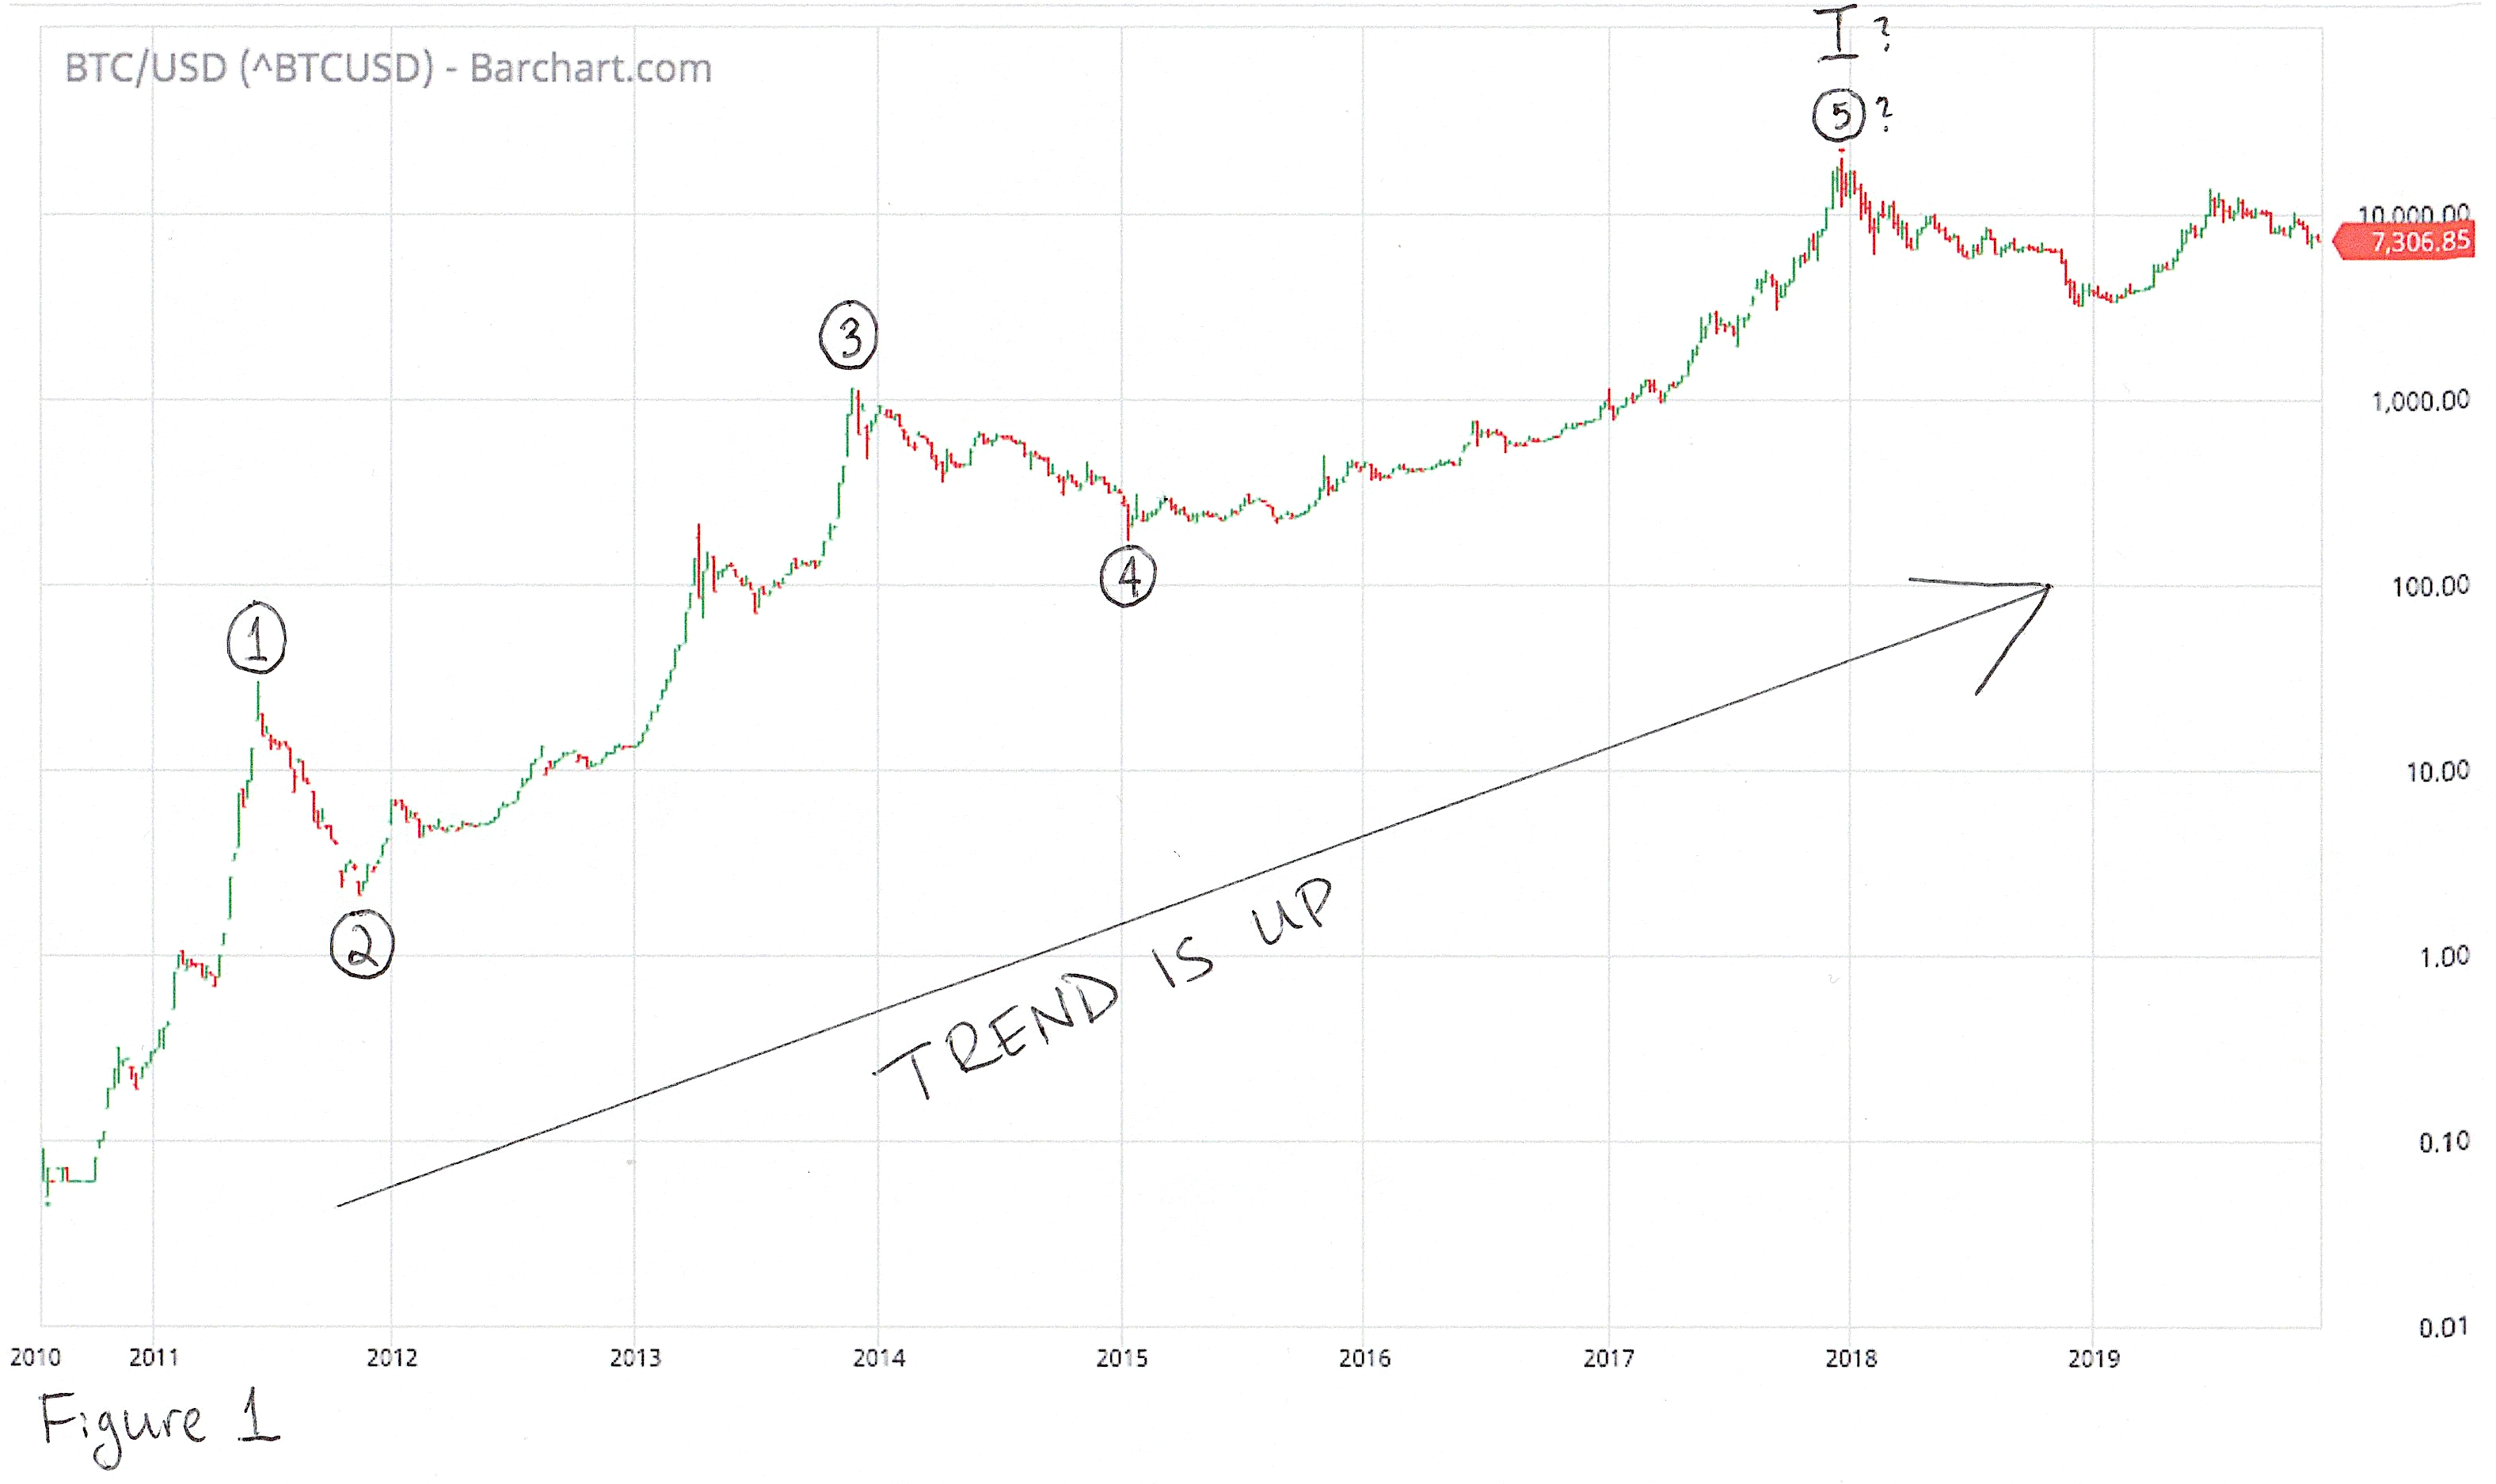
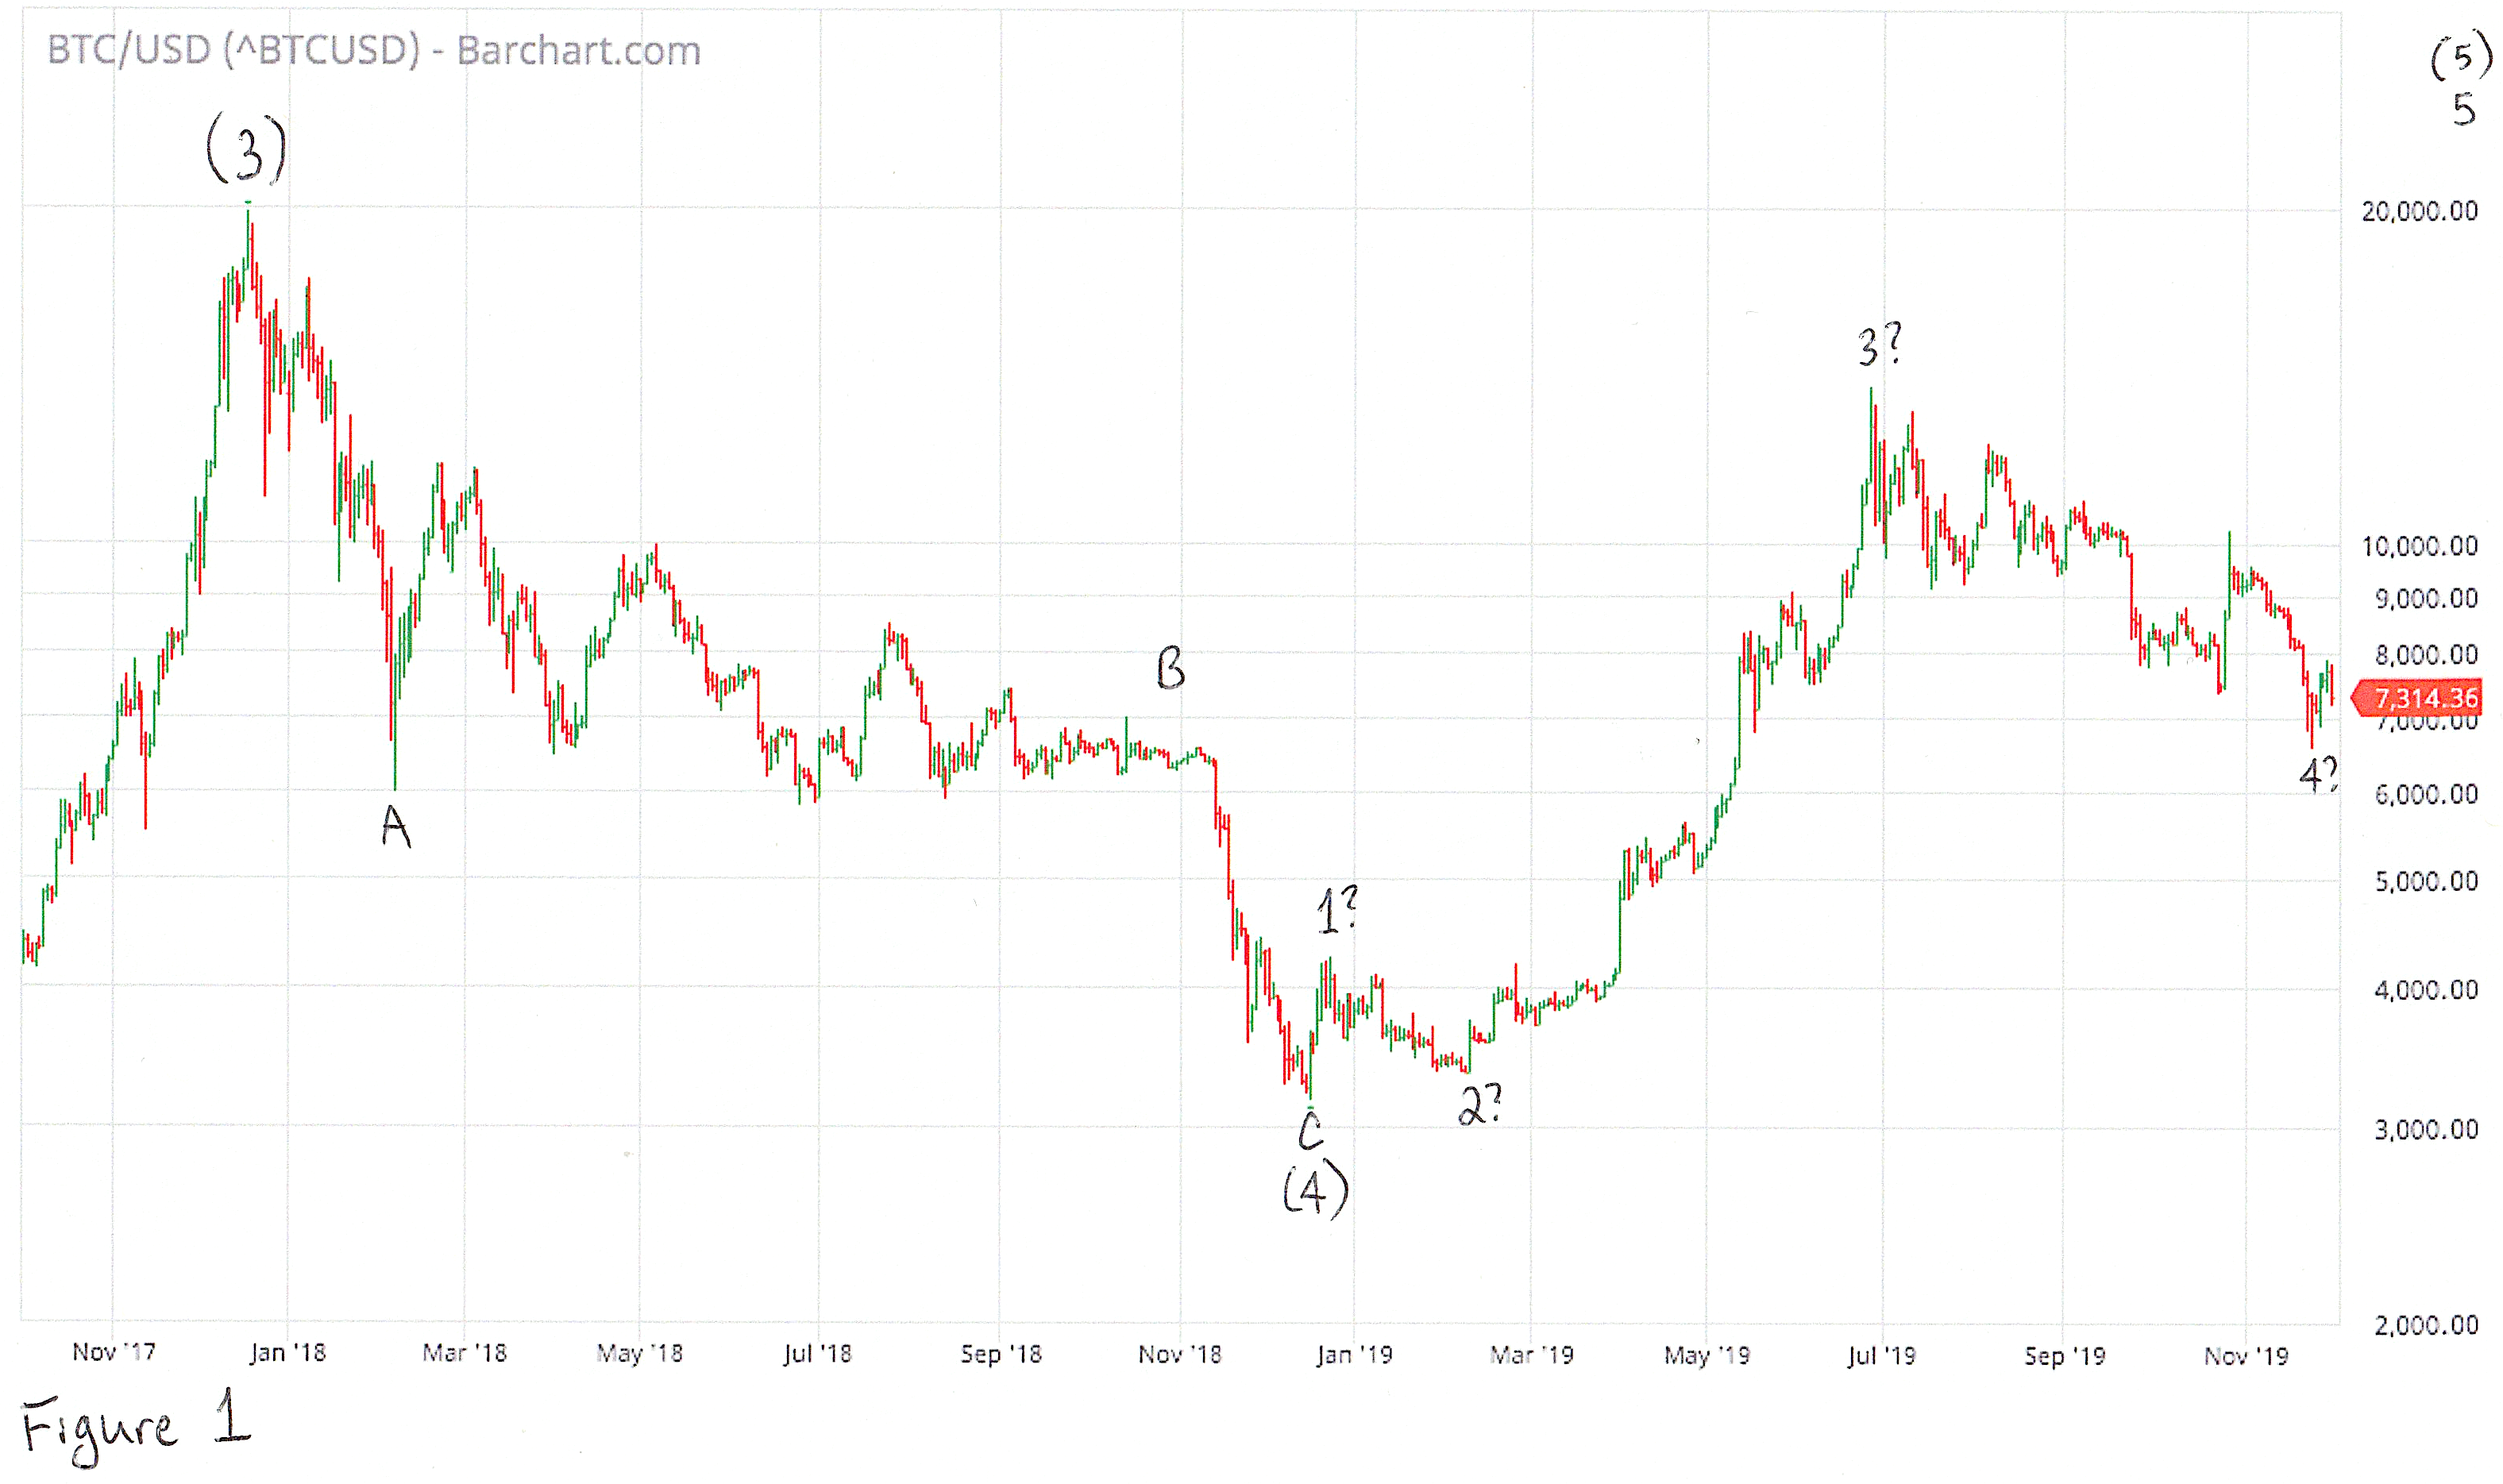
What we see is a classic five-wave subdivision which I have labeled ①, ②, ③, ④ and ⑤ in Fig. 1. The circled numbers are Elliot Wave notation for primary degree waves. The labeling and naming is arbitrary, but this is the labeling typically used for waves of this duration in classic Elliot Wave analysis, so I have used it here. You will also notice an uppercase roman numeral “I” in Fig. 1. This is a label for the first wave of cycle degree (one above primary). It and wave ⑤ have questions marks next to them because we are unsure if where we placed the label is correct.
Wave ①, the first primary wave up, has a clear five-wave subdivision, which is what we would expect from an impulse wave moving in the direction of the larger trend. These five “intermediate” waves are labeled in Fig. 2 as (1), (2), (3), (4) and (5).
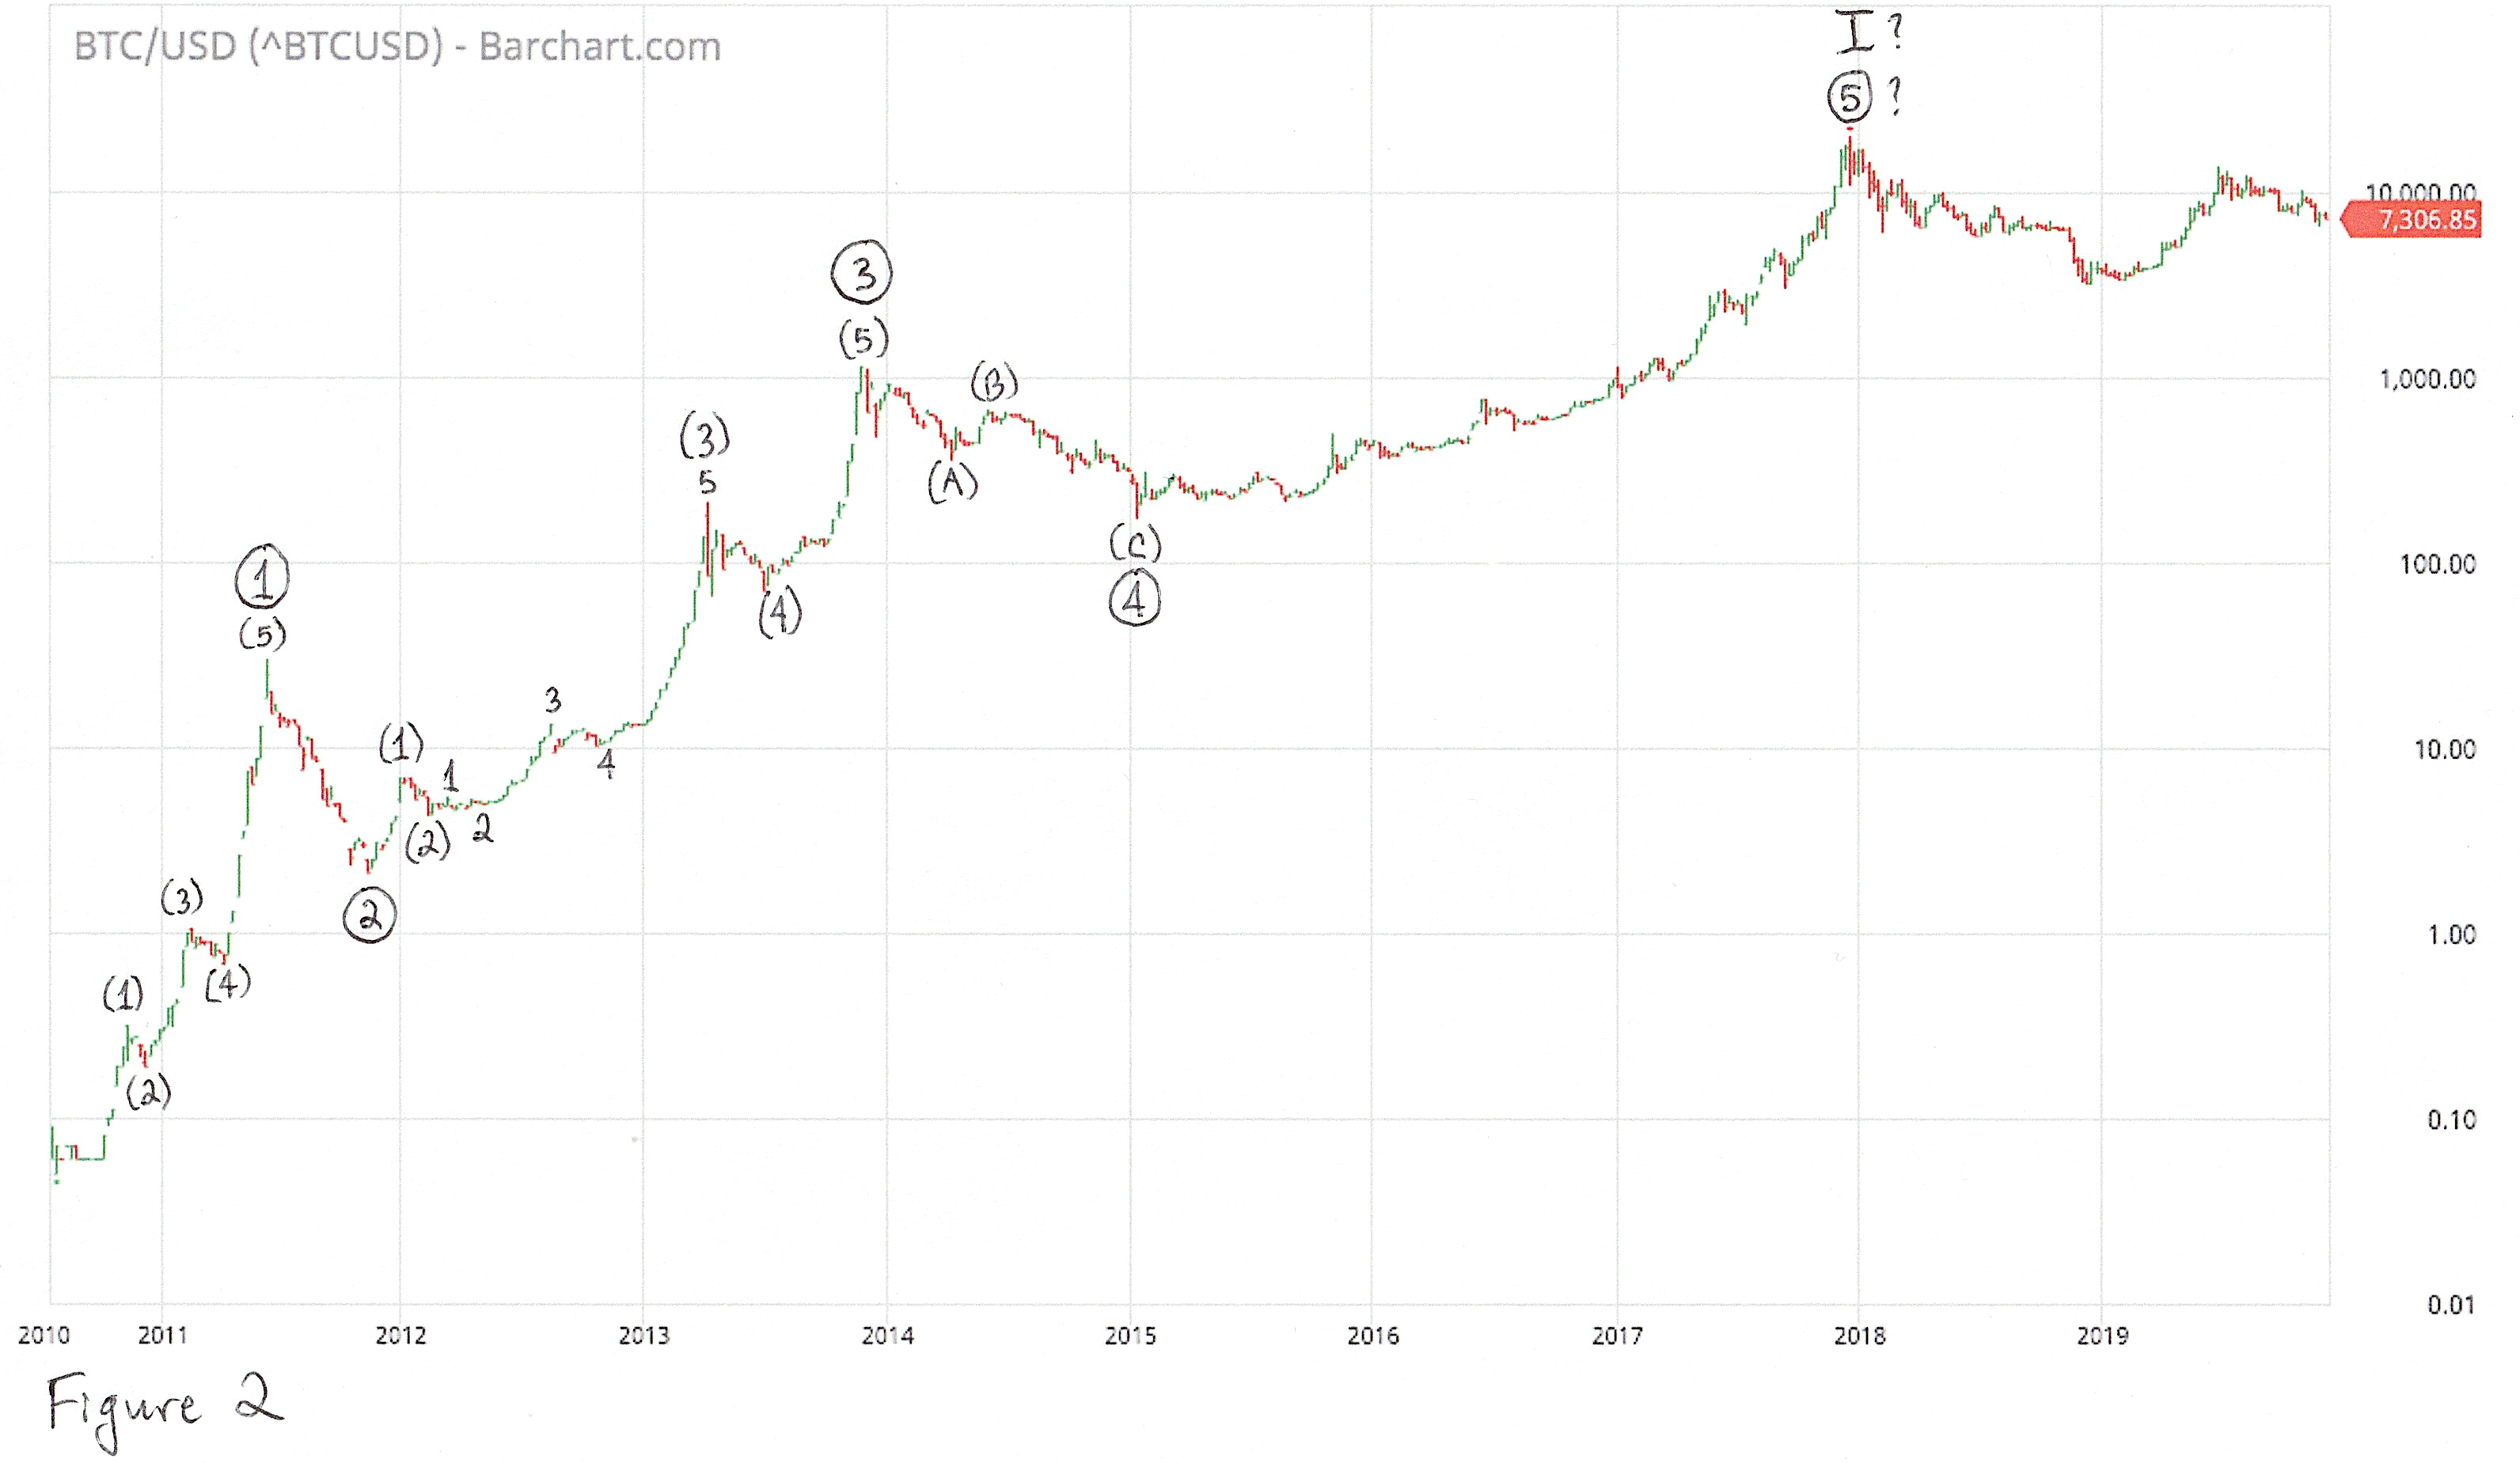
Wave ② is corrective (against the larger trend). Its intermediate subwaves are not clear (as is often the case with corrections), but overall it is a strong correction, erasing over 90% of the gains from wave ①.
Wave ③ does not have as clear a substructure as wave ①, but is definitely an impulse, taking the price from low single digits to over $1,000. Its impulsive subwaves also have the thrusting, exponential look of impulse waves. The tricky part here is determining exactly where one intermediate subwave ends and another begins. The way we have it labeled in Fig. 2, we have what’s called an “extended 3rd,” which is not uncommon as the 3rd wave is often the most powerful wave in an impulse. This makes intermediate waves (1) and (2) of ③ look small, compared to wave (3). Some of waves (3)’s “minor” subdivisions (1, 2, 3, 4 and 5 in Fig. 2) are even bigger than waves (1) and (2). That’s ok. First and second waves are often this way because, as they unfold, the transition to an impulse has not been recognized, and there is still latent pessimism from the previous correction suppressing prices.
Finally, let’s look at wave ④. This is a classic “zig-zag” correction with a three-wave subdivision labeled (A), (B), (C) in Fig. 2.
Waves ① through ④ are complete, so the challenge we are faced with now is analyzing wave ⑤ when we are unsure if it has finished unfolding. Counting waves in hindsight is fairly straightforward. Counting them as they develop is much more challenging, but much more rewarding. A correct count before a wave is finished puts you in a position to predict future prices.
End of a Cycle or Room to Run?
We talked about the big picture of Bitcoin’s meteoric rise in value and a method of analyzing it called Elliot Wave. Now we will zoom in on what appears to be the 5th and final primary wave of the first cycle wave up in Bitcoin’s price. We know where it began: at the end of the wave ④, at the major low in 2015 around $175. From there we see an exponential advance over nearly three years up to the current all-time high of ~$20,000 (see Fig. 1).
This is the wave that got the most attention from the mainstream. By its end, Bitcoin was on everyone’s lips, and optimism about its prospects and future prices was bubbling over. It has since been in a corrective pattern for nearly two years.
There are several ways to interpret the structure of wave ⑤, each with different consequences. First though, let’s look at the move from the end of wave ④ to the ~$20,000 peak. It is difficult to count the intermediate and minor subwaves because there are so many that could qualify. I count no less than 15. Clearly there are extensions and extensions within extensions at play. Luckily, we don’t have to know the correct count of wave ⑤’s subwaves in order to make some useful conclusions about it.
One thing we can be confident of is that the move up to $20,000 from the end of wave ④ is not intermediate wave (1) of ⑤. It is much too large for this, in both duration and price range, compared to previous intermediate waves. thus, if wave (1) of ⑤ ended before the ~$20,000 peak, so must wave (2) down. Wave (3) then must either take us to the peak or end short and waves (4) and (5) get us there.
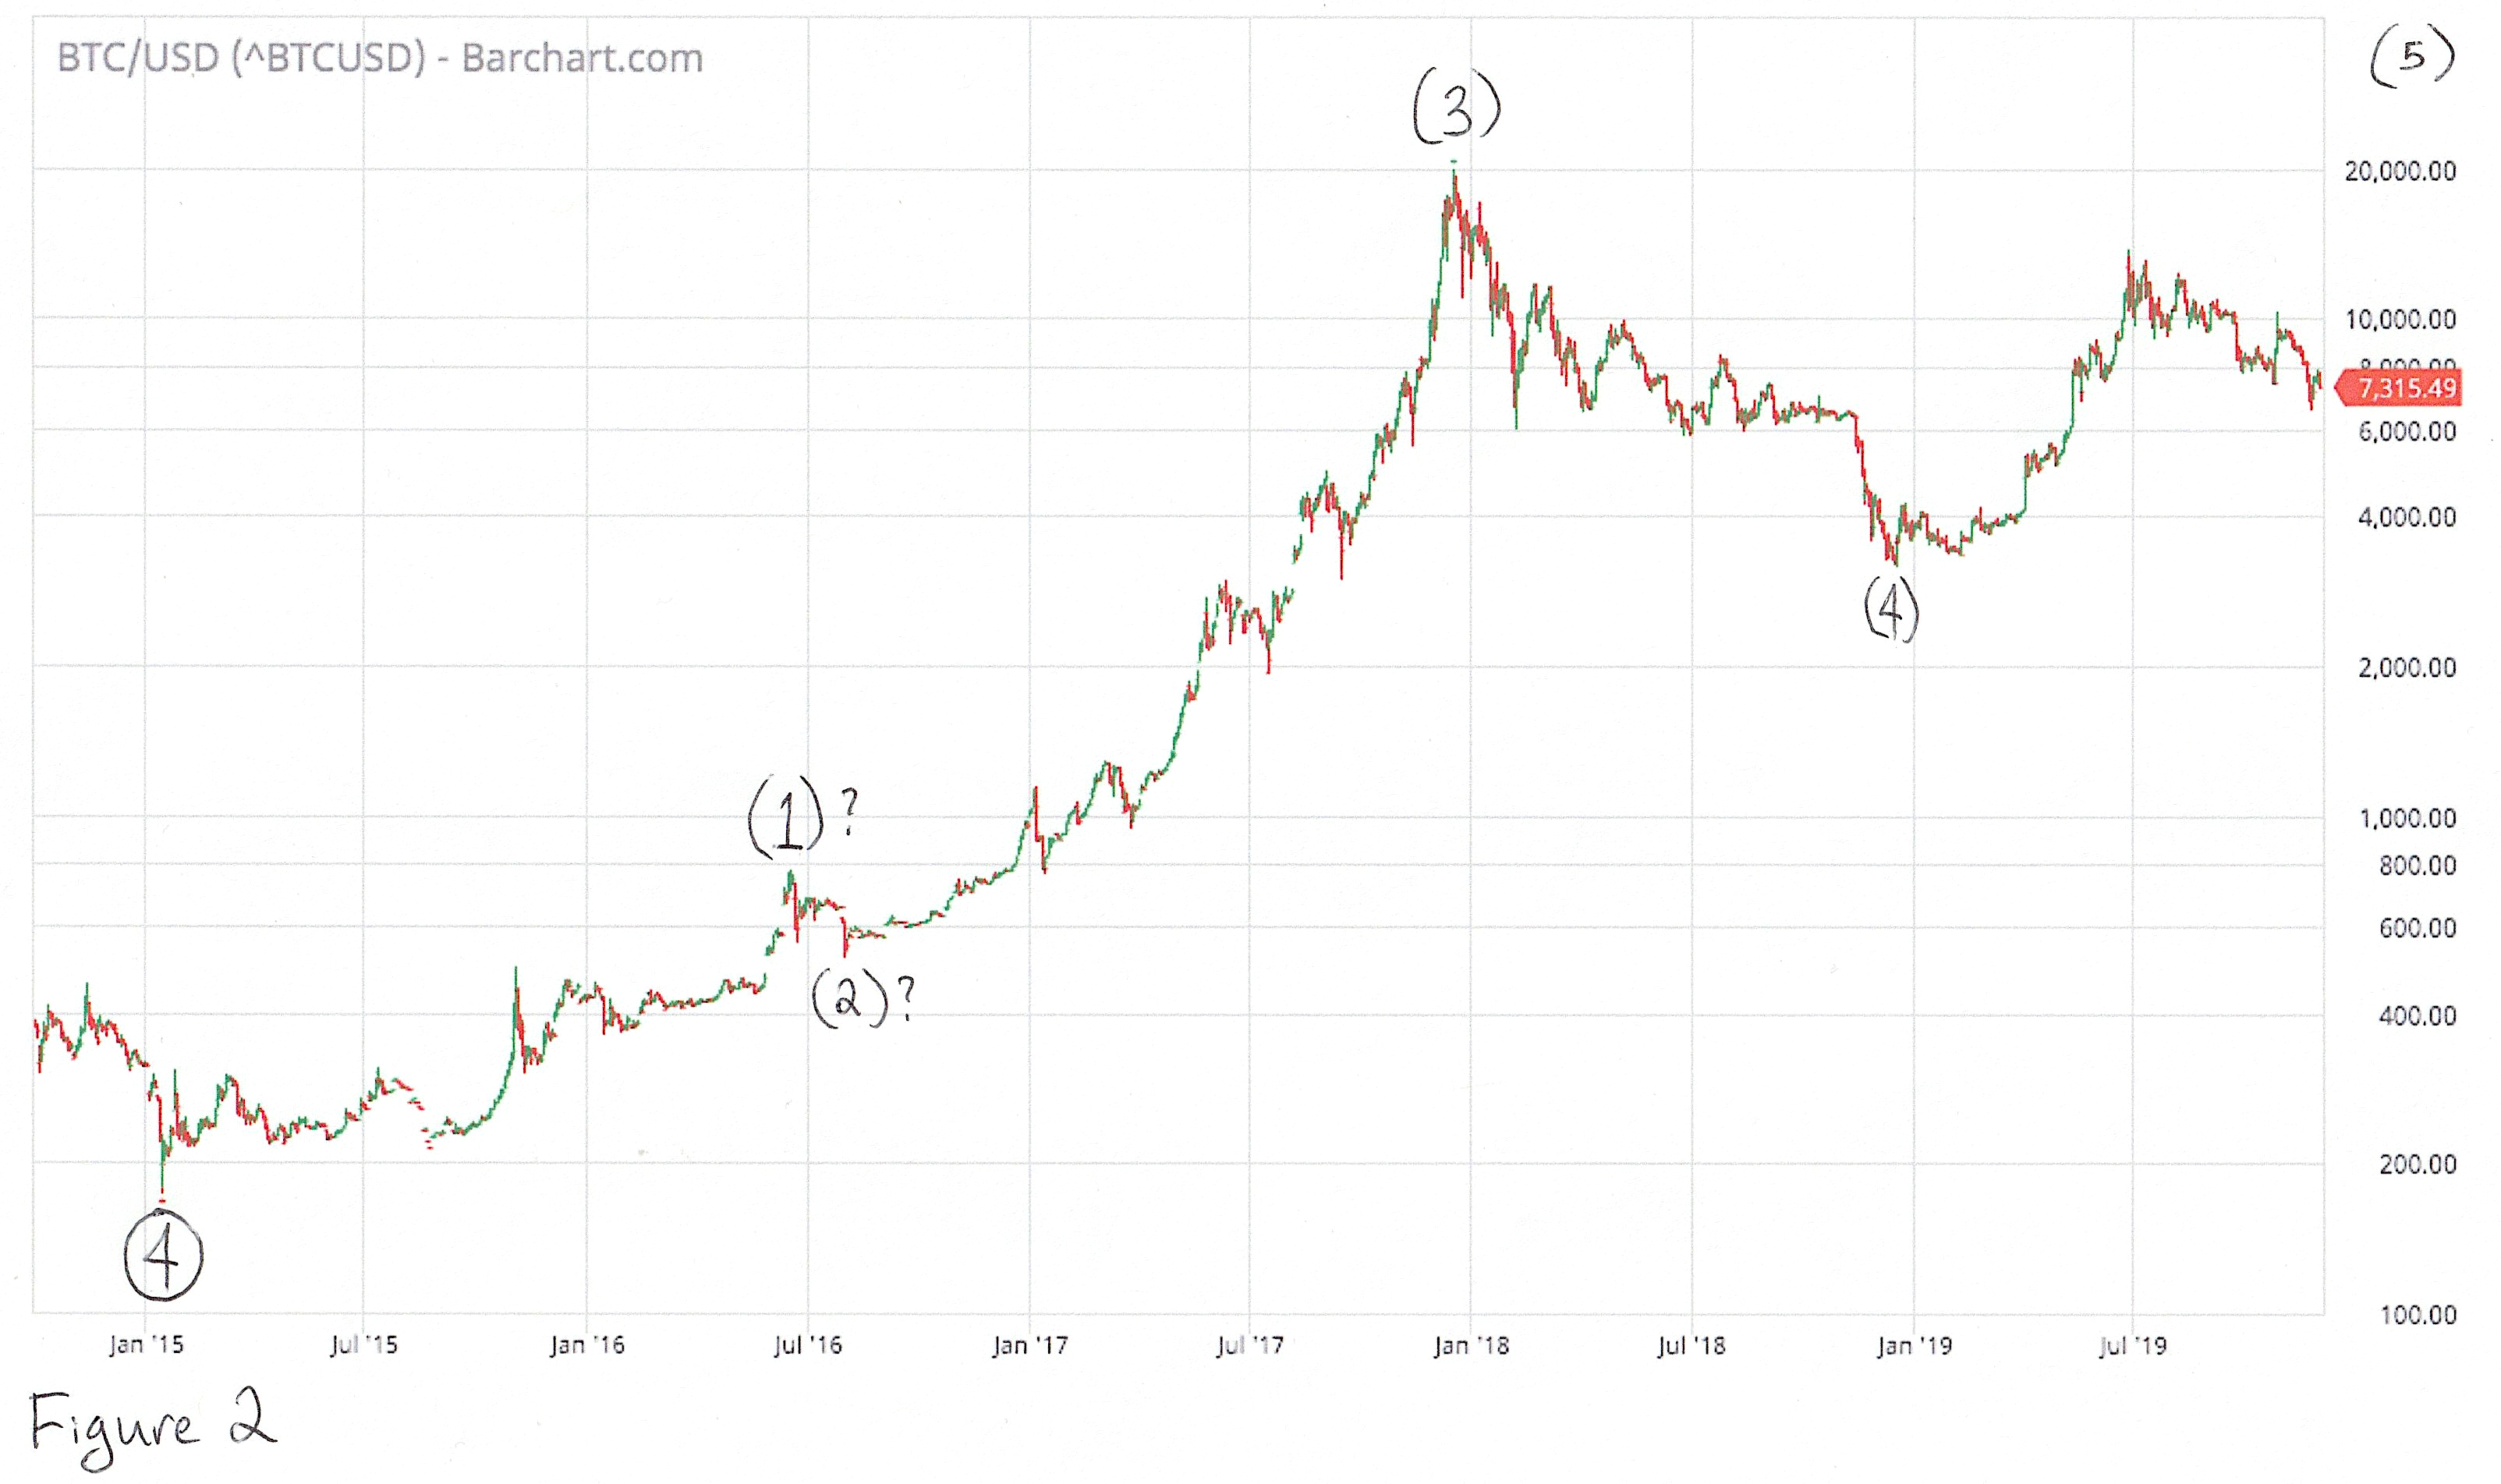
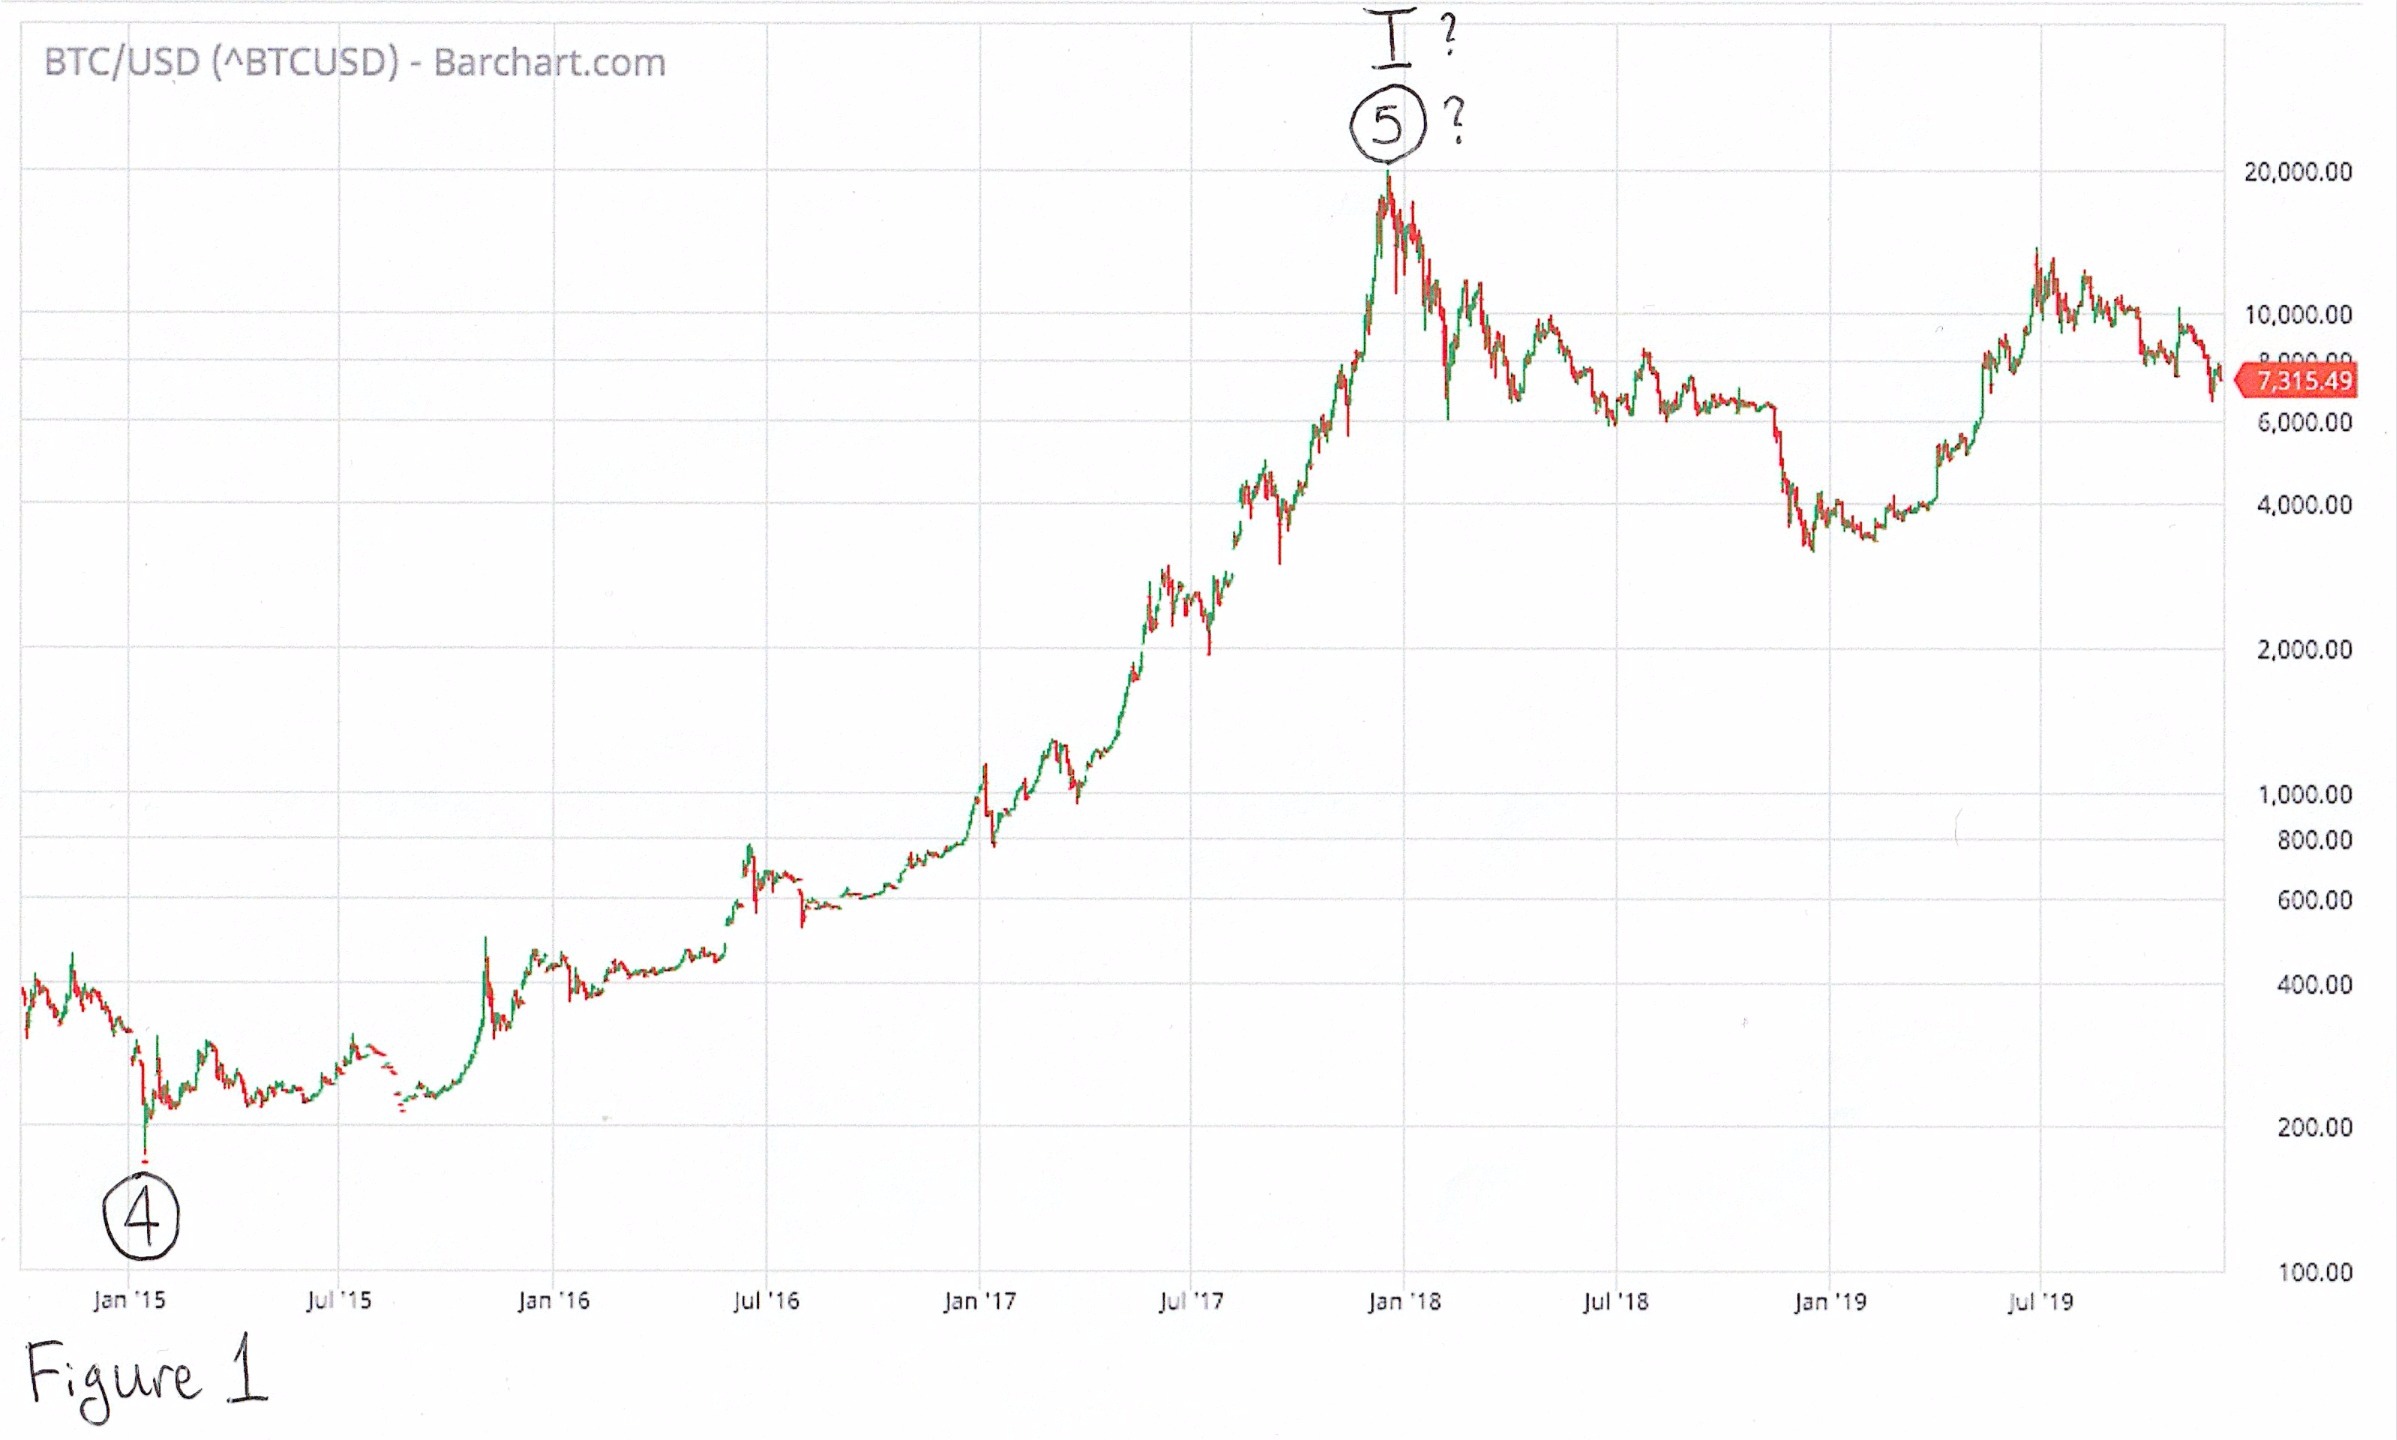
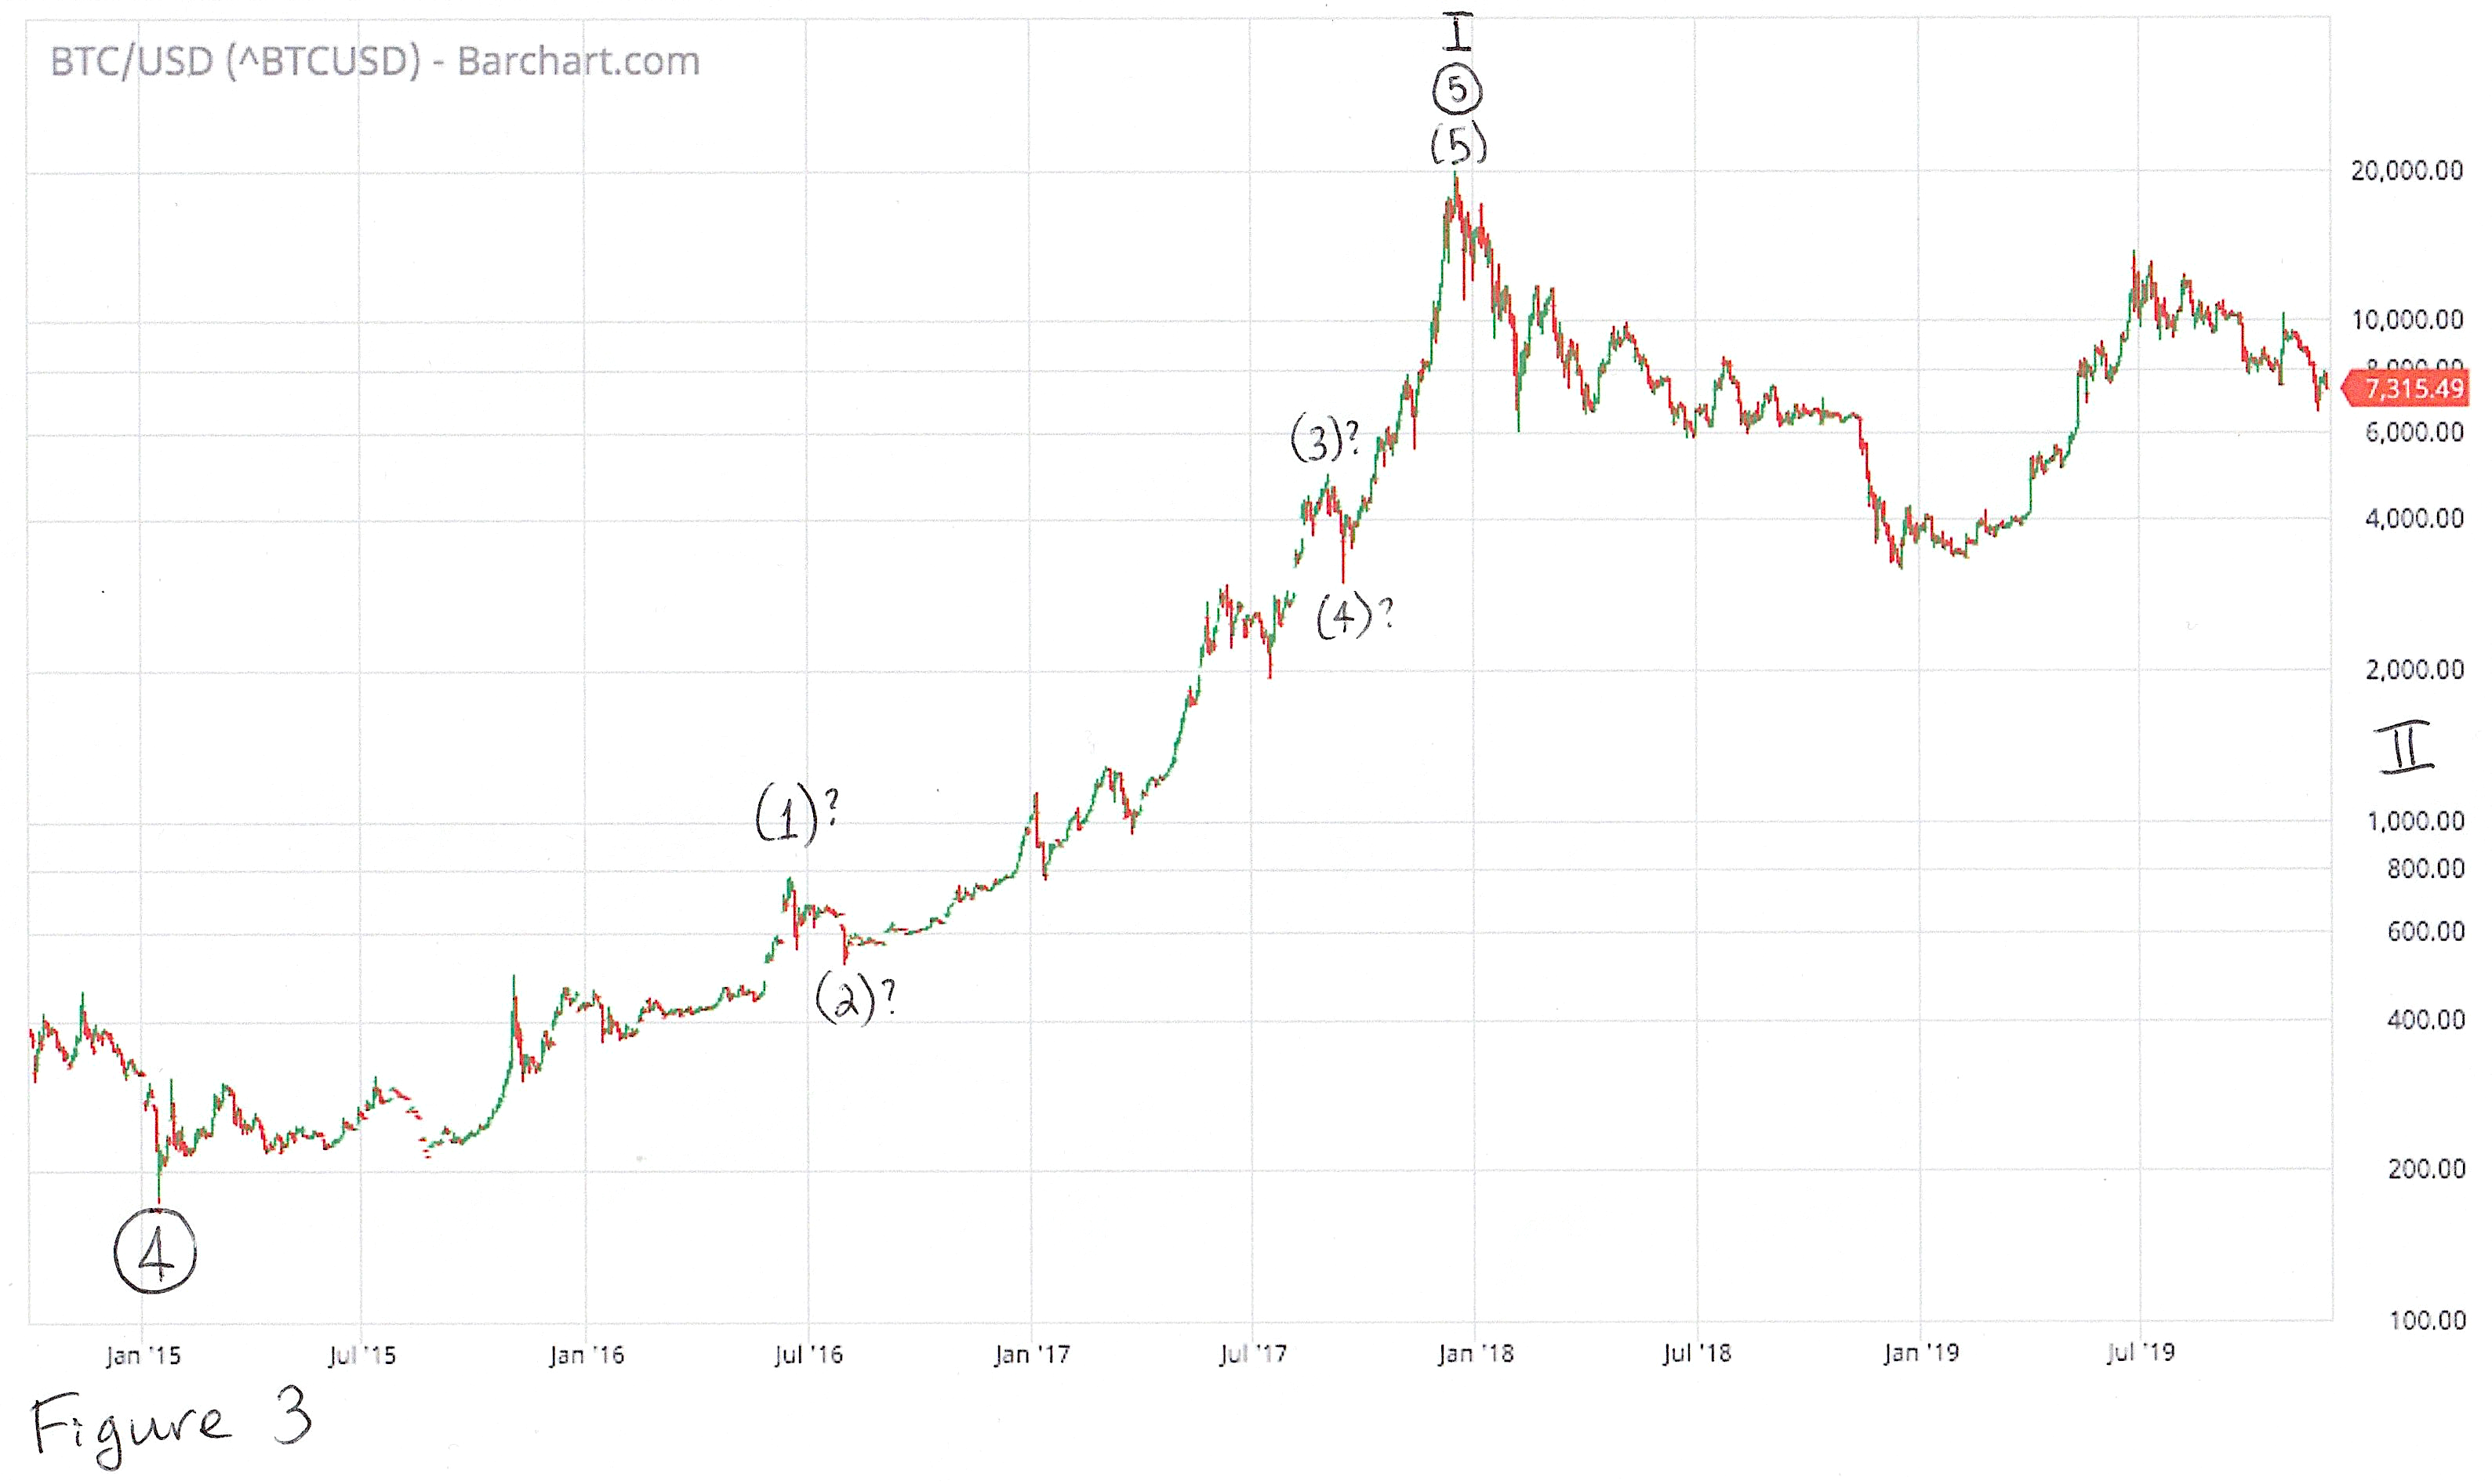
If the ~$20,000 peak is the end of wave (3), then the correction pattern we are in (or just came out of) is wave (4), and we can expect wave (5) to take us to new all-time highs (see Fig. 2). However, if the peak is the end of wave (5), it is also the end of primary wave ⑤, which is the end of cycle wave I. This interpretation means the correction we are in is the biggest we have seen in Bitcoin’s history, one that is correcting the entire move up from the beginning (see Fig. 3).
There are three factors we need to recognize that will help us determine how much weight to give these two possible interpretations. The first two concern the size and shape of wave ⑤ compared to the two other impulse waves in wave I: waves ① and ③. The third concerns the wave structure since the ~$20,000 peak which I will save for my next post.
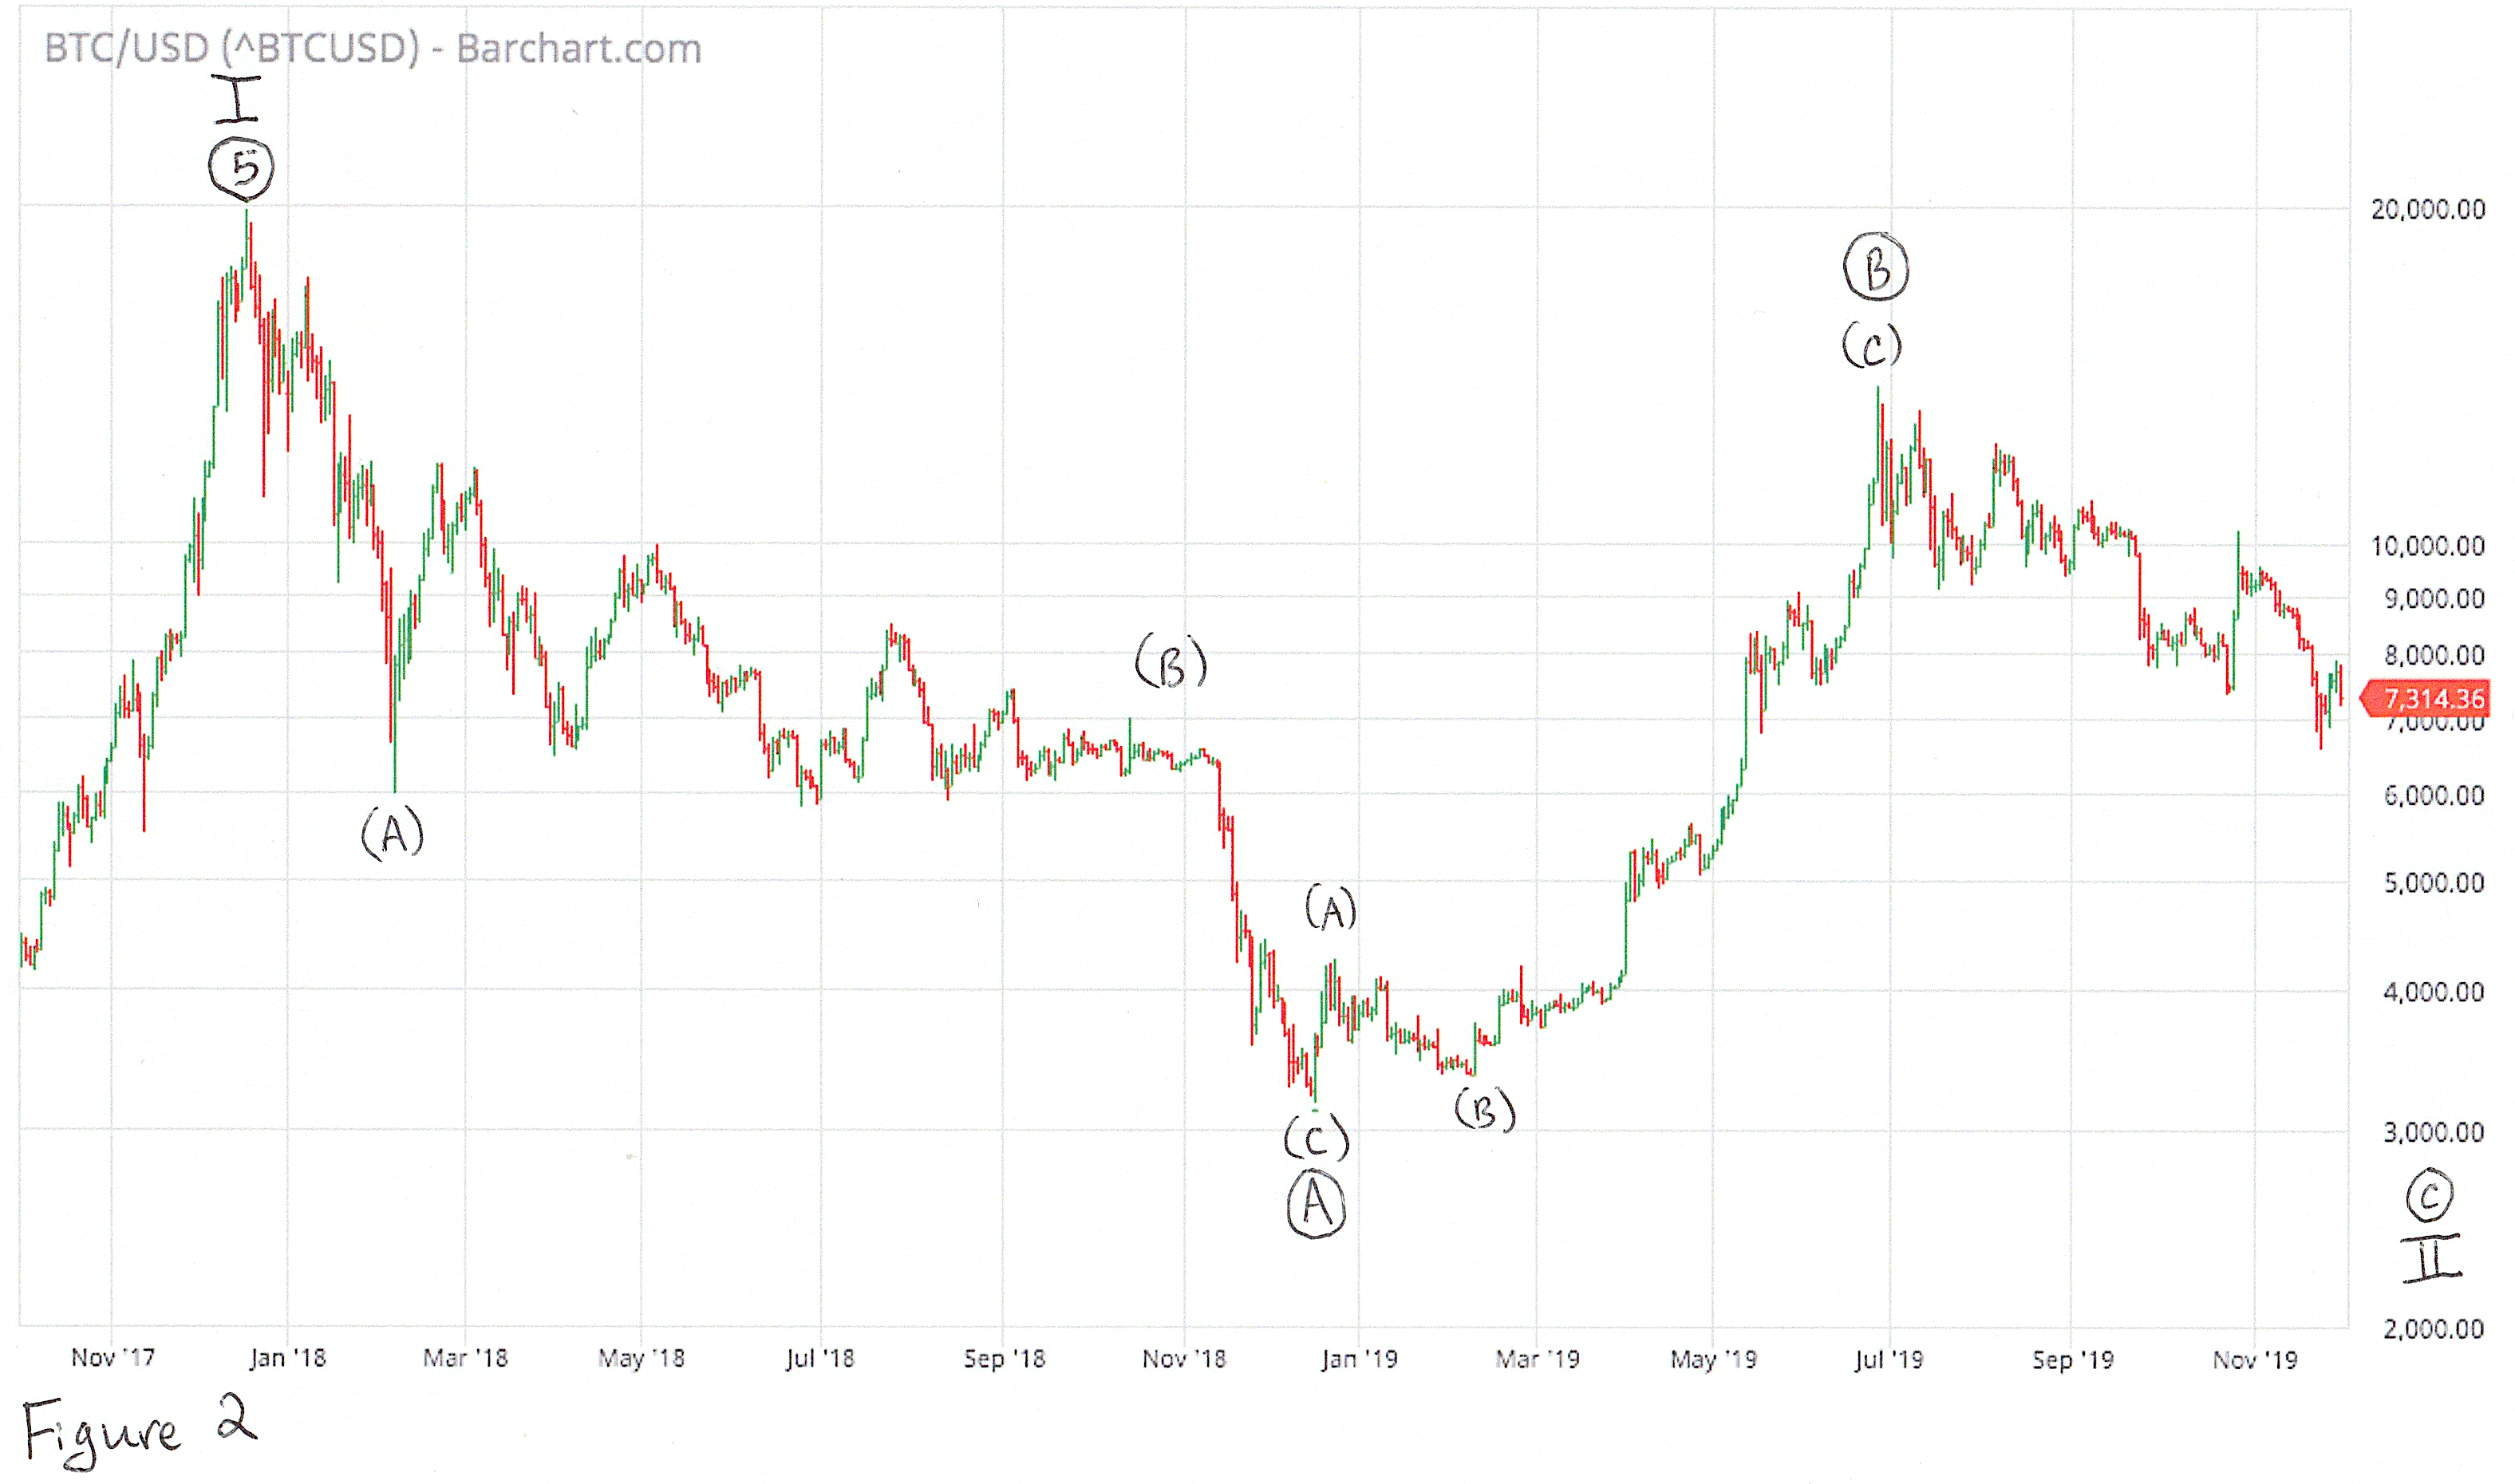
Let’s first look at the price ranges of waves ①, ③ and ⑤. Wave ① started at $0.06 and advanced to ~$32 for an increase of ~53,000%, or ~530x. Wave ③ started at ~$2 and advanced to ~$1,240 for an increase of ~620x. Wave ⑤ started at ~$175. If we count the ~$20,000 peak as the end of wave ⑤, that’s an increase of ~110x. This is enormous for virtually every other asset in history, but it is only a fraction of the moves of waves ① and ③. If the price move of wave ⑤ was on par with ① and ③ (530–620x), it would have to end around $93,000-$109,000. Thus, if our interpretation that wave ⑤ is not over, and the ~$20,000 peak was just wave (3) of ⑤, then a good target for the end of wave (5) of ⑤ of I is around $100,000 (See Fig. 4).
Now let’s look at the durations of waves ①, ③ and ⑤. Wave ① began on ~10/1/2010 and lasted until 6/9/2011 for a total duration of ~251 days. Wave ③ began on 11/18/2011 and lasted until 11/29/2013 for a total duration of 742 days. Wave ⑤ began on 1/14/2015. If we count the ~$20,000 peak as the end of ⑤, then it lasted until 12/17/2017 for a total duration of 1,068 days.
From these three primary impulse waves, we see a pattern of increasing duration. The two primary corrective waves (② and ④) also show an increase in duration. In fact, a quick visual inspection of the total price history of Bitcoin on a log scale reveals an unmistakeable “stretched” look, with price fluctuations in general taking longer and longer to unfold (see Fig. 4).
A natural question could be, “what is the rate of this stretching?”, the answer to which would give us a time estimate for the end of wave ⑤ and thus wave I. If we compare the duration of wave ③ to the previous impulse (wave ①), we see that ③ lasted ~3x longer than ①. And if we compare the duration of wave ④ to the previous correction (wave ②) we see that ④ lasted ~2.5x longer than ②. If wave ⑤ is still unfolding and follows this pattern by being proportionally longer than the previous impulse (wave ③) by 2.5–3x, then it should last until sometime between 12/1/2019 - 2/17/2021 (see Fig. 4).
Thus, we have a price and target for the end of wave I of ~$100,000 some time in or near 2020. However, there is no rule that market moves have to be proportional. This is just a pattern we see unfolding that may or may not continue. I should also note that these estimates are based on readings of the price of a bitcoin in the distant past. The best I can find are not very precise. If you have more precise numbers, please post them in the comments with your source.
And if wave ⑤ is already over, then these targets are moot. We will look more closely what has happened since the ~$20,000 peak to see if there are any clues as to whether the first cycle wave in Bitcoin is over or if there is another dramatic price increase on the horizon.
From the $20k Peak to Today
The closer we get to the present in our analysis, the more uncertainty there is in where current prices fit into the larger Elliot Wave pattern. The question posed in my last post was whether the all-time high of ~$20,000 in late 2017 was the end of intermediate wave (5) and thus primary wave ⑤ and cycle wave I, or whether it was just the end of intermediate wave (3).
These two scenarios have dramatically different implications for future prices, so we will look closely at how prices have progressed since the peak for clues as to which one is playing out. The difficulty is that we are in a large corrective pattern, which are notoriously tricky to analyze. The effort should be worthwhile though if we can identify some high-probability outcomes and specific points where our analysis will be negated or confirmed.
Let’s look first at the scenario where the ~$20,000 peak is at the end of wave (3) (Fig. 1). This means that primary wave ⑤ (one degree higher) is still playing out and we should see prices move to new all-time highs. Thus, the next major correction — the move down from ~$20,000 to ~$3,200 in late 2018 — is wave (4) (a three-wave correction) and the move up since then to above $13,000 is the beginning of wave (5). This wave count conforms to the Elliot Wave rules and guidelines, but it does have one drawback: compared to previous corrective waves of intermediate degree, wave (4) is massive. In fact, it lasted longer and nearly as long as waves ② and ④ which are higher degree, and it reduced prices by ~84%.
However, as we saw in my last article, all waves have been taking longer and longer to unfold, so perhaps wave (4)’s duration is not as dramatic as it seems. It is a correction of wave (3) after all, and wave (3) was massive too.
So, assuming we have labeled wave (4) correctly, is wave (5) unfolding as we would expect? So far it is, with two minor impulse waves (1 and 3) and two minor corrections (2 and 4), though it is too early to be sure of this count because these waves may be part of extensions. Regardless, a rise in price above the recent high over $13,000 would be a strong indication that our count is correct and the final push of cycle wave I is under way. A drop below the beginning of wave 2 (around $4,200) would invalidate the impulsive count of wave (5) because wave 4 cannot overlap wave 2. This would indicate a much greater likelihood that our second scenario is playing out.
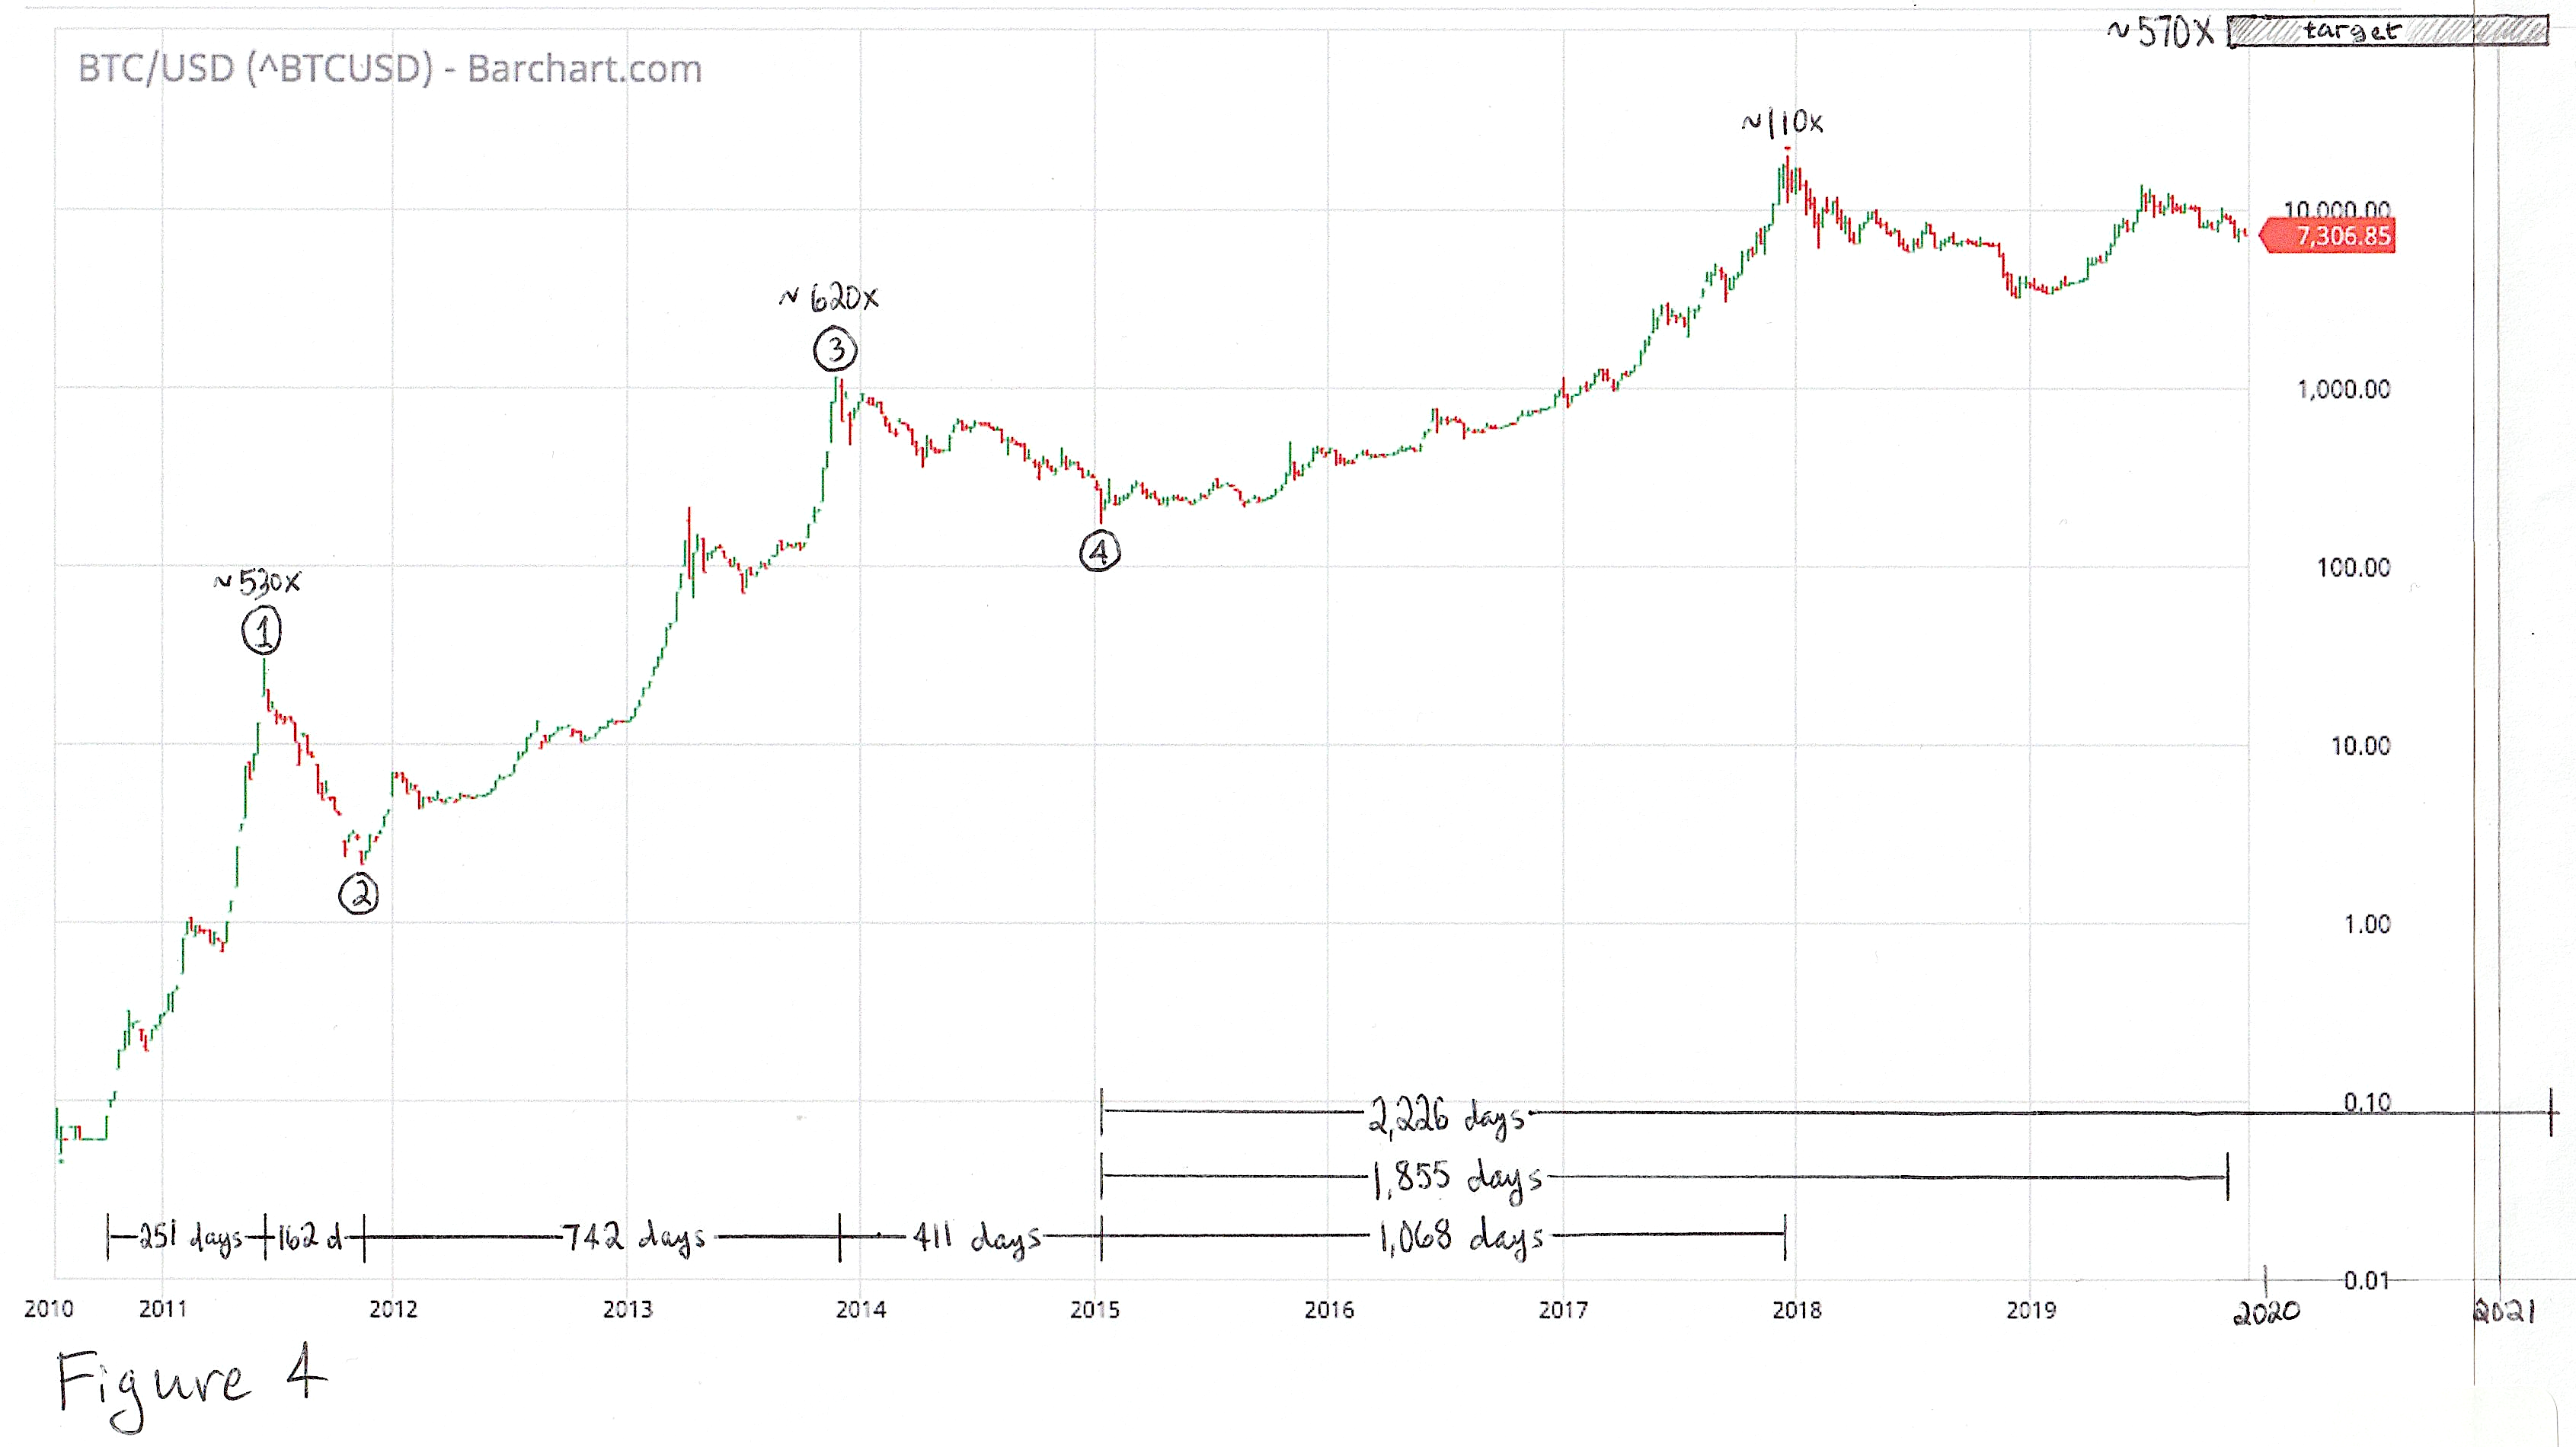
That scenario is that the ~$20,000 peak was the end of intermediate wave (5) and thus waves ⑤ and I (see Fig. 2). Cycle wave I is the entire move up from Bitcoin’s beginning, so if that is over, it means the price action since then is part of cycle wave II which will correct everything we have seen so far in Bitcoin. It will be the largest correction to date and will likely be accompanied by extreme pessimism for Bitcoin’s future.
If that is the case, the move down to $3,200 from ~$20,000 is wave Ⓐ, the first of the three waves in wave II, while the move from ~$3,200 to above $13,000 is best counted as Ⓑ, though it may be a little early to count Ⓑ as finished. Both divided into three subwaves. This is allowed in Elliot Wave as part of a pattern called a “flat.” The next major move then would be wave Ⓒ down unless something more complex is unfolding, which can happen in big corrections.
Regardless, prices will very likely fall below $3,200 and there is no hard limit to how low they can go (except $0 of course). The Elliot Wave guideline puts the price target in the range of the previous fourth wave of one less degree (i.e wave ④ of I), which had a price range between ~$175 and ~$1,200. We can’t say for sure because we have never seen a cycle-degree correction in Bitcoin, but past primary degree corrections (waves ② and ④ of I) ended above or near the top of their guideline range. So maybe wave II will also and won’t fall below $1,500 or so.
Whether we are in it now (our second scenario), or there is one more stab into new highs with wave (5) (our first-scenario), wave II will come. As noted, it will likely be accompanied by extreme pessimism and antagonism toward Bitcoin. Long-time hodlers may capitulate and sell out. Businesses and governments may reject it. Some may call it “dead.” But so long as bitcoins are still being traded and the system remains technically sound, the end of wave II could be the best buying opportunity we will see for a very long time, perhaps ever again.
There is a third wave count that, while technically allowed, my gut tells me is not correct. This count puts the ~$20,000 peak as the end of wave I and the move down to ~$3,200 as the entirety of wave II. This wave II is puny and not commensurate with the spectacular drama of wave I. As amazing as the rise of wave I has been (Bitcoin’s history to date), I expect wave II to be equally shocking, though the negative emotions of fear, panic, pessimism and rejection will replace the euphoria and FOMO we have seen in wave I.