Bitcoin Trading Theory
Zerononcense
Has anyone ever considered the fact that we could be witnessing one of the most epic double tops ever to occur?
Technically, if we look at the monthly chart — there’s a latent possibility that Bitcoin could touch $20k again (last ATH) before drawing down once more.
There’s also nothing to preclude the price from going on a similar, spectacular run.
Issues With Backward Comparisons
A lot of people bring up the bull market prior to 2017, which occurred in 2013.
But what a lot of people don’t ever mention is that there was a major draw down period during 2013 before the massive bull run in Fall 2013.

From October 2012 to April 2013, there was a 2,806%+ gain in the price for Bitcoin. Price action was actually damn near vertical during this time.
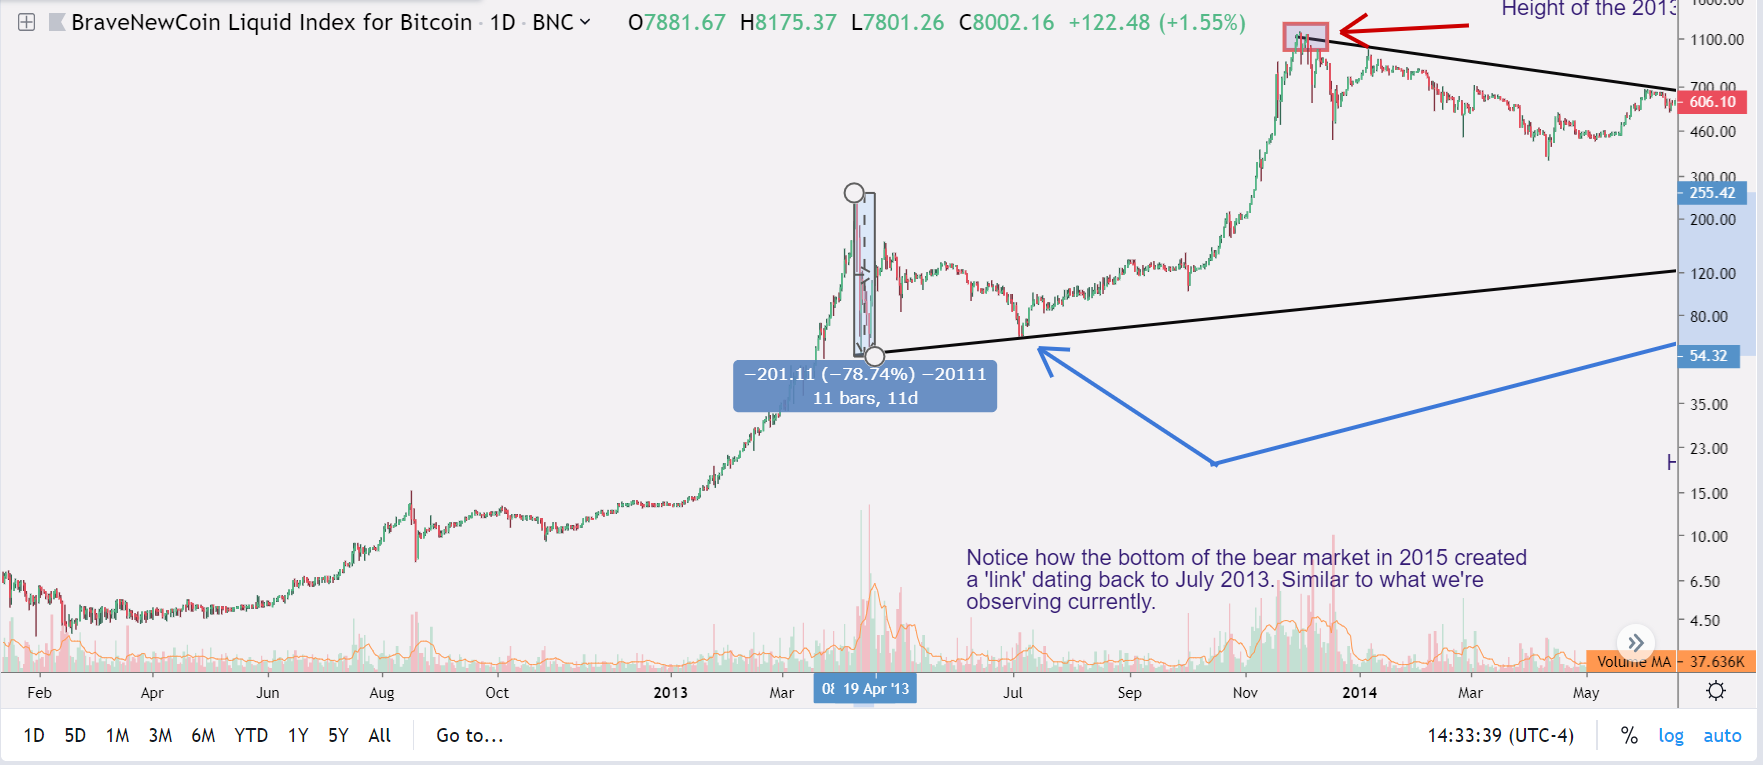
From that localized high, the price drew down -78.74% over the next week and a half.
What’s remarkable is that the price was actually -60% below Bitcoin’s ATH in October 2013 (just two months before Bitcoin shattered its previous ATH)
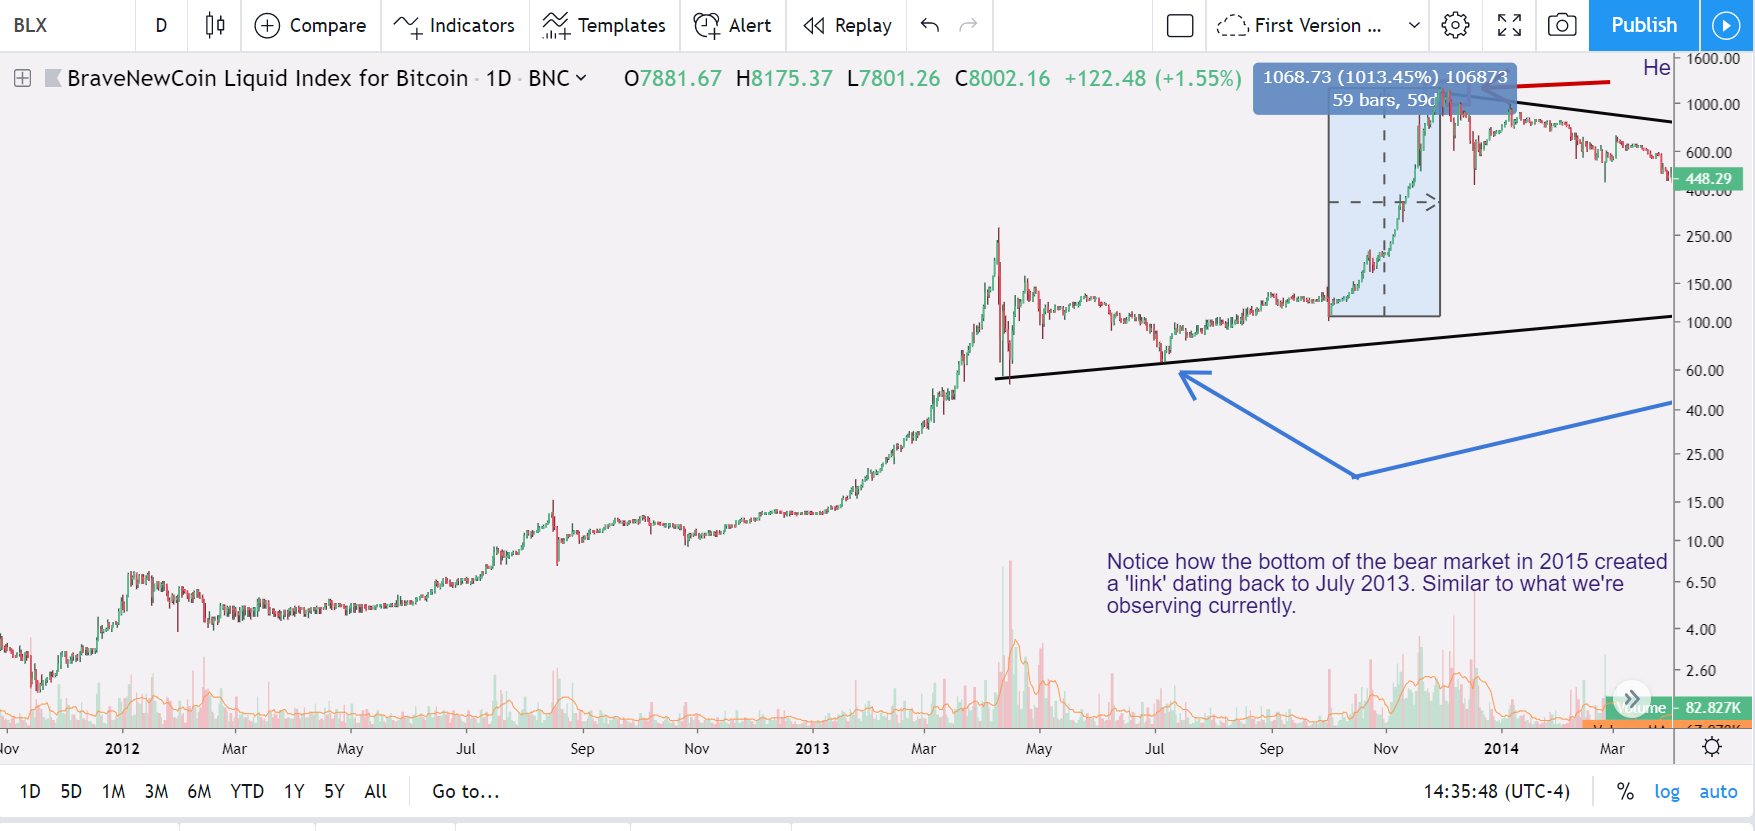
As we can see here, it took Bitcoin just 59 days to notch the next ATH — gaining 1,013.45% in that same time span — which is ridiculous, even by 2017 standards.

What’s even crazier is that the price went from being -60% from the ATH in October 2013 to exceeding the ATH by 300%+ in that same two month span as well.
Recent Price Action for Bitcoin (May 25th)

Bitcoin breaking past that previous long-term support was substantial.
In the previous bull markets, once the price broke above this point it was clear skies from that point onward.
It would take a significant amount of bearish price action to drop the price below $6.3k.
Anything short of a black swan won’t do it.
Weekly Resolution
We’re going to go ahead and pan this back out to the weekly resolution.
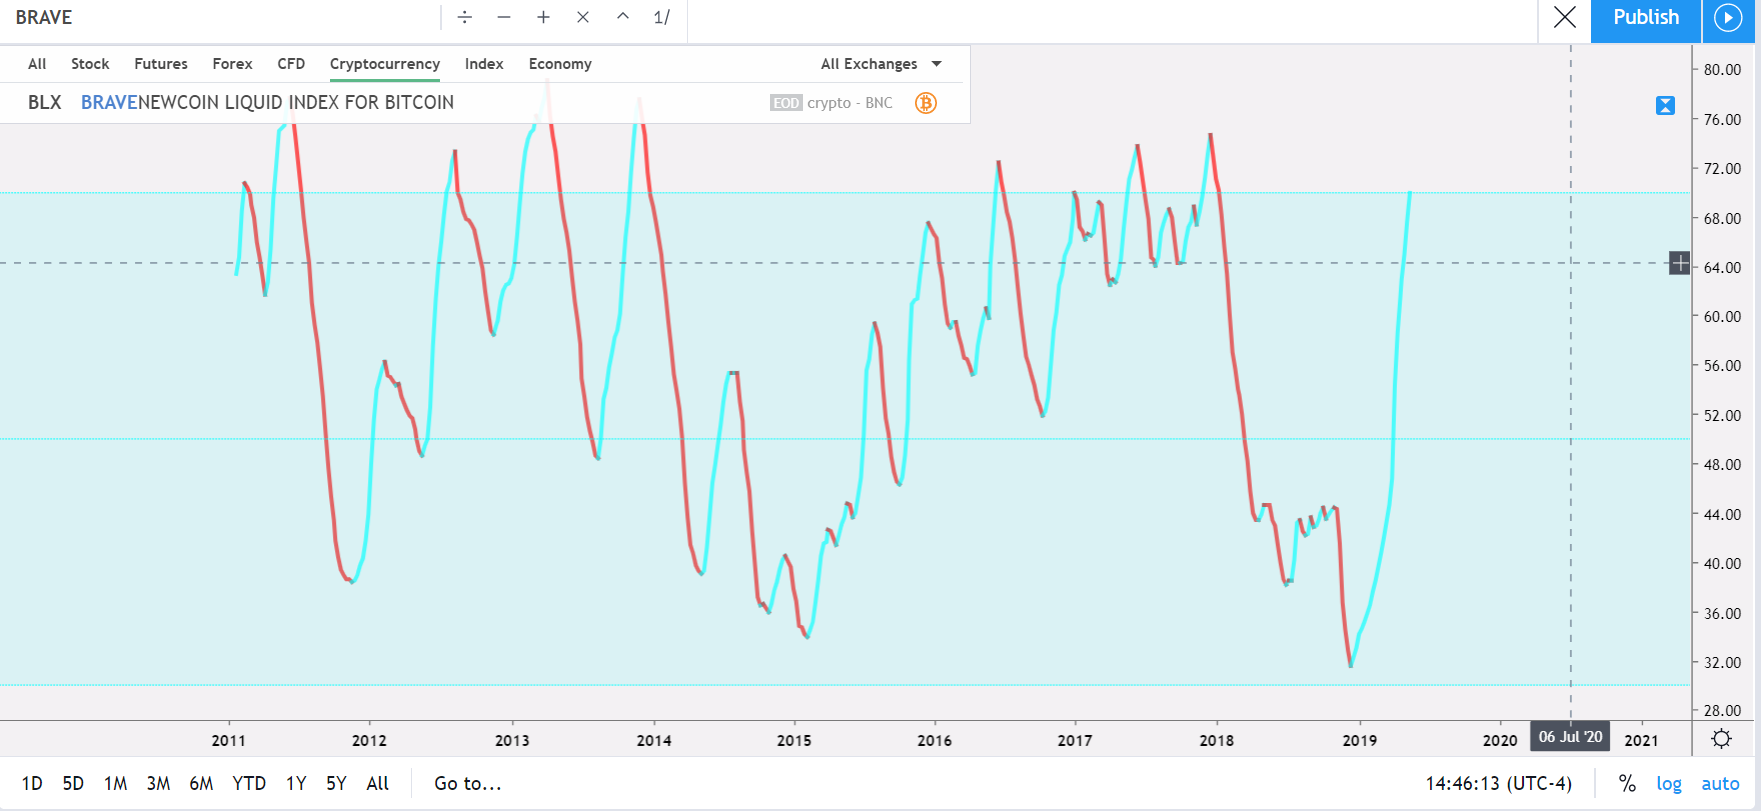
If you don’t know, I’m using the BLX index on TradingView. You can access this by typing “Brave new…” (without the ellipsis or quotes) and you’ll see the option come up via autofill.
This gives you complete price data dating back to 2010. Use this if you want to get a full, longitudinal view of Bitcoin in as accurate of a manner as what we have possible at our disposal currently.
Let’s move forward.
Check out the metrics on the Cryptomedication Volatility RSI:

This indicator does not re-paint. The turn on the weekly resolution came right at the bottom of the crypto markets (as it should’ve because of the reversal in direction)
This indicator is free by the way, just type in ‘Cryptomedication Volatility RSI’ in TradingView and you’ll find it.
There is documentation associated with it as well on TradingView for all those that are wondering how it works.

