Animated Map: Visualizing Earth’s Seasons
@VisualCapitalistOfficial
Why does Earth have seasons?
Many people think the seasons are dictated by Earth’s proximity to the Sun, but this isn’t the case. It’s the Earth’s tilt, not its closeness to the Sun, that influences our seasons.
This animated map by Eleanor Lutz visualizes Earth’s seasons, showing how the temperature changes impact ice levels in the Arctic as well as vegetation more broadly. It also highlights the cloud cover and sunlight each hemisphere receives throughout the year, with each frame in the animation representing a month of time.
Why is Earth Tilted?
Unlike some of the planets that sit completely upright and rotate perpendicularly, Earth rotates on a 23.5-degree axis.
But why? A commonly accepted theory among the scientific community is the giant impact hypothesis. According to this theory, a celestial object called Theia collided with Earth many years ago, when the planet was still forming. This collision not only knocked Earth into its tilted position—some believe that the dust and debris from this impact ended up forming our moon.
Ever since, our planet has been rotating with a slight tilt (which itself is not fixed, as it “wobbles” in cycles), giving us our varying seasons throughout the year.
How Earth’s Tilt Influences our Seasons
As our planet orbits the Sun, it’s always leaning in the same direction. Because of its tilt, the different hemispheres receive varying amounts of sunlight at different times of the year.
In December, Earth is technically closer to the Sun than it is in June or July. However, because the Northern Hemisphere is tilted away from the Sun during December, that part of the planet experiences winter during that time.
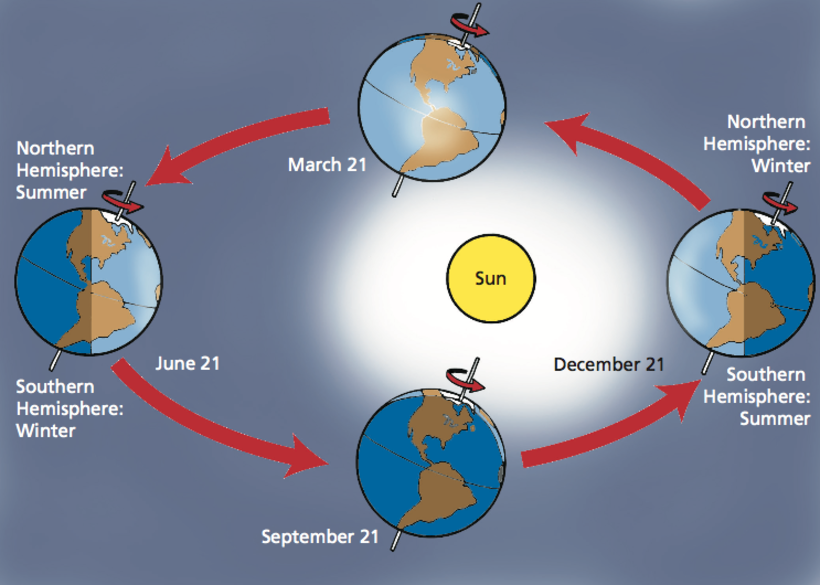
The graphic above by the Smithsonian Science Education Center (SSEC) visualizes Earth’s orbit throughout the year, showing when each hemisphere receives the most direct sunlight (and thus, experiences summer).
The Climate Change Impact
While our seasons have always varied, it’s worth noting that climate change has impacted our seasons, and changed how much Arctic ice we lose each summer.
In the past, millions of miles of ice remained frozen throughout the summer months. In the 1980s, there were 3.8 million square miles of ice in July—that’s roughly the same size as Australia.
Over the years, Arctic ice cover has steadily declined. In July 2020, the ice cover was only 2.8 million square miles—a million less than the amount four decades ago.
Some scientists are predicting that we could lose our summer sea ice entirely by 2035, which would have a devastating impact on the Artic’s wildlife and the indigenous people who live there.