Analytics tools
Vlt99RD Analytics
Telegram: @rd9analytics
Twitter: @9rd_analytics

Intotheblock.com is a provider of a large number of indicators for different cryptocurrencies. In fact, there are a lot of such providers, but Intotheblock has two great advantages. Firstly, the price of accessing its services is one of the lowest on the market - only $10 per month. Other services have prices from $30 to $250 per month. Secondly, Intotheblock has some useful indicators that other services do not have. You can use the service for free, but the functionality will be very limited. From my own experience, I can say that the service is worth its money, if you are regularly engaged in analysis.
I will not describe all of its functionality, you can get acquainted with it in the application. I will only give a general description.
So, what information about the token you can get?
Network data:
· address statistics (total/new/active, how many addresses with a balance and with a zero balance),
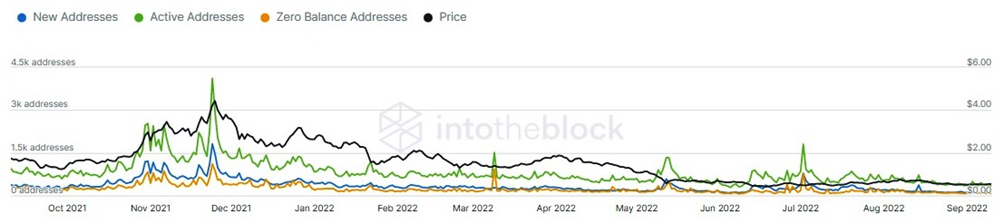
· detailed transaction data,
· token held time.
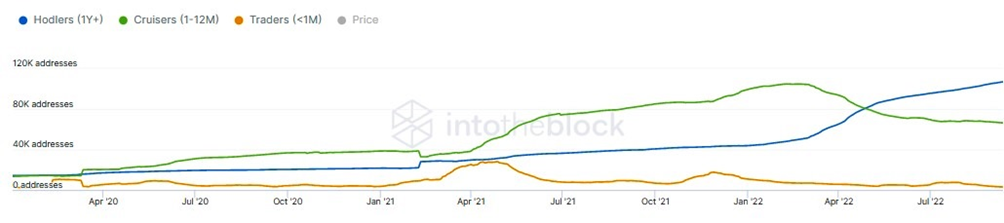
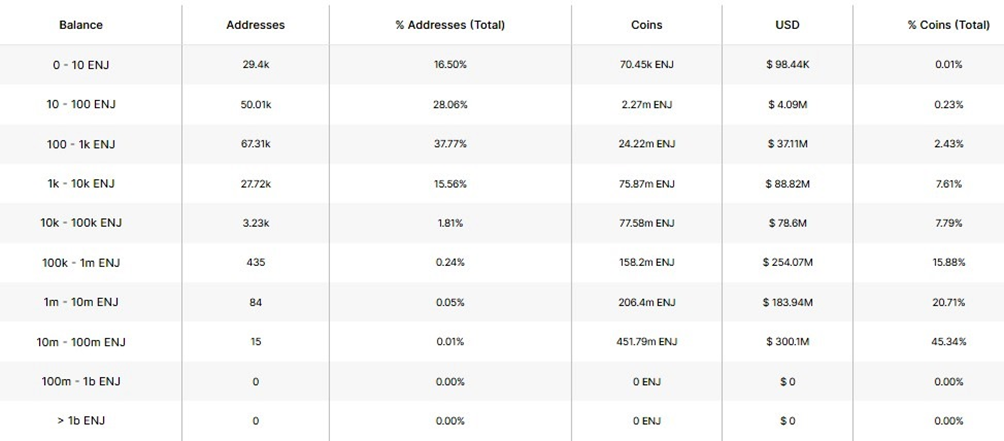
Token distribution:
· what share the whales own,
· what shares of tokens are held by small holders,
· how often token holders make transactions,
· distribution by token holding time.
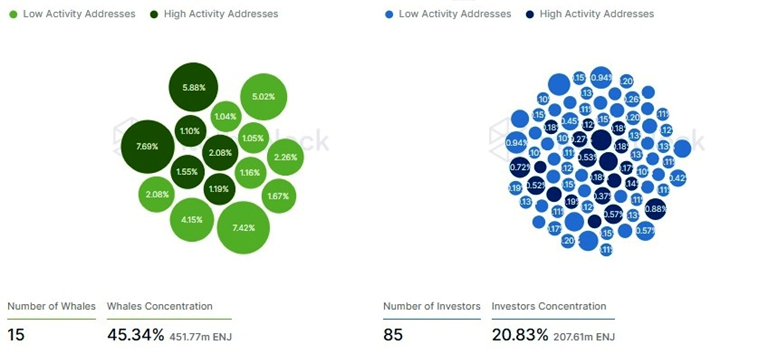
Distribution matrix
Financial data:
· how many token holders are in profit and how many are in loss - very interesting feature, I haven't seen it on other services. If any of you know where it is still available, send me a message in Telegram @vlt99.
How can you put this feature into practice? Here is an example from our Enjin report that we did in September 2022.
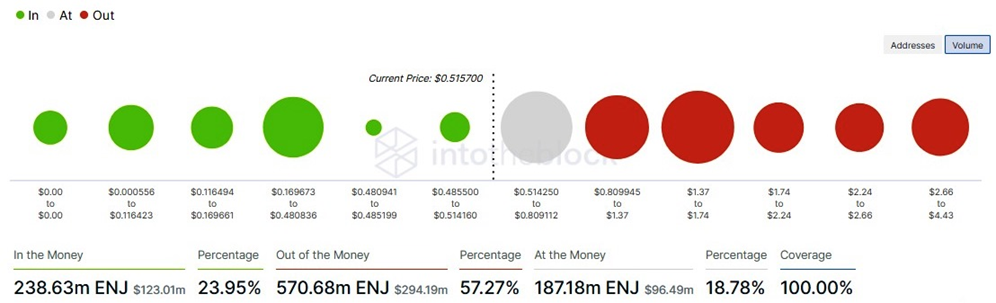
Based on this graph, this conclusion was drawn:
The total supply of ENJ tokens (1 billion) is circulating. Of these, 23.95% were bought to the current price level - they are in profit. 18.78% are "at the money" - tokens bought near the current price. And 57.27% are at a loss. In the $0.53-$1.74 range, about 520 million ENJ were bought. If there is a significant share of "paper hands" among the holders, wishing to break-even, the wide range of $0.81-$1.74 can be considered a resistance level.
· transaction size classification
· average transaction size
· average balance
· token volatility
· correlation to other assets
· financial flows on exchanges
· Bulls and Bears
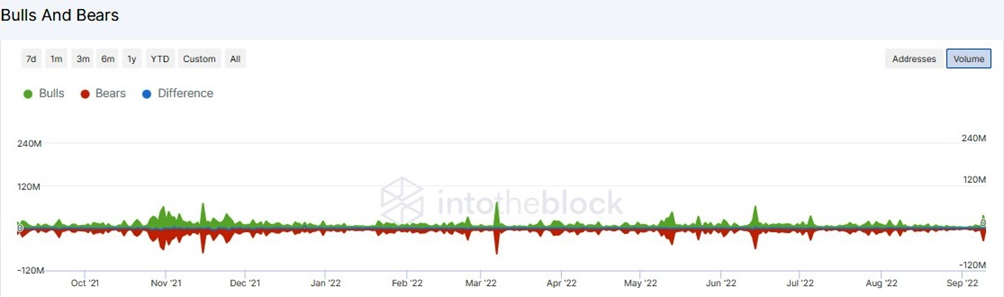
Bull is the address, which bought more than 1% of the trading volume in 24 hours. Bearis the address, which sold more than 1% of the trading volume in 24 hours.
Social media analysis
Derivatives Analysis
All data can be downloaded in a .csv file. And you can create your own indicators and charts based on this data.
There is a lot of other information on the site (insights, predictions). I think this is a very useful tool for an analyst. If you don't want to spend even $10, the good news is that Intotheblock is integrated with Tradingview. You know what Tradingview is, right?
A smart analyst has to constantly monitor his tool set. Find new ones, remove the ones that didn't meet expectations. New services, data aggregators, etc. are constantly appearing in the crypto world.