A Decade of Population Growth and Decline in U.S. Counties
@VisualCapitalistOfficial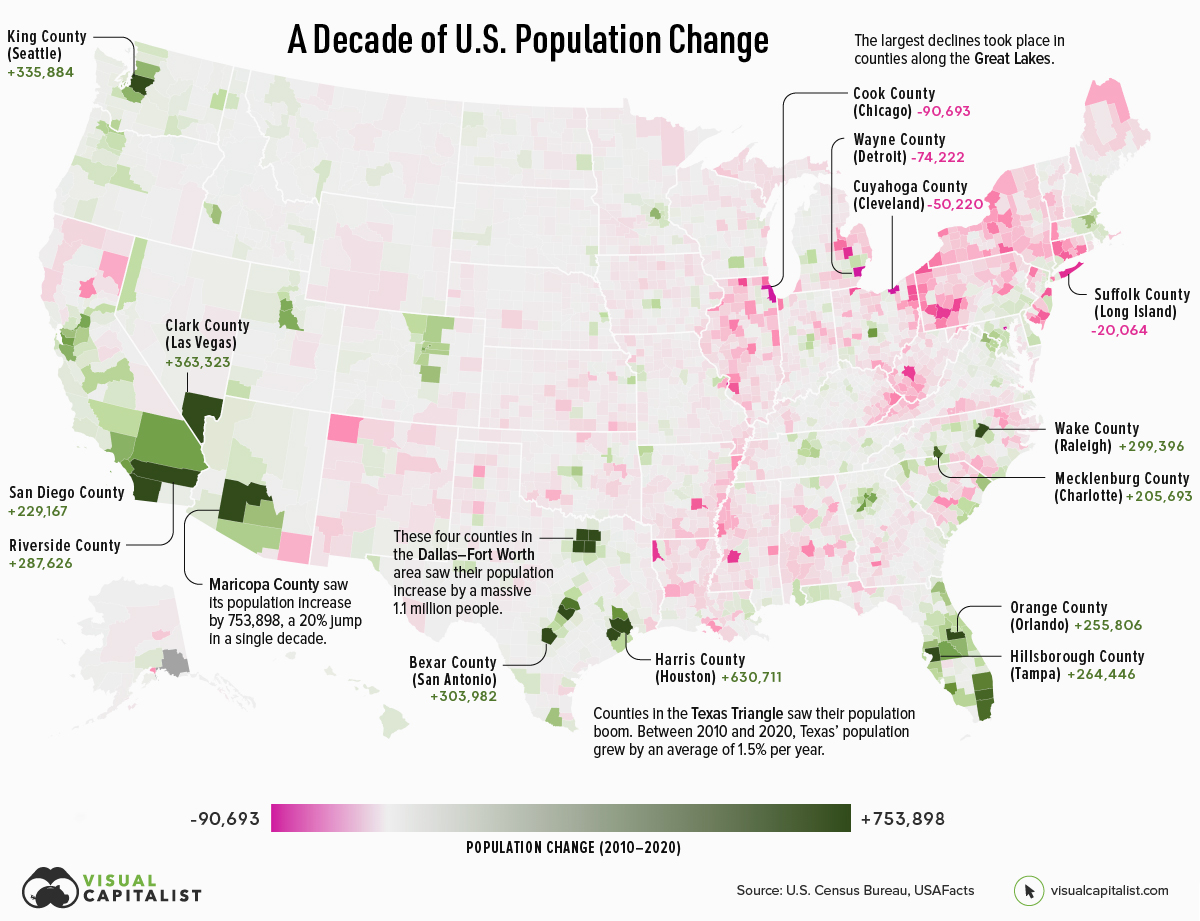
A Decade of Population Growth and Decline in U.S. Counties
There are a number of factors that determine how much a region’s population changes.
If an area sees a high number of migrants, along with a strong birth rate and low death rate, then its population is bound to increase over time. On the flip side, if more people are leaving the area than coming in, and the region’s birth rate is low, then its population will likely decline.
Which areas in the United States are seeing the most growth, and which places are seeing their populations dwindle?
This map, using data from the U.S. Census Bureau, shows a decade of population movement across U.S. counties, painting a detailed picture of U.S. population growth between 2010 and 2020.
Counties With The Biggest Population Growth from 2010-2020
To calculate population estimates for each county, the U.S. Census Bureau does the following calculations:
From 2010 to 2020, Maricopa County in Arizona saw the highest increase in its population estimate. Over a decade, the county gained 753,898 residents. Below are the counties that saw the biggest increases in population:
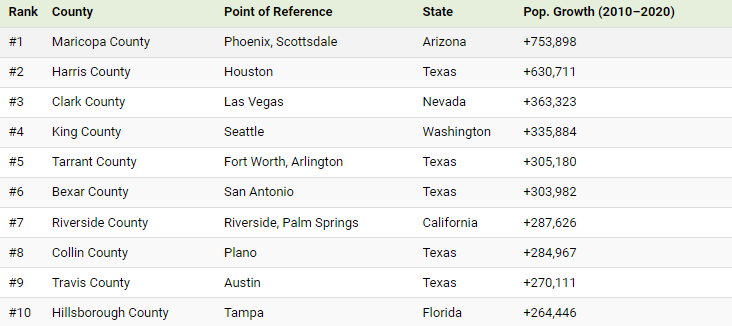
Phoenix and surrounding areas grew faster than any other major city in the country. The region’s sunny climate and amenities are popular with retirees, but another draw is housing affordability. Families from more expensive markets—California in particular—are moving to the city in droves. This is a trend that spilled over into the pandemic era as more people moved into remote and hybrid work situations.
Texas counties saw a lot of growth as well, with five of the top 10 gainers located in the state of Texas. A big draw for Texas is its relatively affordable housing market. In 2021, average home prices in the state stood at $172,500—$53,310 below the national average.
Counties With The Biggest Population Drops from 2010-2020
On the opposite end of the spectrum, here’s a look at the top 10 counties that saw the biggest declines in their populations over the decade:
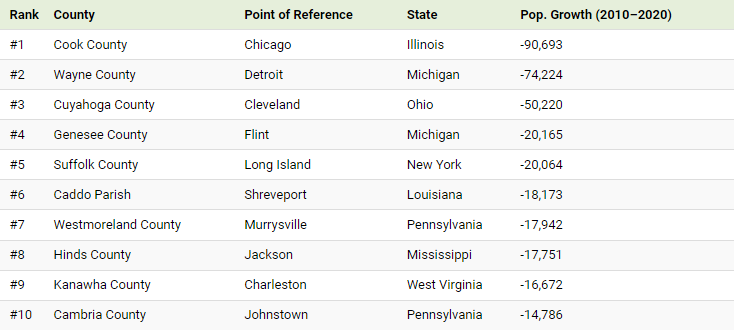
The largest drops happened in counties along the Great Lakes, including Cook County (which includes the city of Chicago) and Wayne County (which includes the city of Detroit).
For many of these counties, particularly those in America’s “Rust Belt”, population drops over this period were a continuation of decades-long trends. Wayne County is an extreme example of this trend. From 1970 to 2020, the area lost one-third of its population.
U.S. Population Growth in Percentage Terms (2010-2020)
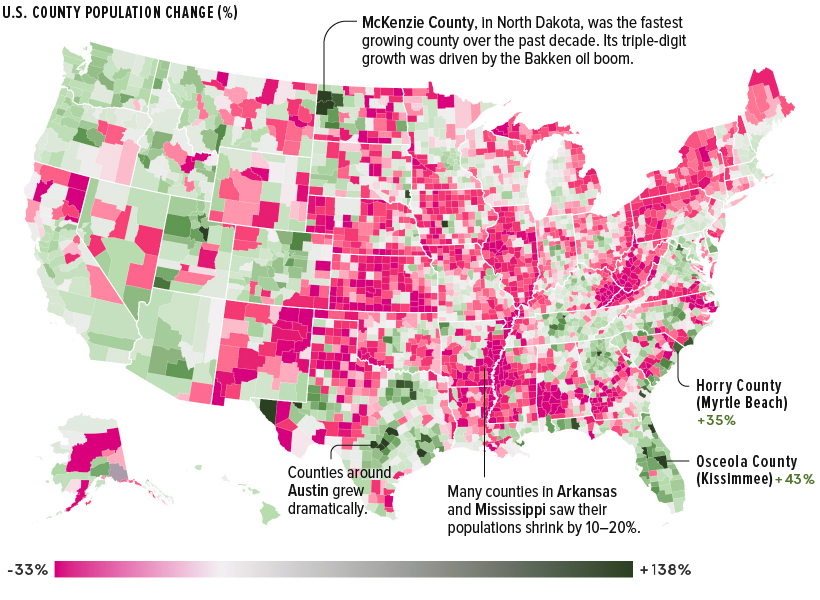
While the map above is great at showing where the greatest number of Americans migrated, it downplays big changes in counties with smaller populations.
For example, McKenzie County in North Dakota, with a 2020 population of just 15,242, was the fastest-growing U.S. county over the past decade. The county’s 138% increase was driven primarily by the Bakken oil boom in the area. High-growth counties in Texas also grew as new sources of energy were extracted in rural areas.
The nation’s counties are evenly divided between population increase and decline, and clear patterns emerge.
Pandemic Population Changes
More recent population changes reflect longer-term trends. During the COVID-19 pandemic, many of the counties that saw the strongest population increases were located in high-growth states like Florida and Texas.
Below are the 20 counties that grew the most from 2020 to 2021.
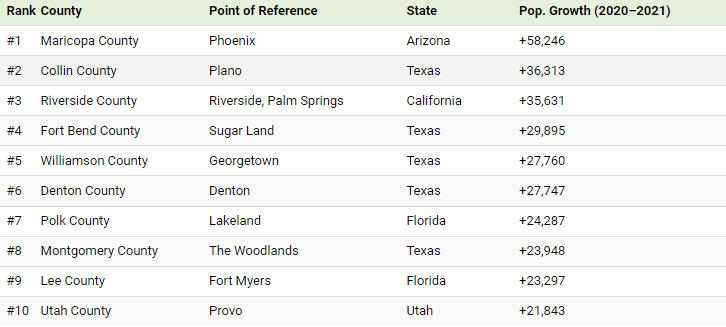
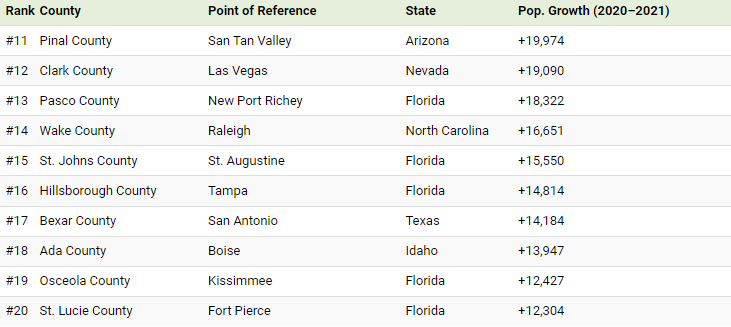
Many of these counties are located next to large cities, reflecting a shift to the suburbs and larger living spaces. However, as COVID-19 restrictions ease, and the pandemic housing boom tapers off due to rising interest rates, it remains to be seen whether the suburban shift will continue, or if people begin to migrate back to city centers.