Mathematical analysis of U.S. 🇺🇸 death statistics since 1950 shows no excess deaths in 2020. There are good reasons to believe that the statistics 📊 grossly falsified.
⏳ ተ𐍂𐌉ଓ𐌵𑀉ꤕ ⚖️ Ⴝ𐌳𐍅Ⴝ 🎙ϮɍϊƀυƖє Ӽ
The material is prepared and intended for study by special services, government officials and U.S. citizens 🇺🇸


}{ https://t.me/rianovostiAmerica
@rian_ru
Biden paid tribute to the half-million Americans who died of coronavirus.
"Today we celebrate a truly gloomy, heartbreaking chapter. 500,071 dead. More Americans died in the year of the pandemic than in World War I, World War II and the Vietnam War."
"We, our country cannot and must not allow this to continue"


Biden and Harris and their spouses observed a minute of silence in memory of the 500,000 Americans who died of COVID-19. The southern facade of the White House was decorated with mourning ribbons, and candles were placed on the stairs. }{
We continue to communicate with FBI investigators for "additional" deaths in the U.S. 🇺🇸
According to official CDC data, in the first 16 weeks (that's 112 days: January 1 to April 21 or April 22, depending on the year) each year in the U.S. died:
2014: 840,145 people
2015: 893,156 (+6.3%)
2016: 878,457 (-1.6%)
2017: 919,548 (+4.7%)
2018: 946,067 (+2.9%)
2019: 919,693 (-2.8%)
2020: 944,251 (+2.7%)
Full data on deaths in the U.S. starting in the 17th week of 2020 until I was able to find .
A question to investigators:
1) How and who introduced the first persons of the state postulate about the existing deaths of 500,071 people in the aftermath of COVID - 2019 ?
2) CoVID Stamp - 19 highlighted ?
3) A certificate of death and cause of death checked recorded in the certificate ?
4) Who signs certificates and establishes the cause of death ?
5) Died from COVID" counted, but the rest of the deaths are not definitively counted ?
6) How can this be?
I will present the immediate (not final) data below.
In 2020 compared to 2019 : 24.6 thousand additional deaths. Taking into account U.S. population growth in 2020
In 2018 compared to 2017: 26.5 thousand deaths . We take into account the population growth in 2018.
In 2015, compared to 2014, there were 53.0 thousand "additional" deaths.
In 2020 compared to 2018 - this is not the year in the shower : 1,800 deaths less.
7) Why did the U.S. economy 🇺🇸 and the planet not stop in 2015 and 2018?
8) Why didn't the U.S. and world media fight in their studios in hysterics?
9) What has this befallen the US national media 🇺🇸 in 2020-2021?
Absolute mortality rates, especially in the first few weeks of the year, are of little statistical value.
In 2014, 318.856 million people lived in the United States (as of July 1, and in 2019 - 330.568 million (3.7%).
I propose to calculate the mortality rate for the first 16 weeks of each year:
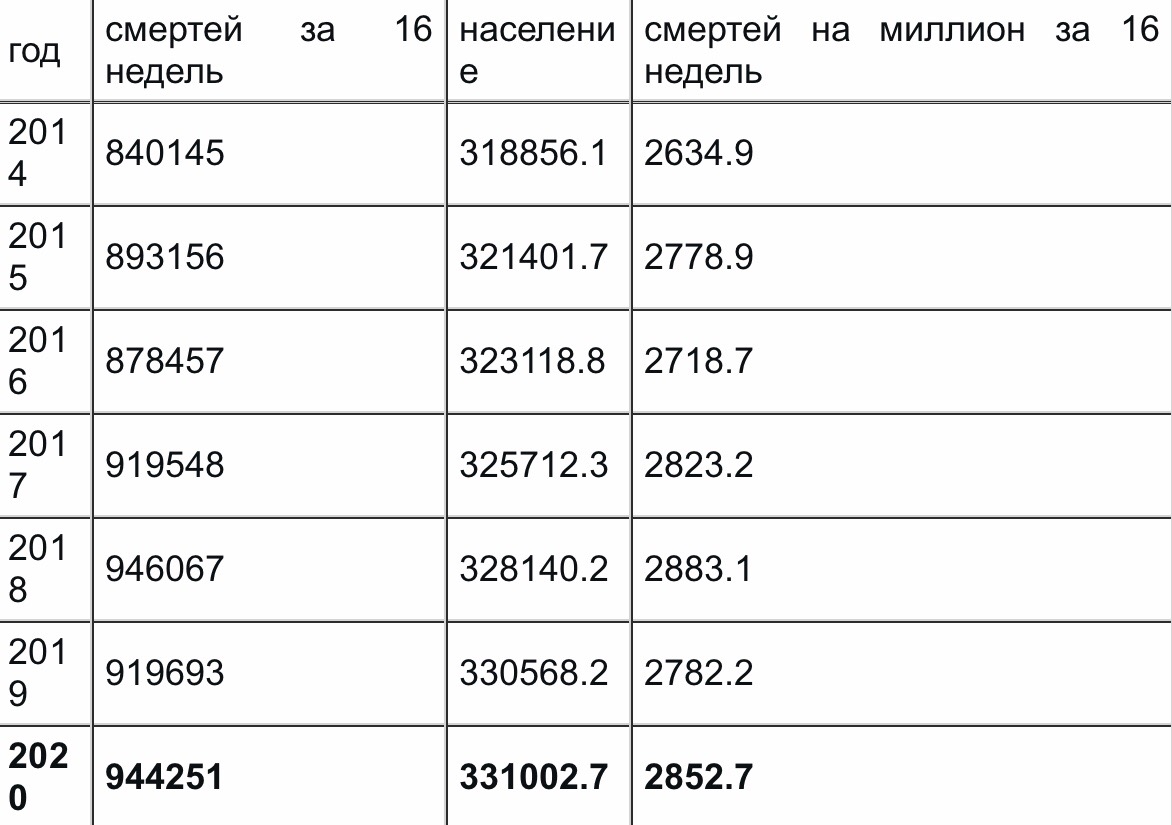
You can see that the mortality rate for the first 16 weeks of 2018 was higher than in the first 16 weeks of 2020?
I can see the difference and it is about 30 deaths per million population.
Average for 6 years (from 2014 to 2019): 2770.2 deaths per million. Average deviation 85.7. The deviation of 2020 from the average of 82.5, that is less than one average deviation for the previous 6 years.
The probability that mortality in the first 16 weeks of 2020 is not a statistical "noise" is no more than 20.1%.
Can I dig a little deeper?
Not only can you dig, but it is necessary and extremely useful to dig potatoes, and for example.
Consider annual mortality. Sixteen weeks is 30.6% of the length of the year, meaning all your - now annual - values will be about 3 times longer. Mortality for the whole of 2020, we, of course, do not know .
The question is repeated all the same !
Who supplies the U.S. President with un-published data?
Since what time has statistics 📊 in the U.S. become a secret ?
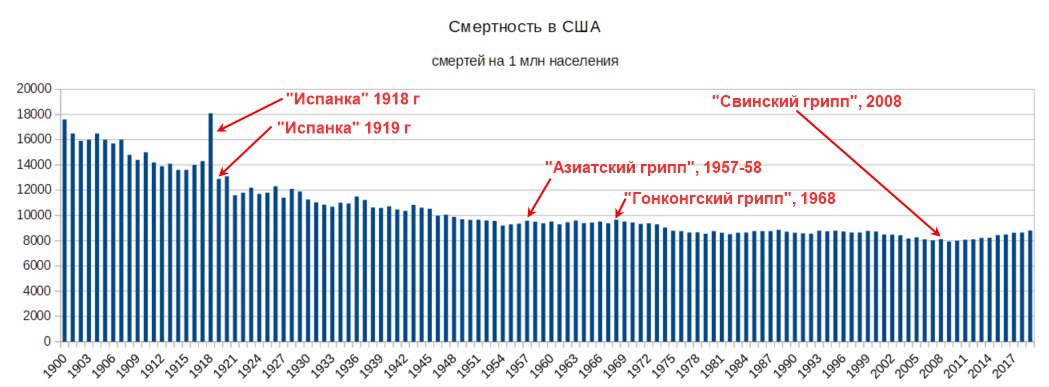
Mortality in the United States for the entire last century is well known. Unlike many countries in Europe and Asia, the U.S. did not fight at all, so the unaccounted loss of population /soldiers are statistically insignificant. The graph clearly shows the consequences of the first two waves of the "Spanish" epidemic in February and August 1918. The additional mortality rate in 1918 was 3'480 per million. But the third and fourth waves - in 1919 and 1920 - paradoxically, led to a decrease in the mortality rate compared to 1911-1917 by 1,000 deaths per million - from 13'900 to 12'900.
If we understand the subject matter, I do not know whether the first and fourth waves were even "Spanish". There were no biological samples left, about the structure of DNA/RNA and their role in heredity at the time were not known, and even believed that the flu is caused by the bacteria Haemophilus influenzae (where the name) and not the virus. It could well be more plebeian flu, just for fear eyes are big and all colds in 1920 automatic recorded in "flu-flu".
Two other major influenza pandemics - "Asian" 1957-58 and "Hong Kong" 1968 - are only visible in the graph if you draw the arrows. The additional mortality rate in the United States was 150 and 160 people per million, respectively. Dividing 3'480 by 155, we get that the famous Hong Kong flu, about which Volodya Vysotsky sang, was in the U.S. about 20 times less deadly than "Spanish." About the formidable "swine" flu of 2008 and do not remember. In the U.S., the death rate has even decreased slightly compared to 2007. Compare the peaks of terrible flu with the beginning of the Great Depression (from 1929) or World War II (since 1940).
Now we will extend the same schedule for the period from 1950 to 2019 :

We see the death rate in the U.S. falling in the run-off until 2009, when the minimum was reached:
7, 940 deaths per million a year. Since 2010, the U.S. death rate has been increasing. In 2018, the Demographic Committee gives pre-8, 652 per million; For 2019 there is only a less accurate estimate of the UN 🇺🇳: 8, 800 deaths per million. This is 9.0% and 10.8% more than the minimum of 2009.
In 2019, the death rate in the United States - as in 1975. For half a century rolled back and everyone is silent.
The main reasons are two: long-term and medium-term.
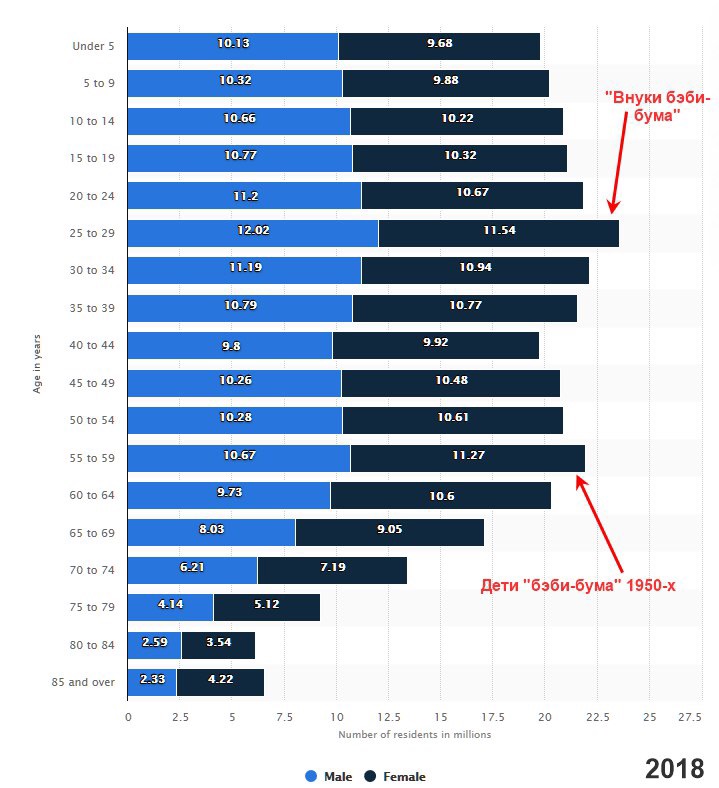
First, in 2010, 65 million Americans born during the "baby boom" turned out to be an average of 50 (in 2018, the peak at the ages of 50-64, take 8 : 42-56 years).
From the age of 60, it is known that the "age of mortal" begins.
Secondly, in 2007, a certain office with the letter L was "too big to burst."
However, it burst. Well, do you have to remember?

Apply the method to calculate the average mortality in the U.S. for 6 previous years and take away from the mortality of the current year and get:
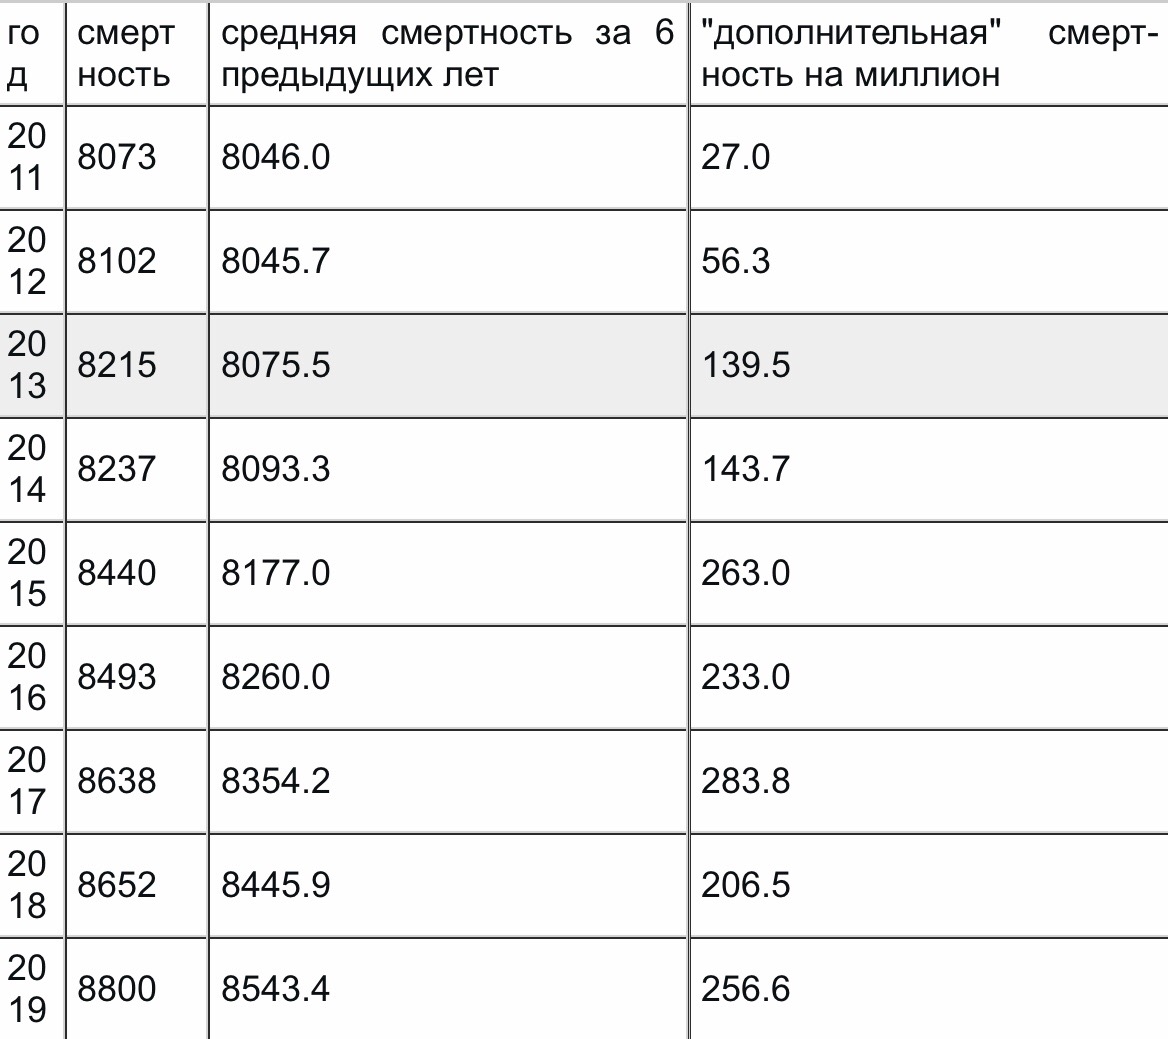
In 2011, the "additional" mortality rate was 27 per million.
Is it clear to everyone that the all-American self-isolation was not announced?
In 2014 - 144 per million. The influenza pandemic is obvious and it really was, but the All-American isolation and self-isolation were not and did not declare it ?
2017 and two hundred and eighty additional deaths per million. Again, there is an annual influenza pandemic, and there was no panic again.
In 2018, in the first 16 weeks, the mortality rate is higher than in previous years, but at the end of the year the additional deaths were even less: 210 against 280.
That's because autumn 2018 was flu-friendly.
And yet: Since 2015 (Trump's cadence) "additional" mortality is consistently greater than the standard deviation. The probability that there is simply an accidental fluctuation or falsification of data, rather than a systematic increase of 100-120 deaths per million per year, is p.8.3x10-6. A little better than the conventional p<0.005, aren't the officers 👮 ♂️?
If the function of mortality increases linearly, then choosing the average for 6 previous years, you automatically have to get about 250-300 "additional" deaths per million annually. In reality, they are no they are not "additional." Comparison with the average for previous years can only be removed long-term trend.
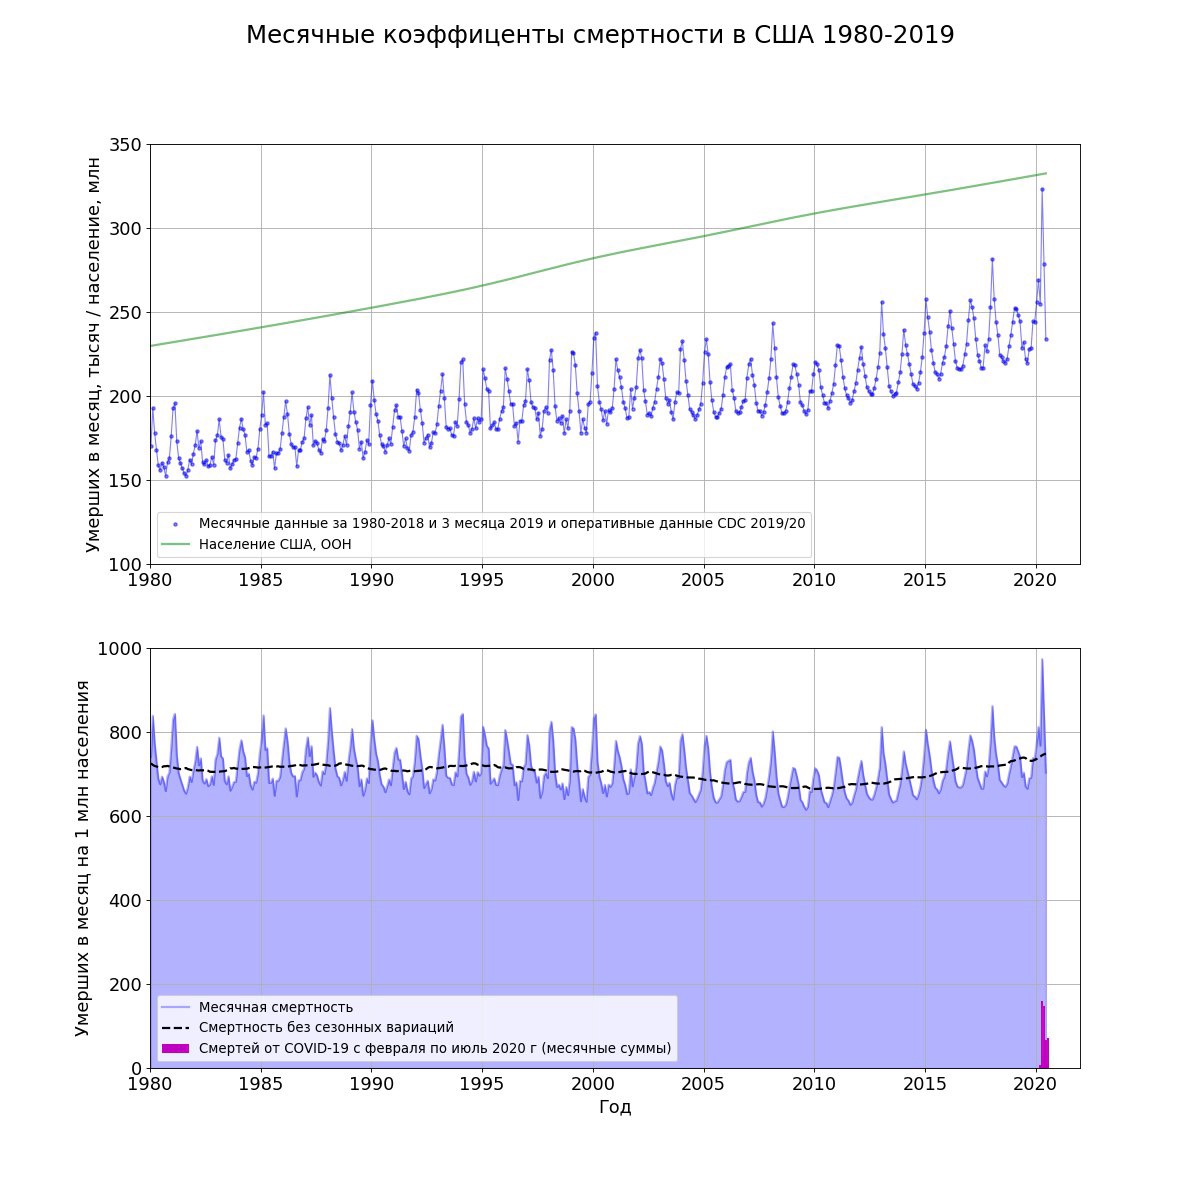
Now let's turn to the monthly mortality data in the U.S. They have been in the public domain since 1980. There will be a month's mortality rate on the vertical axis, and the numbers are about 1/12 of the annual mortality rate.
For the accuracy of the description, we will use the "astronomical" month. Time is recorded in years.
From 2020.0 to 2020 1/12 q 2020.0833 - January, from 2020.0833 to 2020 2/12 q 2020.1667 - February, and so on.
This is necessary to ensure that there is no artificial reduction in deaths in February. In February 28 or 29 days, and in January and March - 31.
With the same daily mortality, the leap calendar February will show 1-29/31/6.5% fewer deaths than the neighboring months.
In a non-leap year, the margin of error is even worse: 1-28/31/9.7%.
Similarly, the errors for June and july-August and for the chain October-November-December are removed.
Of course, in the latter the margin of error is less significant: 1-30/31/3.2%.
In 2020, astronomical February begins on January 31 and ends on March 1. Astronomical March - from March 2 to March 31, and so on. In the leap year, the first four months of the year are 31 to 29, 31 to 30 days, and 121 days in a normal year. Difference: 1-120/121/0.83%.

SkySheep would say "it's seasonal."
And I'd be right. In the colder months - from about November to March, mortality is higher, and this was noted by statistical reports back in the 1920s (and old people in Russia said so and knew for many thousands of years: "we would survive the winter"!)
In January-February, about 120-150 deaths per month are more than in July-August. 150 deaths per million per month is the equivalent of 150 to 12'1'800 deaths per million per year, which is about an order of magnitude (once in 10) more than the average deviation from 6 years.
Well, it is also worth considering the peak of mortality, it happens most often in January or February, but there are years when it is in December, and there is a peak in March-April, for example 1995. And 2020 is one of the rare years with a double peak. And yes, it's certainly abnormal - the peak in April and May is very high - but more on that below.
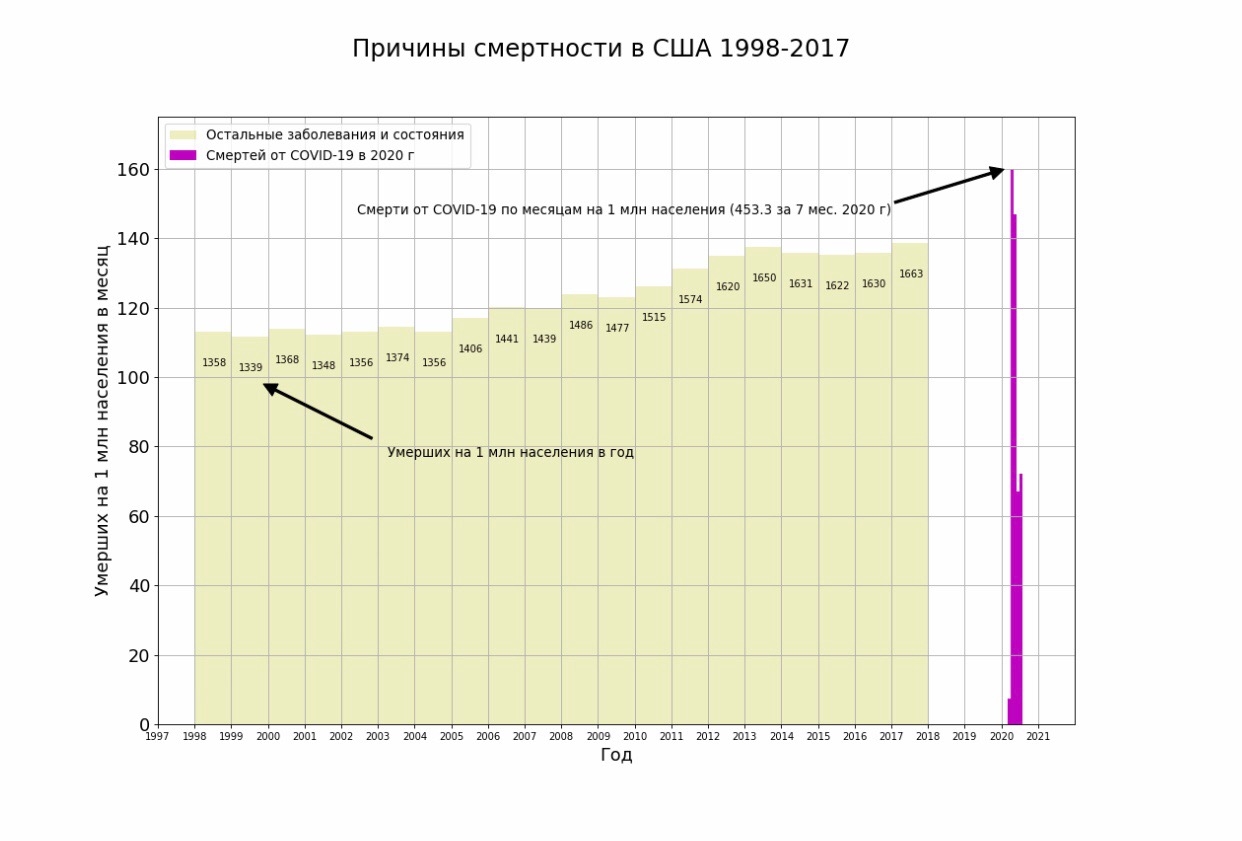
Let's increase the scale of the graph, leaving only data since 1997. According to operational data for the first half of 2020, there was an abnormal peak in April; it is, of course, associated with coronavirus.
The question is: how is it connected?
The standard response in the official media : "KiCoVide-2 is vicious and insidious ! Donald Trump's valiant government protects nation from imminent death?
Let's remember the innocent victims 🕯
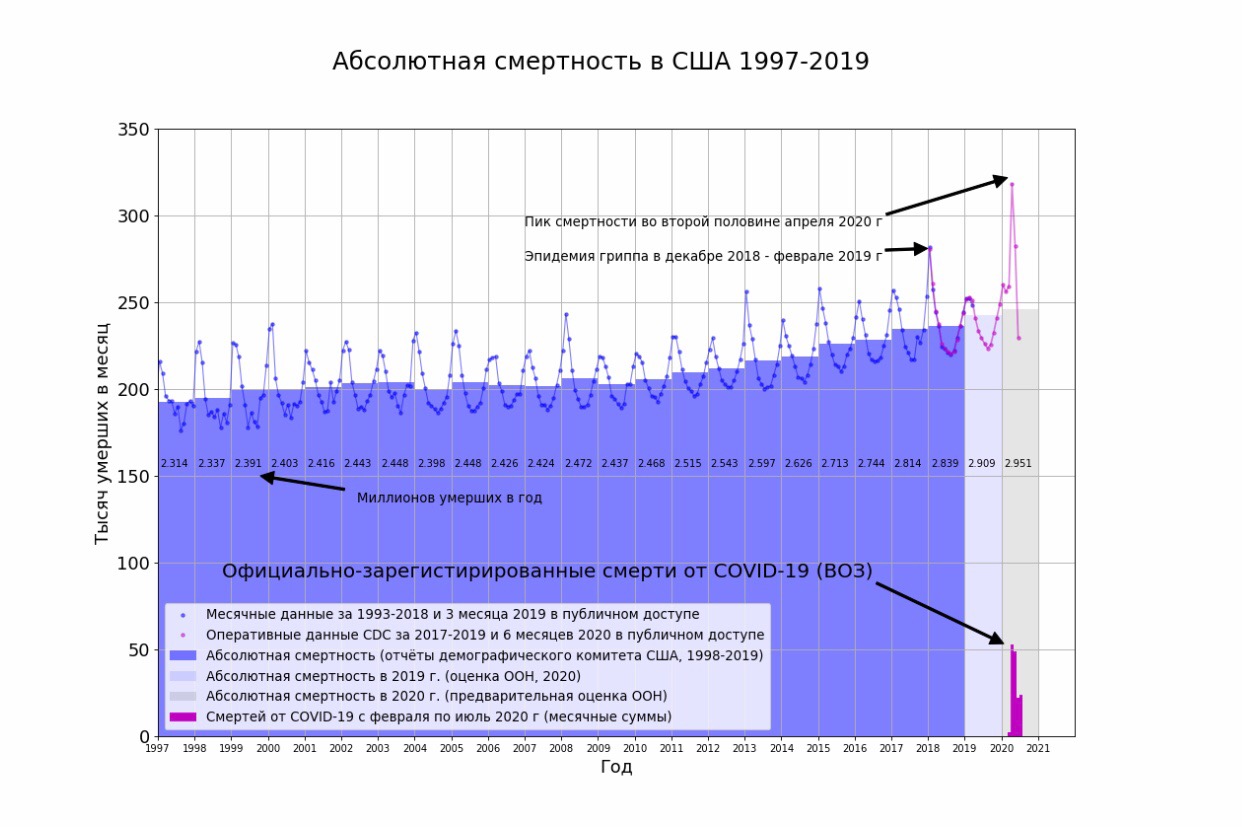
The final report on mortality for 2019 has not been published, but there is a UN estimate. Red on the chart - operational statistics. The data for 2018 are officially "preliminary". The final wait.
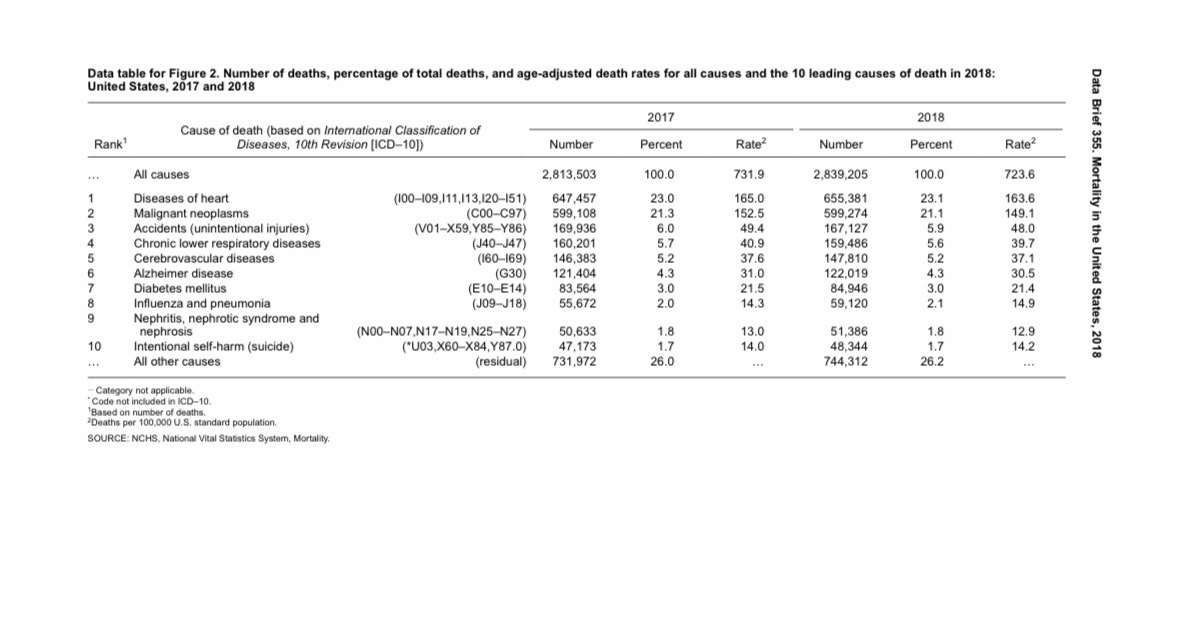
Compare the mortality from the virus / with virius KiCoVir-2 with other causes of death in the U.S. (official tables still end December 31, 2017).

As of August 1, 2020, 453 people per million people have died with the virus/virus. For 2009-2017, mortality from cardiovascular diseases - about 2'000 per million, and about 1'850 - from oncology. This is 6 times more than the death rate from COVID-19.

Deaths from road accidents and other accidents increased for 7 years, suicides increased for 12 years.
Do you seriously believe that there will be fewer homicides and suicides in the U.S. in 2020 than in 2019?
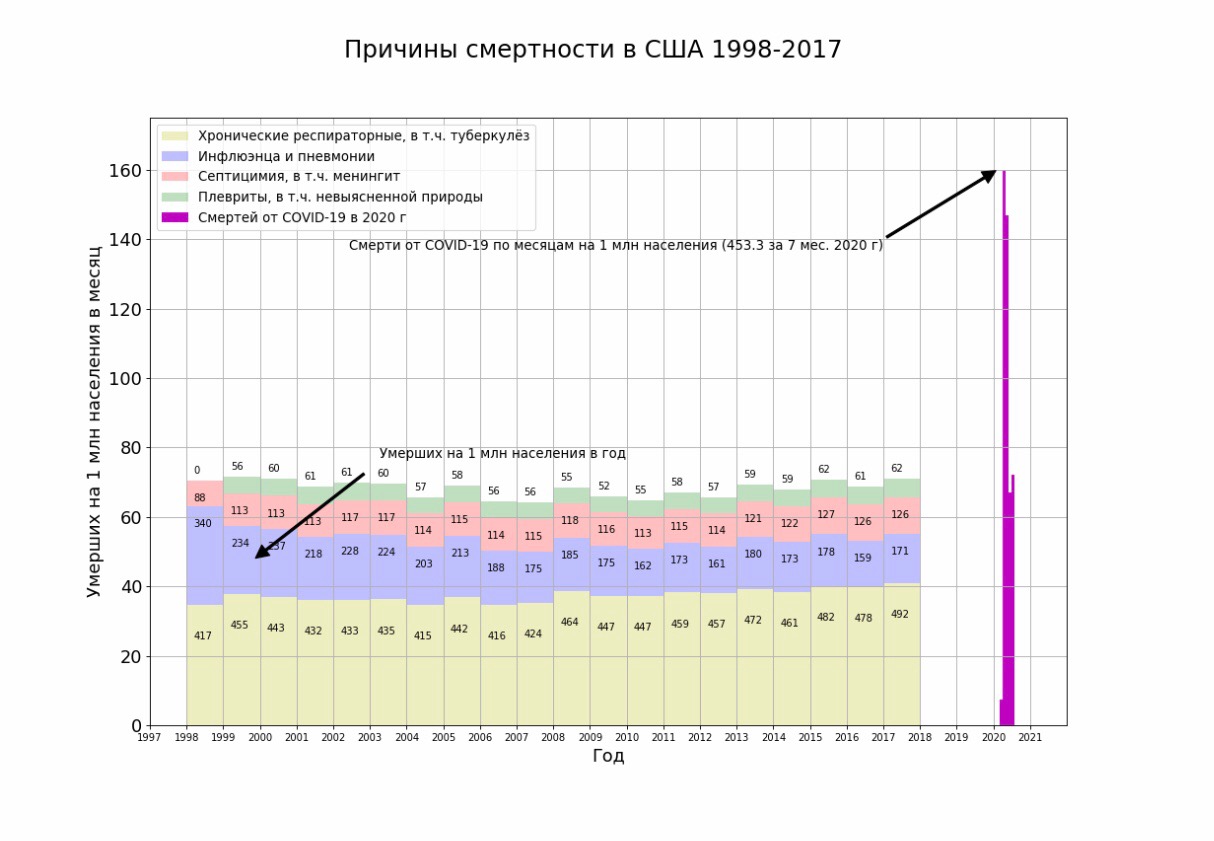
Respiratory diseases are about twice as many as reported deaths from KiCoVir-2. It is clear that influenza (fluenza) and pneumonia are combined in one category. Flu tests do little - in terms of treatment, these data are useless, insurance companies pay for such tests very reluctantly (as well as in Russia)
How many times have you been diagnosed with "just ARVI" and how many times "flu analysis"?
But for the analysis on KiCoVir-2 in the U.S. willingly pay state governments ❗️
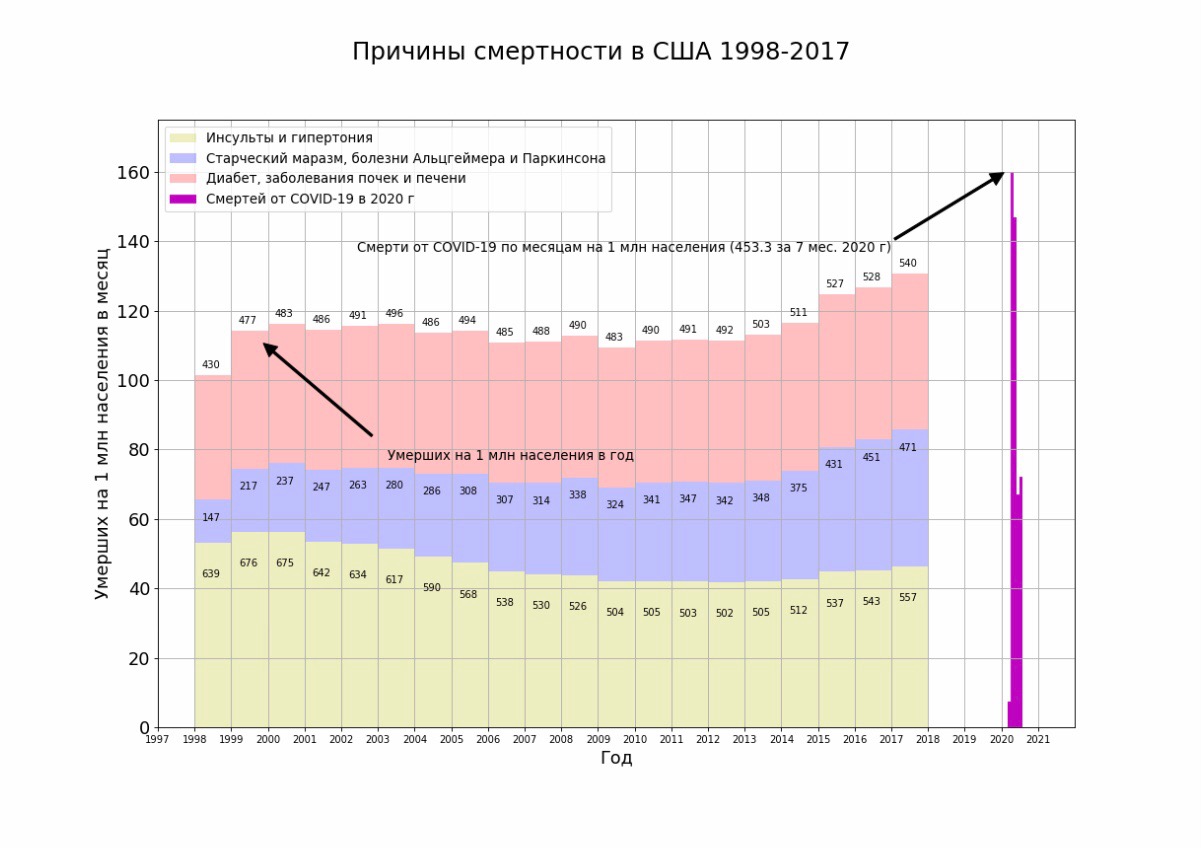
Strokes and other blood clots or broken blood clots killed 550 people per million in the United States. A 70-year-old stroke patient is being taken to the hospital in 2020. And at the gate of the hospital - a queue of ambulances for 8 hours, despite the fact that the hospital is half empty.
That's because the WHO Ethiopian suggested that "more than three not to gather" in the waiting room. The 70-year-old patient did not wait for his turn, he was written off as "deceased as a result of COVID" so that relatives kept quiet.
With the word "consequence" (not "from" and not "c") will not argue friends . Everything is very clear with manipulation. And the prison cell waited for its inhabitants - centenarians!
It's not the virus that's to blame, it's the medical bureaucrat's order.
Well, and "other diseases" to you for the completeness of the picture.
Now we will move from the official "final" to the "operational" data at our disposal.
Unlike the final, these "have the right" to change in any direction. Https://www.cdc.gov/nchs/nvss/vsrr/covid_weekly/, they're "operational"
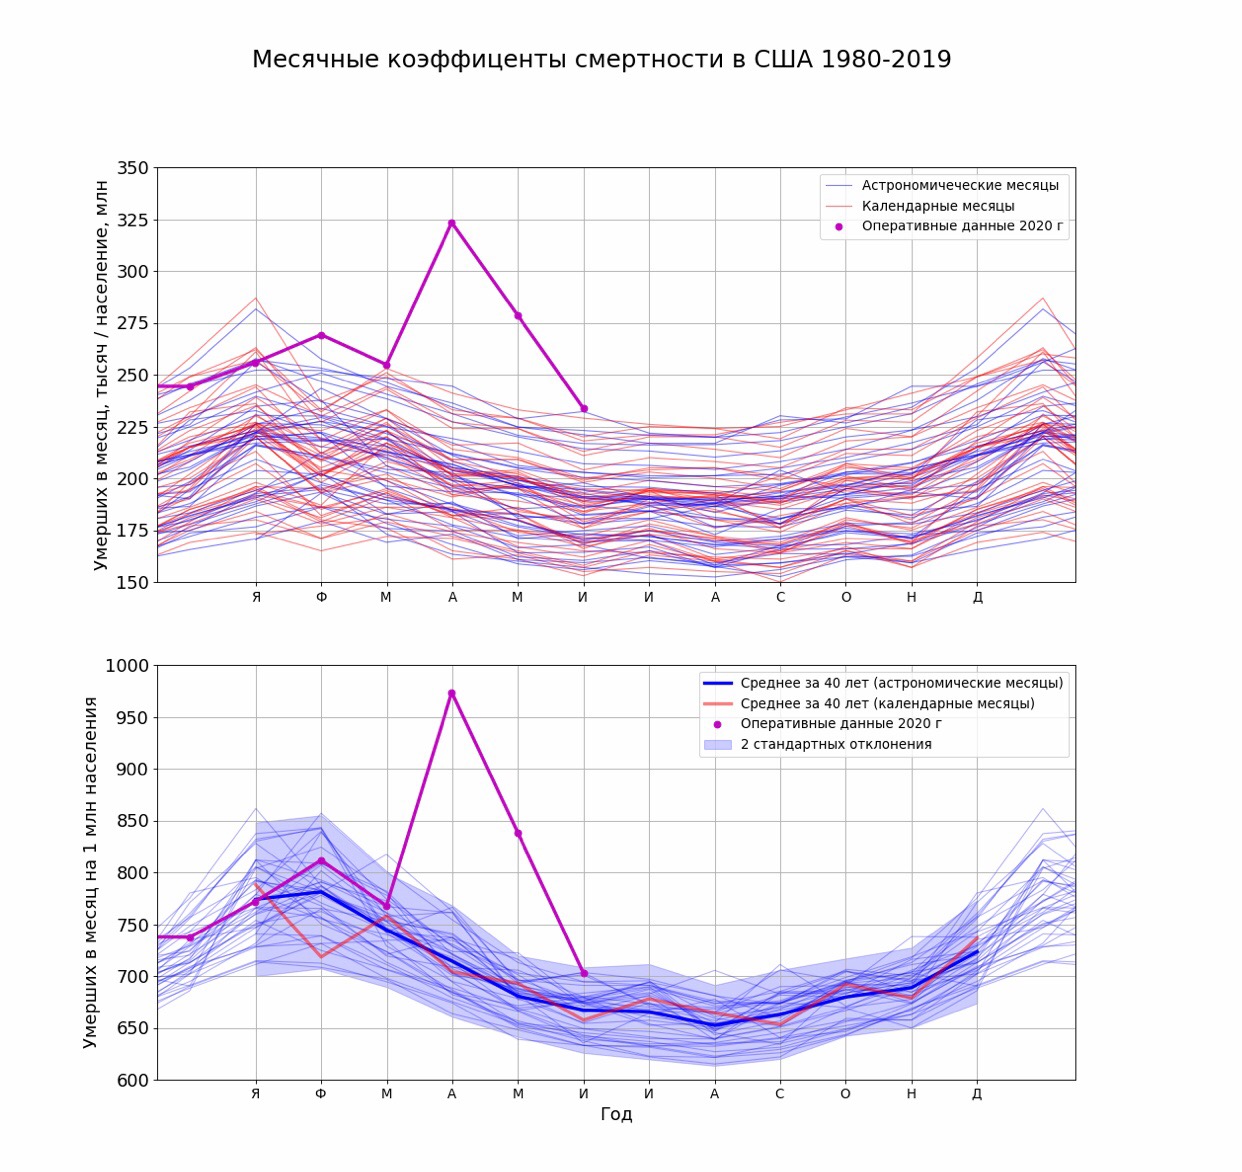
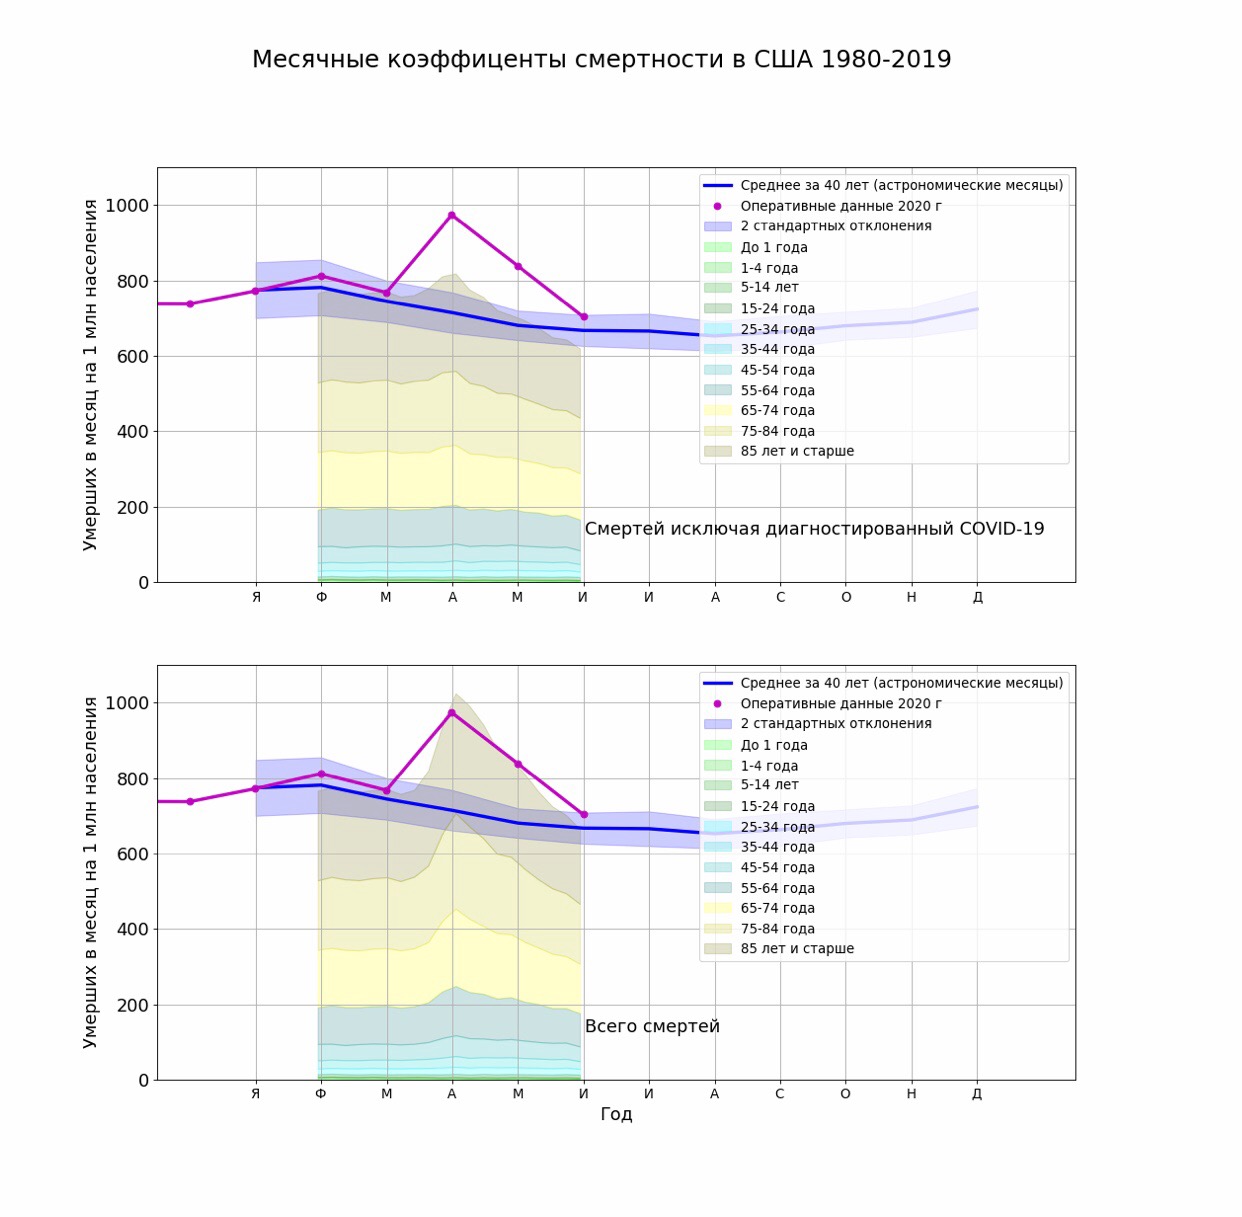
In April-May 2020, the U.S. did have abnormal mortality, the reasons below.
In June, everything began to return to normal. Judging by the weekly data, the total mortality of June is exactly the seasonal average (bottom graph).
If we take away the "official" deaths from COVID-19, the remaining mortality is below the mid-season by two standard deviations (top chart).
Together, this means that "COVID" enrolls patients with other chronic sores, for example after a heart attack.
Where did the "additional" mortality in April-May come from?
I offer versions:
Ambulance queues in hospitals - it was almost everywhere. Here's the stroke example above.
Panic. But you didn't have to show the refrigerators on TV.
They infected terminal (for example, cancer) patients in hospices - they KiCoVir-2 shortened life for 2-4 months, and maybe even less.
Speed discharge to nursing homes - on the orders of the Mayor of New York - 4,500 elderly people with COVID-19 q https://abcnews.go.com/Health/wireStory/ap-count-4300-virus-patients-ny-...
Trump's sabotage before the election happened on March 25. Guess three times what happened in these nursing homes in April?
It wasn't until May 10 that the New York Mayor's directive was rescinded.
Suicide and others.
Unemployment, too.
Crime - to live addict on something you need?
Delayed going to the doctors in the cores / diabetics, etc.
In general, the people died as a result of unprecedented illegal, anti-epidemic measures, which turned out to be, in general, useless.
Here is Sweden I have given the example more than two times. The country has been criticised for its "non-quarantine."
But compare the officers 👮 ♂️ mortality in Sweden with the deaths of old people in other countries. Eighteenth in the world.
In the same table on the honorary 96th place Iceland, where also not quarantined.
Deaths from COVID-19 as a proportion of 2019 senile deaths (30 "leaders," then selectively) :
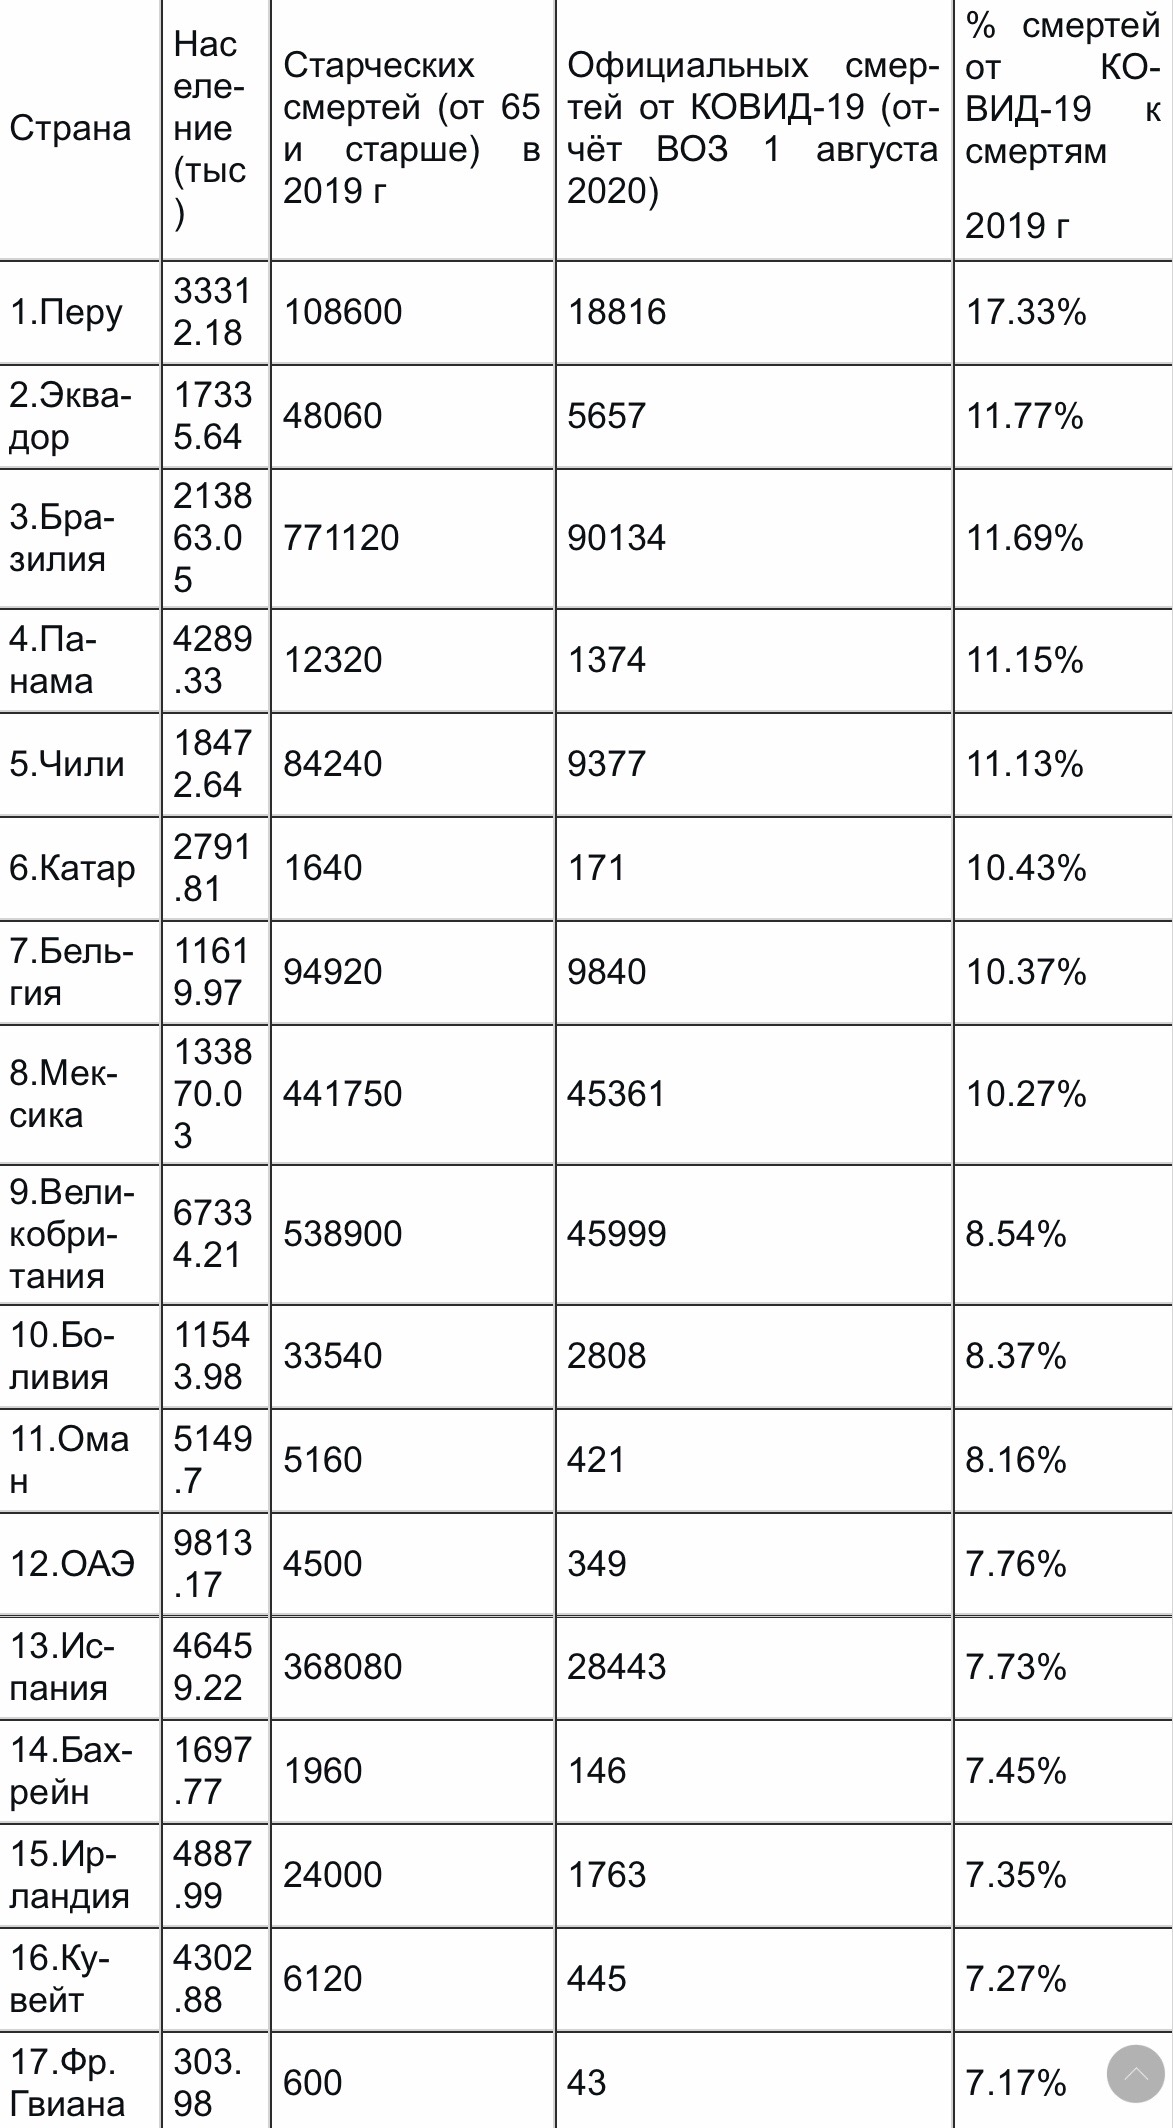
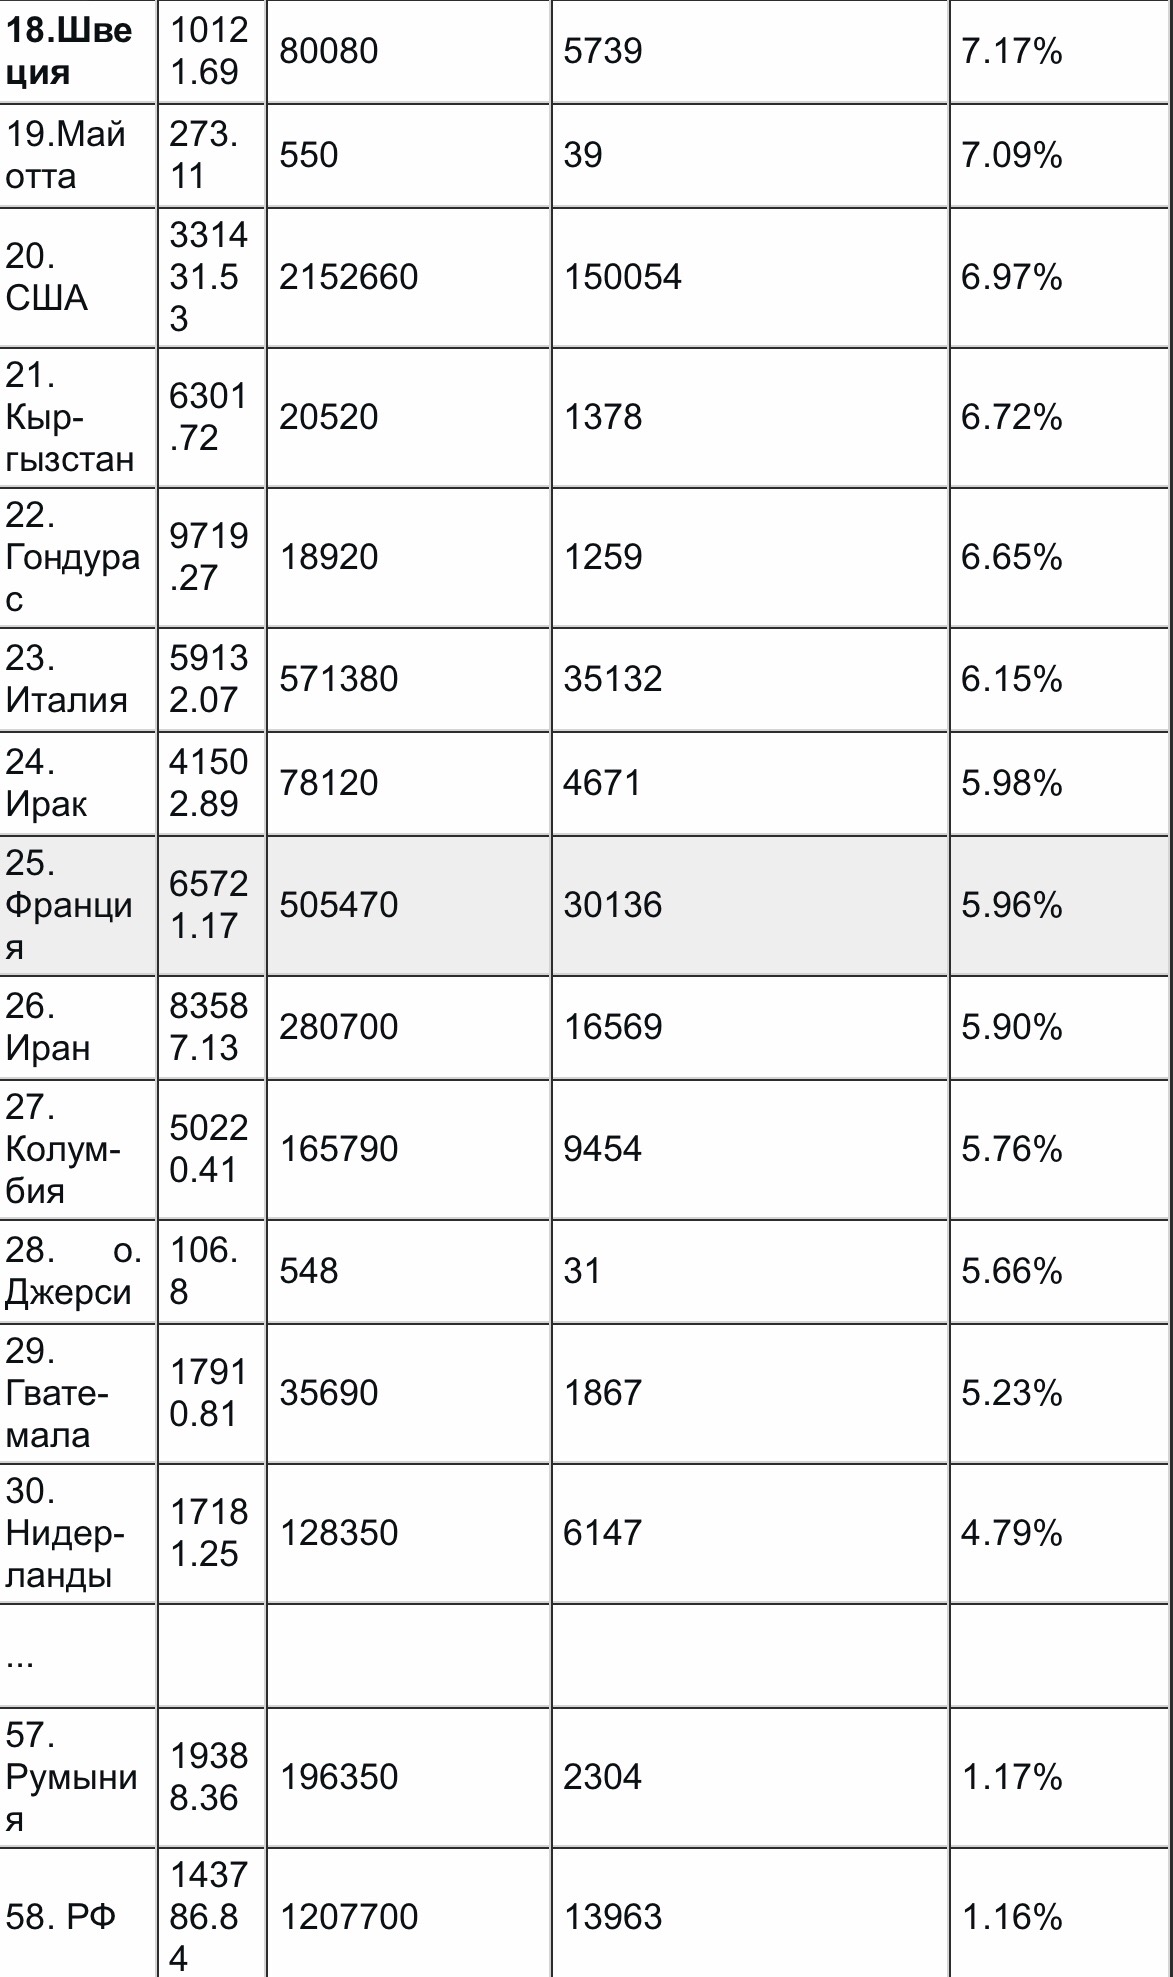
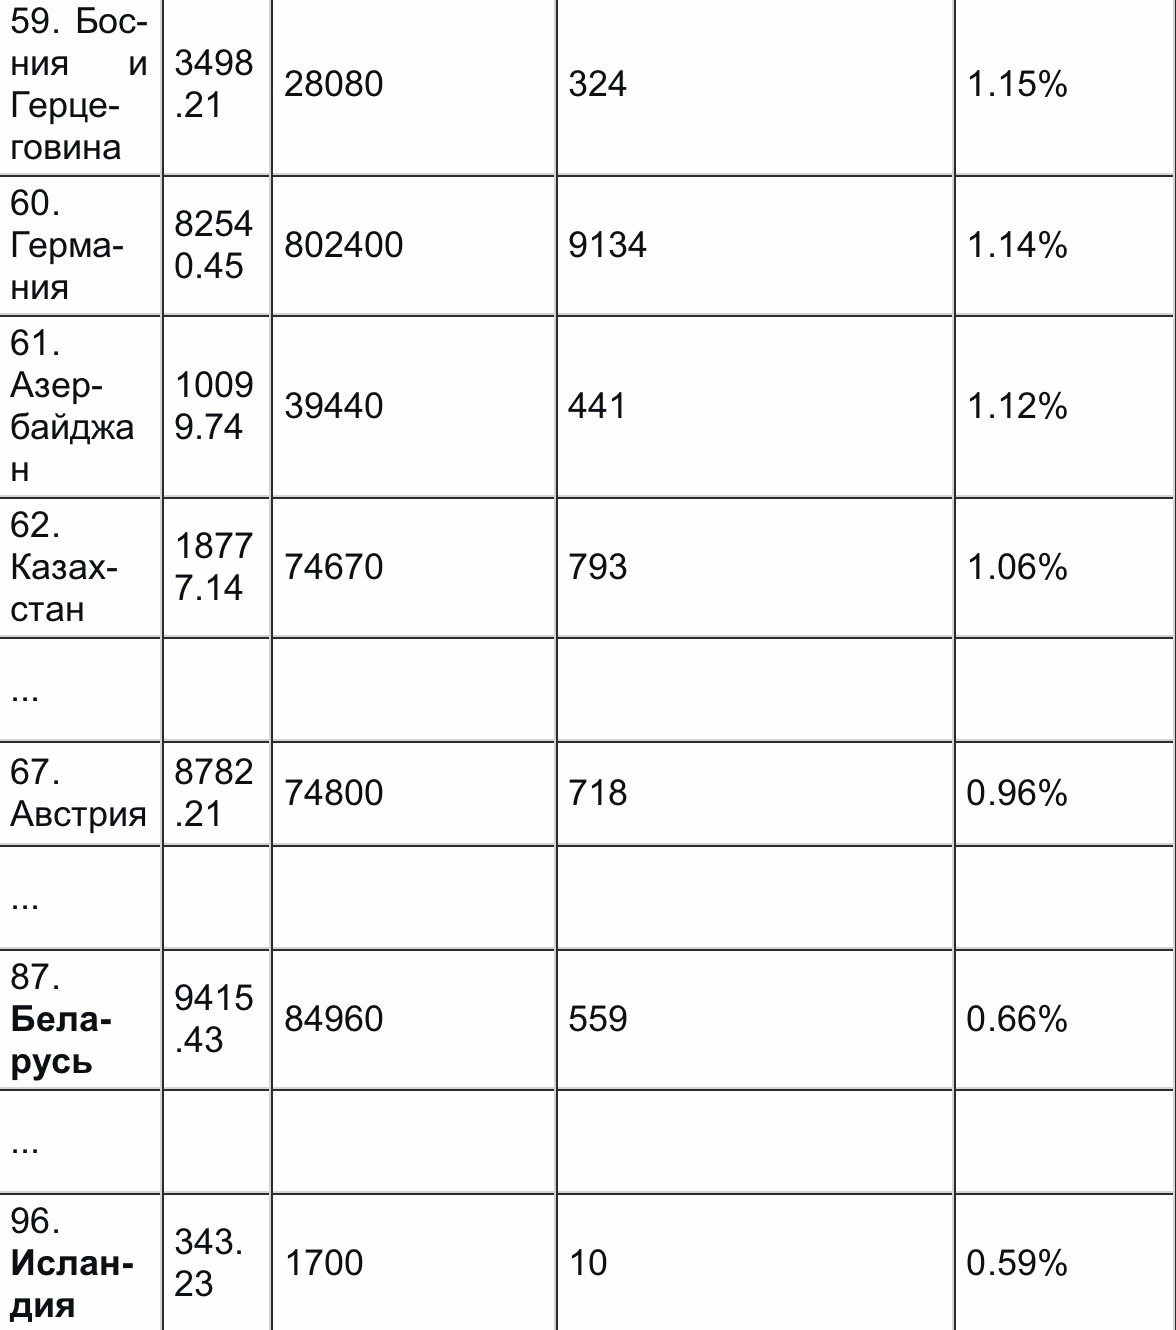
The U.S. will soon surpass Sweden's senile mortality.
We also see that Russian esculopes have already been given to German, Austrian and Belarusian colleagues.
Was there something wrong with the quarantine in Belarus? No?
Accurate mortality in the U.S. by 2020 ? It will not be officially published until the second half of 2022. We haven't had 2018 yet, have we?
By then, people - including young people - will be dying by the thousands of unemployment, crime and hunger, and against this backdrop, hundreds of additional deaths on the
a million two years ago no one would get excited, it seems?
Do you apparently want official documents from me?
I have them for all the years:
[1] Deaths: Final Data for 1998 by Sherry L. Murphy, Division of Vital Statistics
[2] Deaths: Final Data for 1999 Donna L. Hoyert, Ph.D., Elizabeth Arias, Ph.D., Betty L. Smith, B.S. Ed., Sherry L. Murphy, Kenneth D. Kochanek, M.A., Division of Vital Statistics
[3] Deaths: Final Data for 2000 by ArialdiM.Miniño,M.P.H.,ElizabethArias,Ph.D.,Kenneth D.Kochanek,M.A., Sherry L.Murphy,B.S.,BettyL.Smith,B.S.Ed.,Divisionof Vital Statistics
...
[20] Deaths: Final Data for 2017, by Kenneth D. Kochanek, M.A., Sherry L. Murphy, B.S., Jiaquan Xu, M.D., and Elizabeth Arias, Ph.D., Division of Vital Statistics
[21] Mortality in the United States, 2018 Jiaquan Xu, M.D., Sherry L. Murphy, B.S., Kenneth D. Kochanek, M.A., and Elizabeth Arias, Ph.D.
Supplements of the main material:
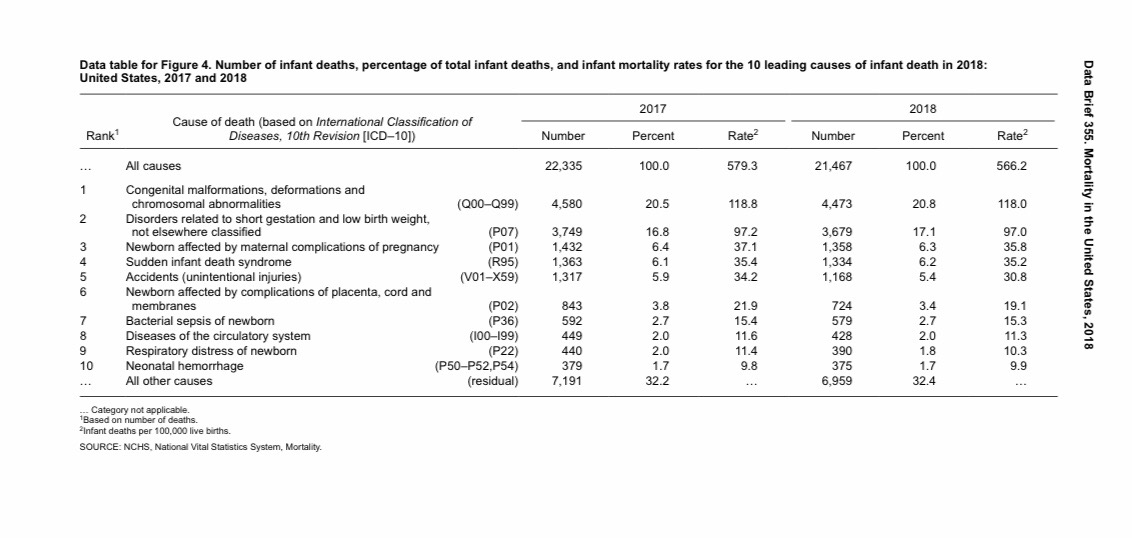
Official U.S. annual mortality figures for 2018.
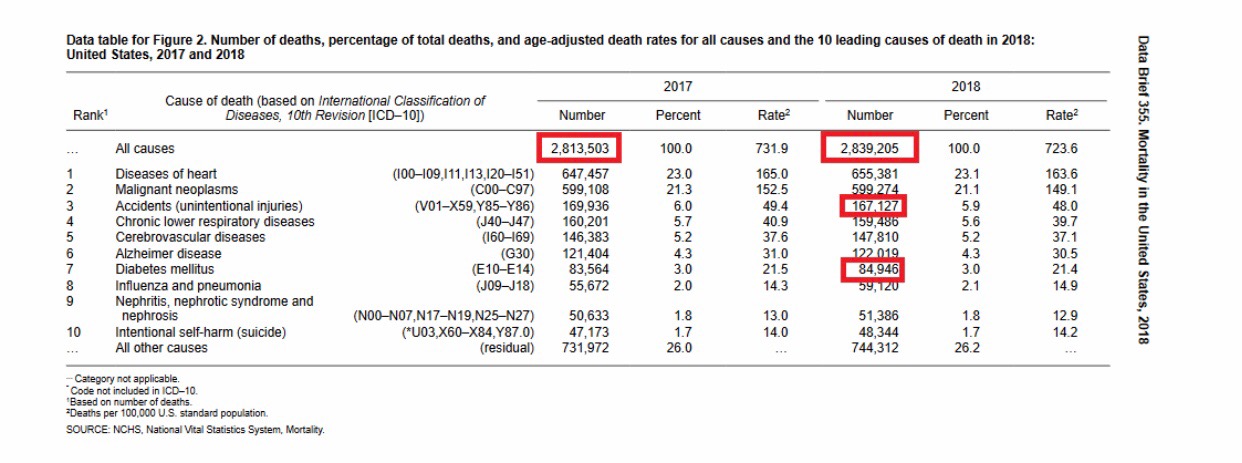
During this period in the USA from 'COVID-19 died 'more than in n 8 and about the same as in p 4.
On average, 54,000 people died per week in 2017-2018.
Now try to explain the rise in deaths from official data.

Weekly growth of 42% at the maximum (highlighted in red) ?
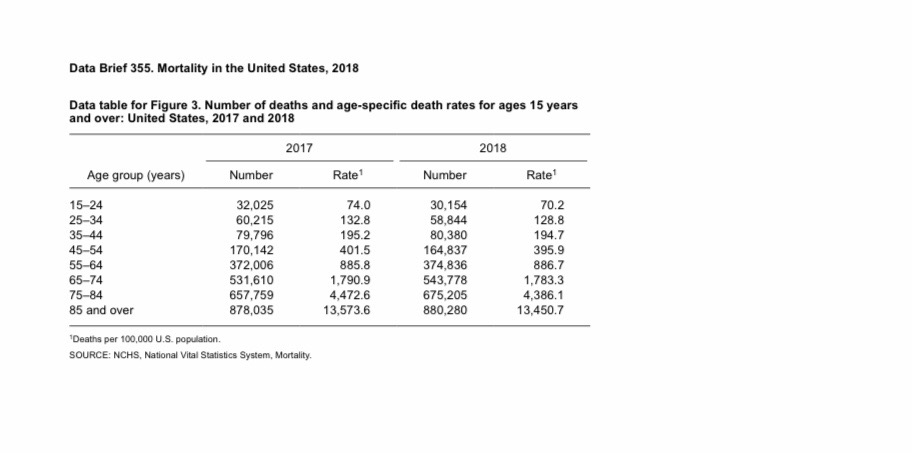
The 2018 report is and below is the tables out of it
https://www.cdc.gov/nchs/data/databriefs/db355_tables-508.pdf#page=2
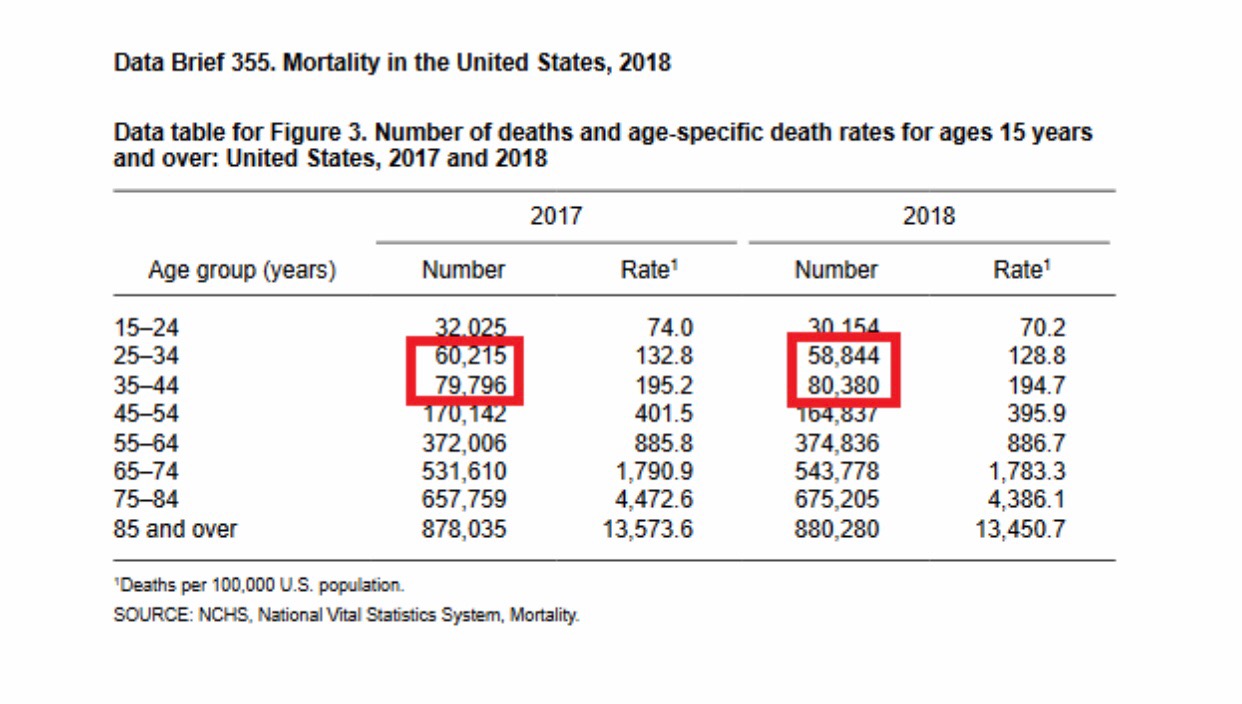
At the age of 25-44 approximately 140,000 deaths per year or approximately 2,685 deaths per week.
Now 3600
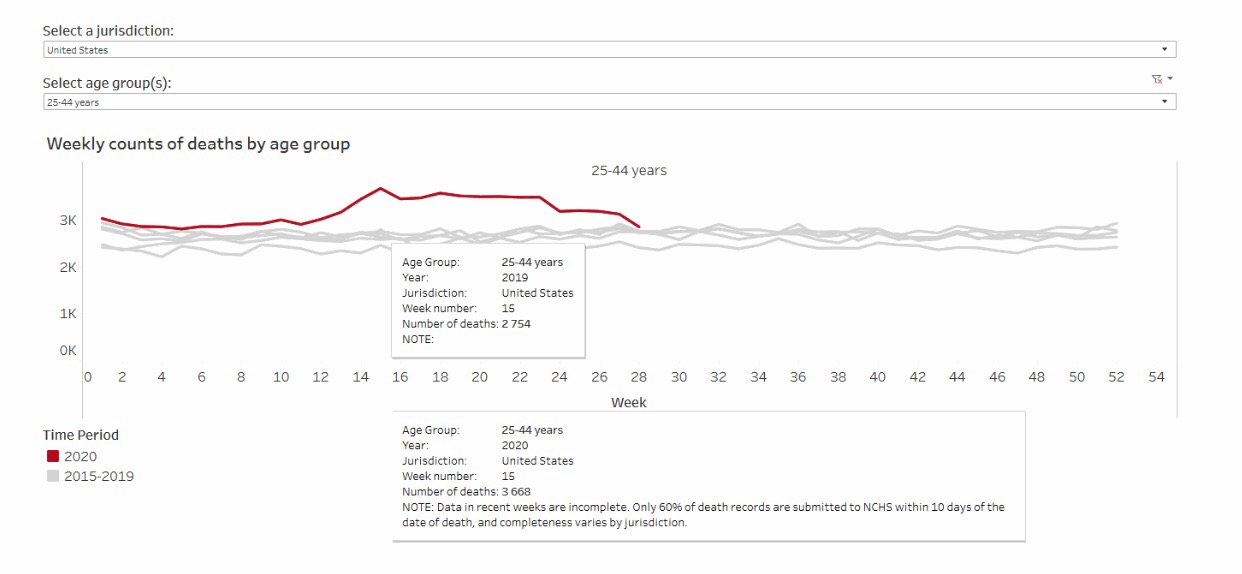
At the time of the data in the tables in the U.S. COVID-19 died more than in p 8 and about the same as in p 4.
That is, diagnosed with COVID more than flu. Why?
Because in the flu year do about 300,000 tests for influenza, mostly in really strong patients.
And 51 million tests have already been done on COVID for 331 million people (about one in six Americans tested and is mostly healthy).
The overall mortality rate was not given as of 23/03/2021 .
When we see reliable data then will speak 🗣
On average, 54,000 people died per week in 2017-2018.
Well, first of all, on average a week for a year - it's known as "the average temperature of a hospital."
The mortality graph is seasonal, we look above.
Secondly, even counting 365/7-52.14 weeks a year, it turns out:
year, deaths per million deaths in total, deaths per week, to the previous year:
1997 8647 2314245 44385
1998 8647 2337256 44827 +0.99%
1999 8770 2391399 45865 +2.32%
2000 8731 2403351 46094 +0.50%
2001 8485 2416425 46345 +0.54%
2002 8473 2443387 46862 +1.12%
2003 8419 2448288 46956 +0.20%
2004 8165 2397615 45984 -2.07%
2005 8259 2448017 46951 +2.10%
2006 8104 2426264 46534 -0.89%
2007 8036 2423712 46485 -0.11%
2008 8130 2471984 47411 +1.99%
2009 7938 2437163 46743 -1.41%
2010 7995 2468435 47342 +1.28%
2011 8073 2515458 48244 +1.90%
2012 8102 2543279 48778 +1.11%
2013 8215 2596993 49808 +2.11%
2014 8237 2626418 50372 +1.13%
2015 8440 2712630 52026 +3.28%
2016 8493 2744248 52632 +1.17%
2017 8638 2813503 53961 +2.52%
2018 8652 2839205 54453 +0.91%
2019 8800 2909000 55792 +2.46%
As I explained in the previous article, as well as in this article above, the U.S. population is growing 🇺🇸, and normal mortality is growing (as well as the average age is growing).
The absolute value of weekly mortality is increasing almost continuously from year to year.
In 2015, it was 3.3%. Tragedy? Pandemic?
Once again, look at the table and explain the increase in weekly mortality of 42% in red squares.
And just below the weekly increase in deaths among young 25-44 by 35-40% !?️
We estimate that by the end of 2020, the population of the United States of America was 332,524,270. In 2020, the population of the United States of America increased by approximately 2,485,194. With the population of the United States of America estimated at 330,039,076 at the beginning of the year, the annual increase was 0.75%.
Below are the key figures for the United States population in 2020:
Born: 4,158,492
Deaths: 2,719,522
Natural increase: 1,438,970
Net migration: 1,046,224
Men: 164,582,719 (estimated as of December 31, 2020)
Women: 167,941,551 (estimated as of December 31, 2020)
https://countrymeters.info/ru/United_States_of_America_(USA)
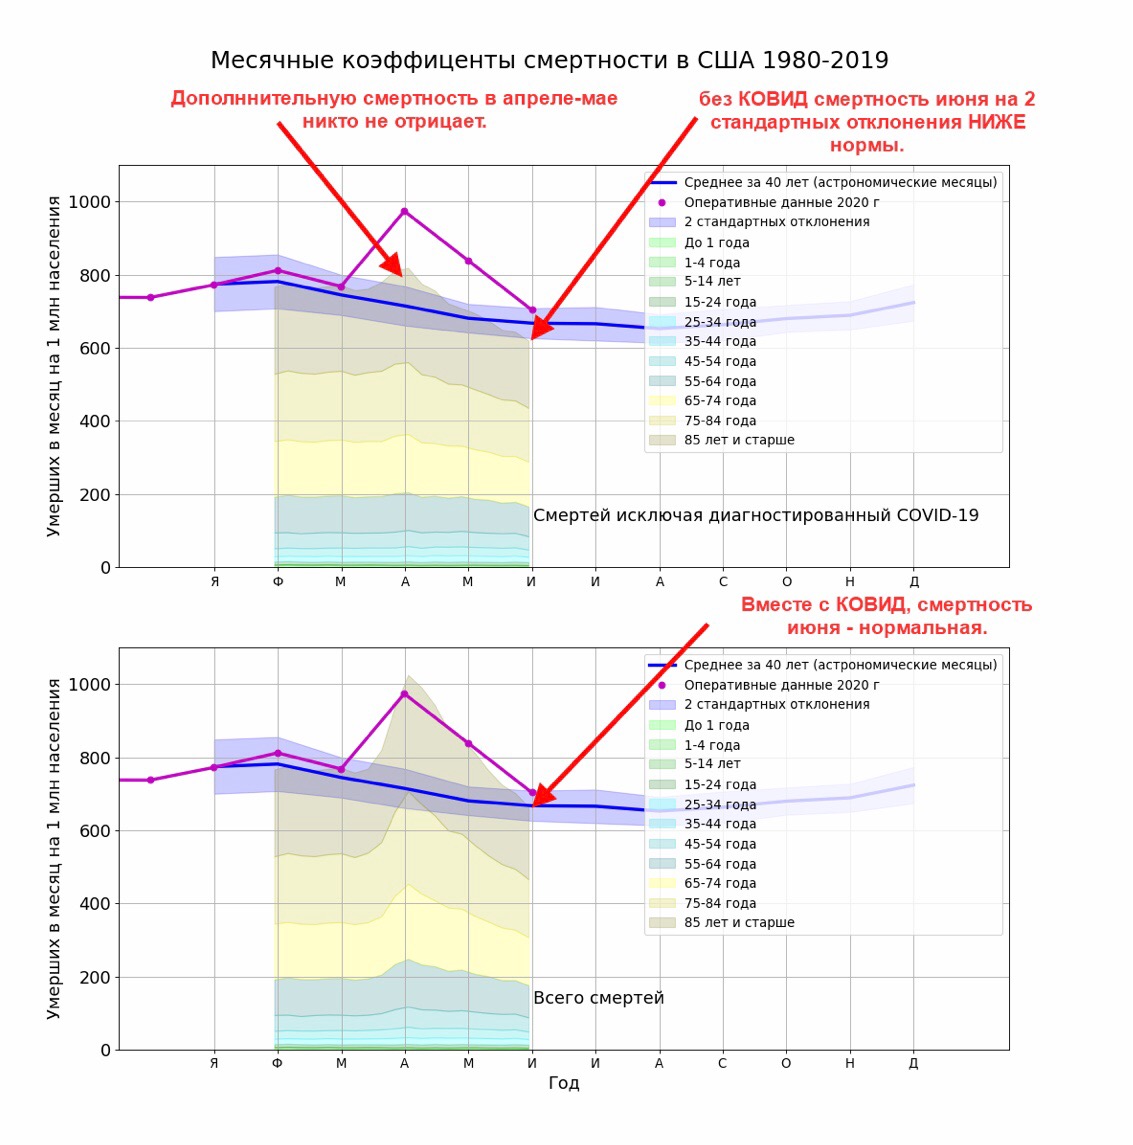
Once again in a more convenient range, the graph shows June's mortality by two standard deviations below the ordinar !?️ How can this be explained?
Correct. "Heart" and "kidney" are written "covidous."
They die from the heart and at the time of two years.
It happens, too.
Where did the additional mortality in April come from in New York?
How from where?
I was writing about New York. Not only did all the problems have been arranged in one city, so it was bought by former Mayor Giuliani, it is his handiwork.
There is a website: https://countrymeters.info/
The site doesn't care, there's a covid, there's no cowid.
Data in August and a sign was drawn up from it:
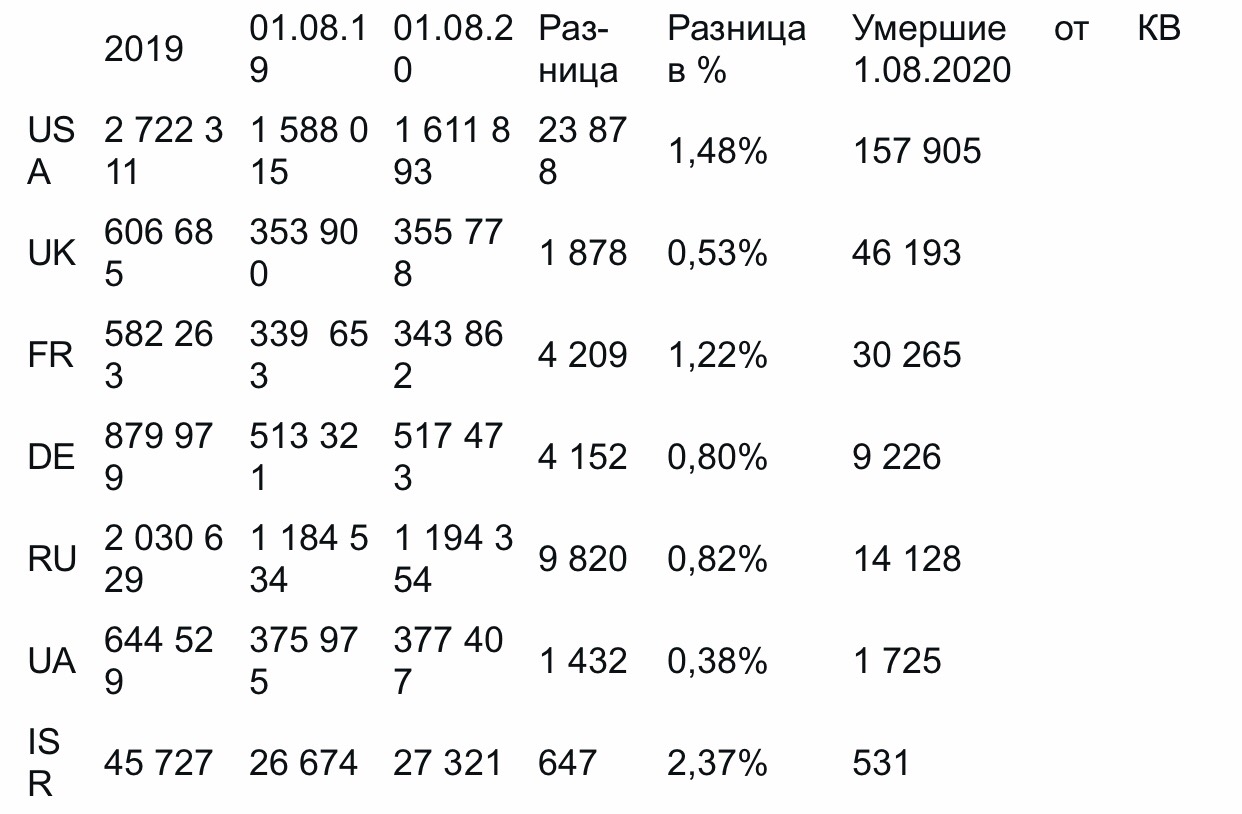
What do you see?
I can see
1? In all countries, there is a slight increase in mortality as of 1.08. Year
2) In all (almost) countries, this increase in mortality is much less than the stated death rate from a cooida. The exception is Israel. 531 died and 647 died. The difference in percentage is also the greatest... Israeli medicine 🏥 such ... Or is Benya like that?
On the Russian Federation in terms of money 💵 everything is clear, I presented a lot of material earlier . For officials it is huge money, billions of stolen money in a very short time. Without this special operation, it would be impossible to steal such a quantity.
In August, 137 thousand people were fined 5 thousand rubles for the lack of masks in Moscow. Sobyanin put 685 million rubles in his pocket. And you think he's going to give up that Gesheft? Never, that's why a covid is forever if the FBI and the U.S. administration don't stop 🇺🇸 their domestic criminals.
About the income from the sale of masks and gloves figures I have so far given . But you can estimate : modestly 10 million inhabitants - 30 rubles and 5 sets per month (greedy to change every two hours) - 1.5 billion rubles per month.
It's just from the citizens. And for hospitals and state institutions masks are purchased at the expense of the budget. Gold mine, Klondike, Eldorado without hassle.
Do not get sick please by autumn seasonal flu gentlemen officers and friends ! And also please watch your population of billionaires and foundations, especially journalists! They seem to have a problem 😔
All my volume materials from December 2019, versions, testimonies and suspicions of specific participants in this special operation are in the hands of some of my friends on Instagram. There is also a huge group of unidentified individuals of this scam of the century.
I am ready to participate in the investigation of crimes against humanity.

Thank you for your attention.


ϒ𝔬𝔲𝔯 𝔍𝔬𝔨𝔢𝔯 🃏