testing
Kerala ohari vipany
What is a candlestick pattern?
Japanese candlestick patterns originated from a Japanese rice trader called, Munehisa Homma during the 1700s.
Almost 300 years later:
It was introduced to the western world by Steve Nison, in his book called, Japanese Candlestick Charting Techniques.
Now, it’s likely the original ideas have been modified which now results in the candlestick patterns you use today.
Anyway, that’s the brief history behind Japanese candlestick patterns.
Moving on…
Let’s learn how to read a candlestick chart…
So, how do you read a Japanese candlestick chart?
Now, every candlestick pattern has 4 data points:
Open – The opening price
High – The highest price over a fixed time period
Low – The lowest price over a fixed time period
Close – The closing price
Here’s what I mean:
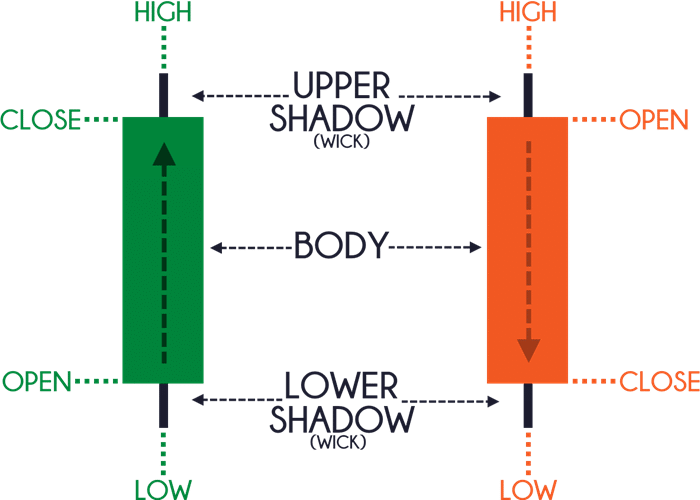
Remember…
For a Bullish candle, the open is always BELOW the close.
For a Bearish candle, the open is always ABOVE the close.
Bullish reversal candlestick patterns
Bullish reversal candlestick patterns signify that buyers are momentarily in control.
However, it doesn’t mean you should go long immediately when you spot such a pattern because it doesn’t offer you an “edge” in the markets.
Instead, you want to combine candlestick patterns with other tools so you can find a high probability trading setup (more on that later).
For now, these are 5 bullish reversal candlestick patterns you should know:
- Hammer
- Bullish Engulfing Pattern
- Piercing Pattern
- Tweezer Bottom