Gold
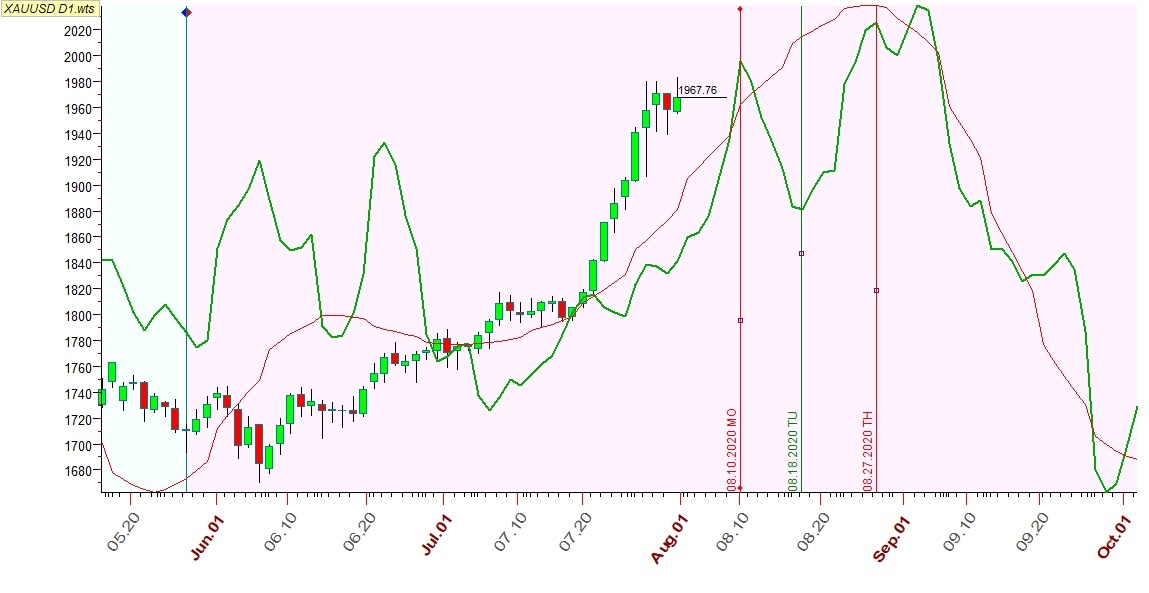
TS Forecasts. Sergey IvanovTrading Spectrum suggests 21d cycle as the most efficient while its visual estimation doesn't correspond to this conclusion. 3 week cycle precisely working at smaller time frame, but D1 Q-Sp analysis suggests other cycles to build projection line. One of the common cycle for T-Sp and Q-Sp is inverted 71d. Here is projection from both of the modules.
As you can see a short-run cutback based on trading cycle is possible from MO, while the most sufficient period for bearish turning point is dated to the 3rd decade of Aug.

Annual cycle analysis suggests further growth continuation after a short-run cutback in the first half of Aug.
Gold traditionally has a close similarity with Silver. Similarity module projects two dates for dynamic drop of Gold: 13th and 24th of Aug.

TPA suggest further consolidation at 1900-1980 and probably a new high by the 20ths of Aug. It is not reasonable to look for bearish TP this week for a long-run, but for a week only.

As for smaller time frame M30 TPA, then it clearly shows that older red rising ZZ leg wasn't accomplished and represented by smaller blue ZZ. I expect some kind of consolidation between depicted resistance/support levels.
