GBPUSD
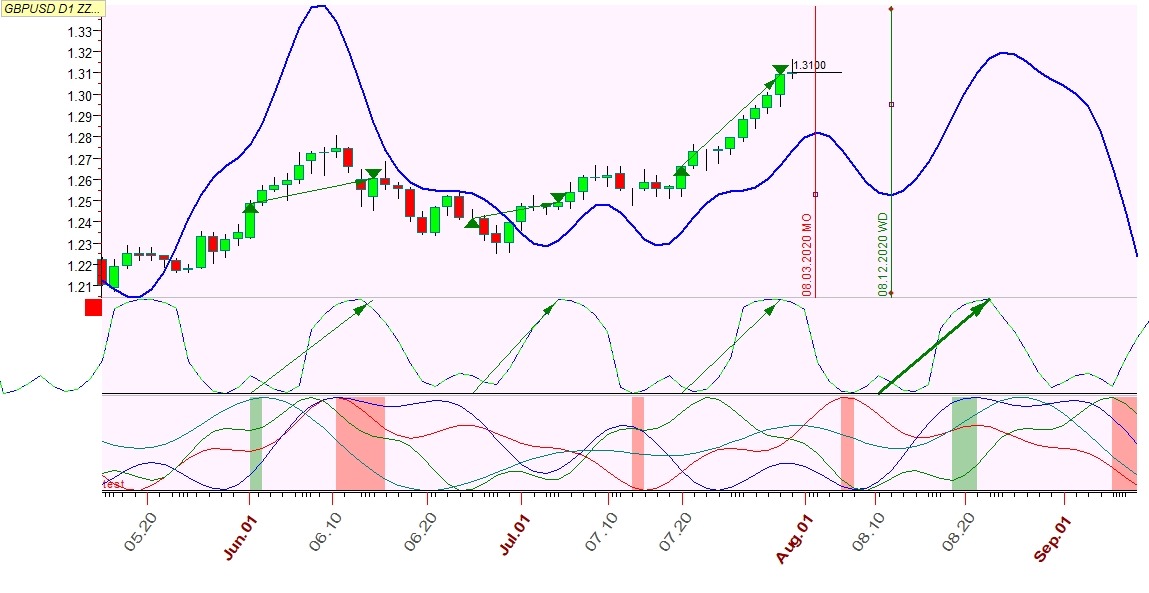
TS Forecasts. Sergey IvanovWe don't care how accurate Q-Sp projection line toward price chart. Instead, we just look for confluences up-n-down phases at Q-Sp, Trading Spectrum cycle and price chart. Both of the projections predict a cutback from coming week.
The same outcome got from confluence of Q-Sp with another T-Sp cycle of higher value but lesser quality (57 days):
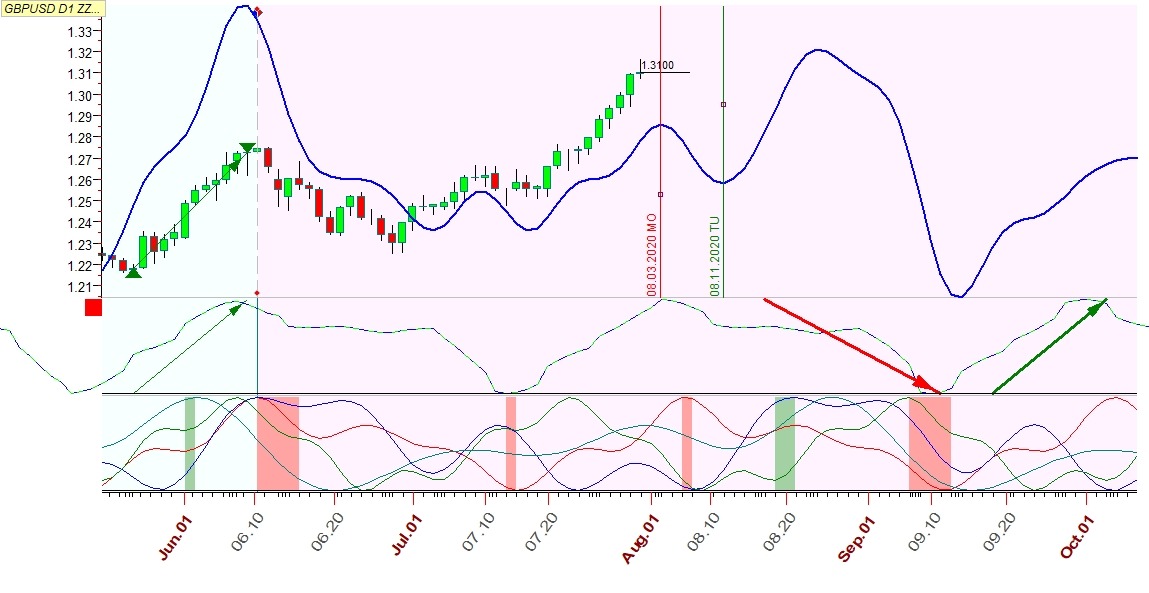
It might be translated that further increase (from the 11th of Aug) will be developed under contradicted conditions and resulted into corrective or limited growth with not much higher new top.
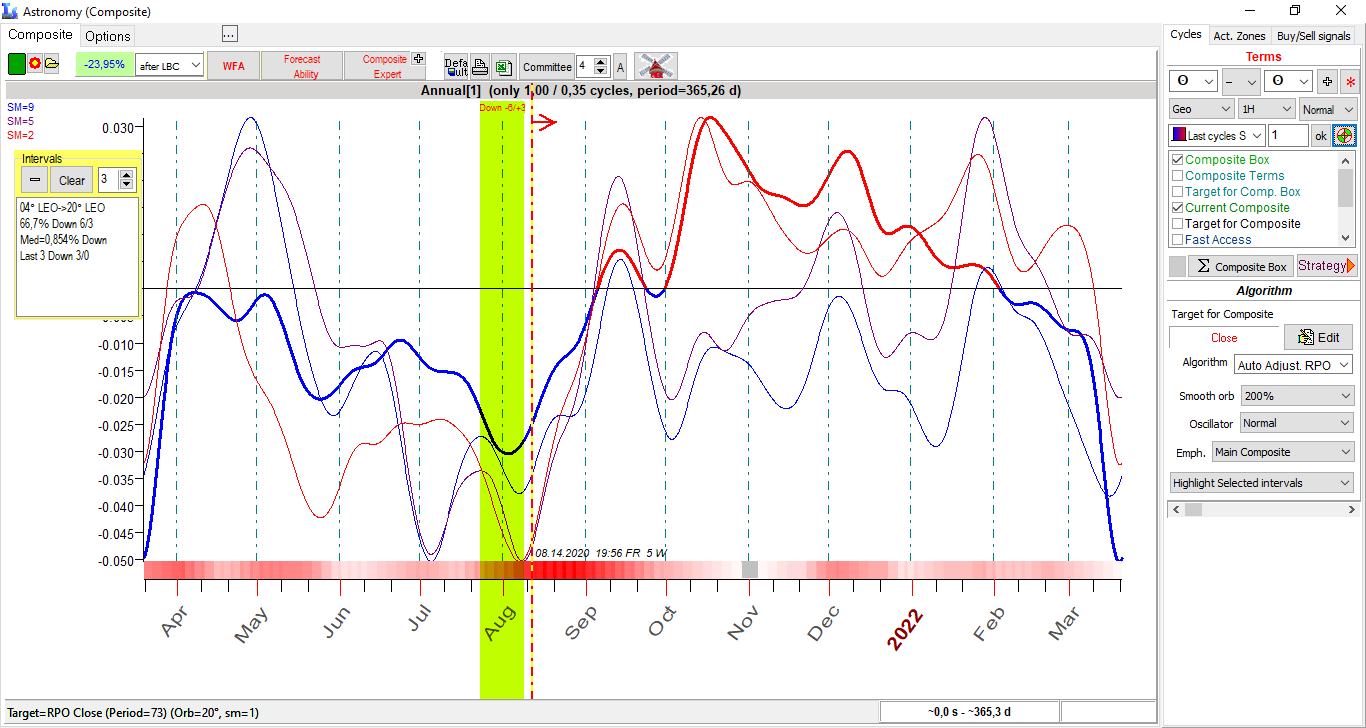
Seasonal curve also support a short-run decline prior statistically strong bullish turn from a middle of August.
Turning points analysis projects decline to 1.2775-1.2800 and, then, to 1.2620-1.2665.
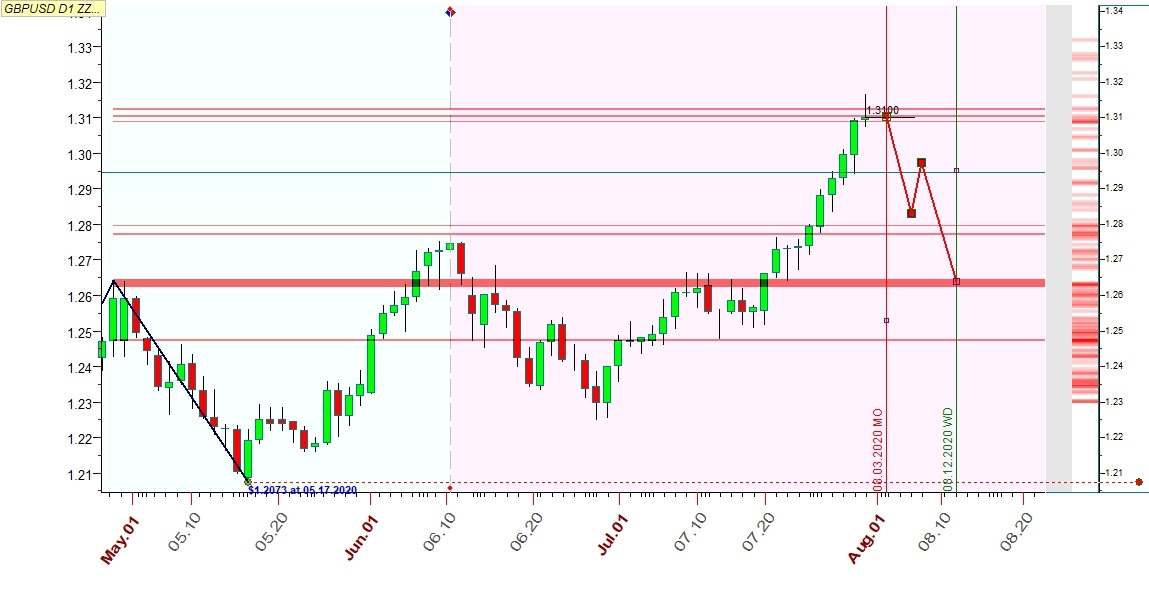
At lower time frames sale from MO is suggested. Yet, it is preferably to trade bearish from one of the resistant area (1.3120-1.3135). In case of dynamic decline from the first hours it is reasonable to look for bearish opportunities after consolidation under one of support levels (1.3035; 1.2975).
